Antrodia cinnamomea induces anti-tumor activity by inhibiting the STAT3 signaling pathway in lung cancer cells
Figures
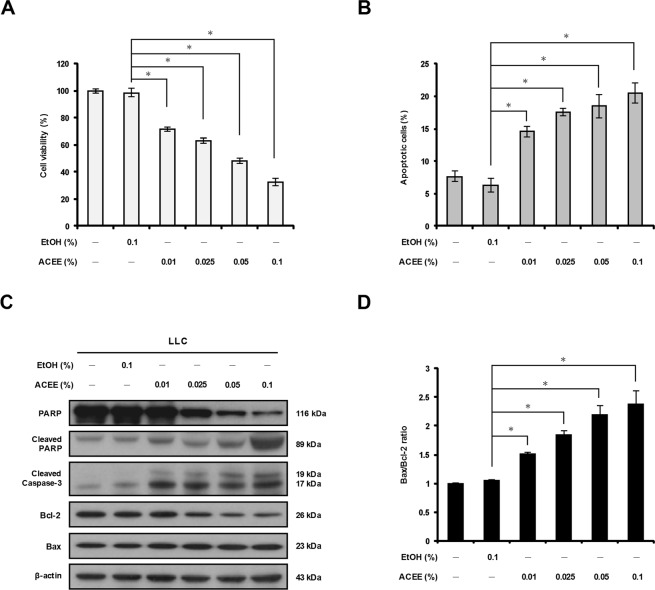
Figure 1
ACEE decreases viability of lung…
Figure 1
ACEE decreases viability of lung cancer cells by inducing apoptosis. ( A )…
Figure 1 ACEE decreases viability of lung cancer cells by inducing apoptosis. (A) LLC cells were treated with ACEE (0.01–0.1%) for 24 h, and cell viability was monitored using the MTT assay. (B) ACEE induces apoptosis in LLC cells. Cells were treated with ACEE for 24 h and stained with annexin V/propidium iodide (PI) prior to flow cytometry analysis. Apoptotic cells were defined as annexin V+/PI− plus annexin V+/PI+ cells. (C) Western blotting of PARP, cleaved PARP, cleaved caspase-3, Bcl-2 and Bax in ACEE-treated LLC cells. β-actin was used as an internal control. (D) Relative Bax/Bcl-2 ratio of protein levels in ACEE-treated LLC cells was determined by densitometry. Data are presented as means ± SEM of three experiments preformed in duplicate. *P < 0.05 versus control ethanol-treated cells.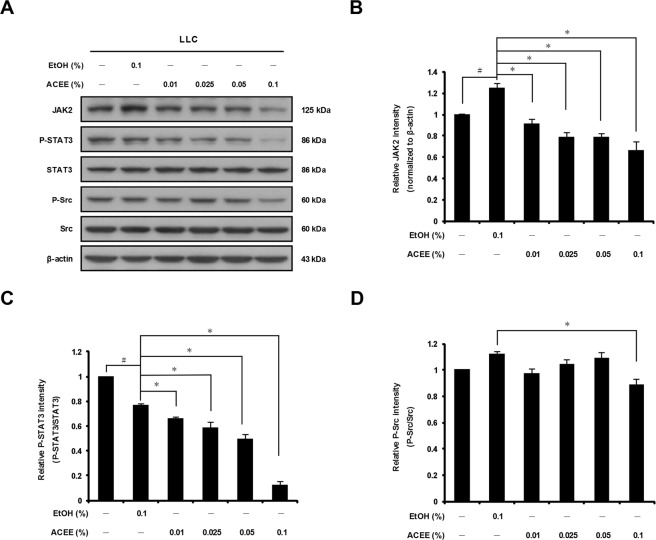
Figure 2
ACEE inhibits activation of the…
Figure 2
ACEE inhibits activation of the JAK2/STAT3 signaling pathway in LLC cells. ( A…
Figure 2 ACEE inhibits activation of the JAK2/STAT3 signaling pathway in LLC cells. (A) Cells were treated with ACEE for 6 h. Expression of JAK2, p-STAT3, STAT3, p-Src, Src, and β-actin was examined by Western blotting. (B) Relative band density of JAK2 was quantified by densitometry and normalized to β-actin. Ratios of P-STAT3 (C) and P-Src (D) normalized to the respective total protein level are shown. Data are presented as means ± SEM of three experiments preformed in duplicate. #P < 0.05 versus untreated cells. *P < 0.05 versus control ethanol-treated cells.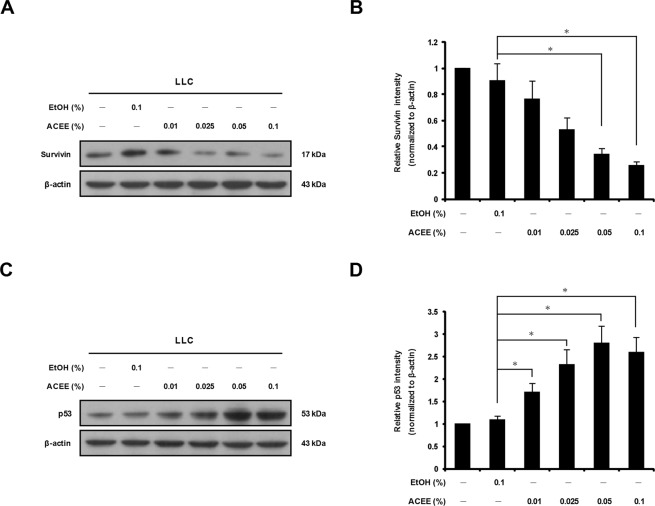
Figure 3
ACEE induces down-regulation of survivin…
Figure 3
ACEE induces down-regulation of survivin and up-regulation of p53 in LLC cells. (…
Figure 3 ACEE induces down-regulation of survivin and up-regulation of p53 in LLC cells. (A) Cells were treated with ACEE for 6 h, and protein expression of survivin was analyzed by Western blotting. (B) The relative band density of survivin was quantified by densitometry and normalized to β-actin. (C) Cells were treated with ACEE for 24 h, and Western blotting was performed to assess p53 protein expression. (D) Relative band density of p53 was quantified by densitometry and normalized to β-actin. Data are presented as means ± SEM of three experiments preformed in duplicate. *P < 0.05 versus control ethanol-treated cells.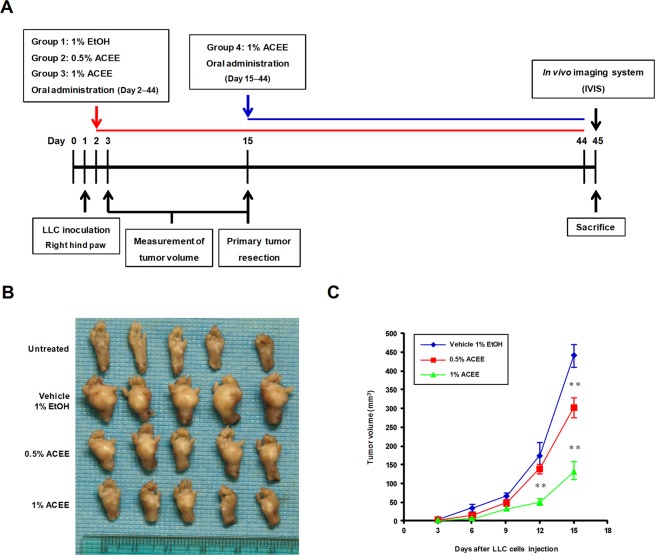
Figure 4
ACEE inhibits tumor growth in…
Figure 4
ACEE inhibits tumor growth in LLC tumor-bearing mice. ( A ) Schedule of…
Figure 4 ACEE inhibits tumor growth in LLC tumor-bearing mice. (A) Schedule of in vivo experiments. LLC-LT cells were inoculated into the right hind paw of C57BL/6 mice. ACEE (0.5 and 1%) was orally administered five times per week. Primary tumors were resected on day 15, and mice were sacrificed on day 45. (B) Representative images of primary tumors for the vehicle control and ACEE-treated groups. (C) Volume (mm3) of developing LLC paw tumors in vehicle and ACEE-treated mice was assessed by using a digital caliper on day 3, 6, 9, 12 and 15. Data are presented as means ± SEM (n = 5 in each group). **P < 0.01 versus the vehicle group.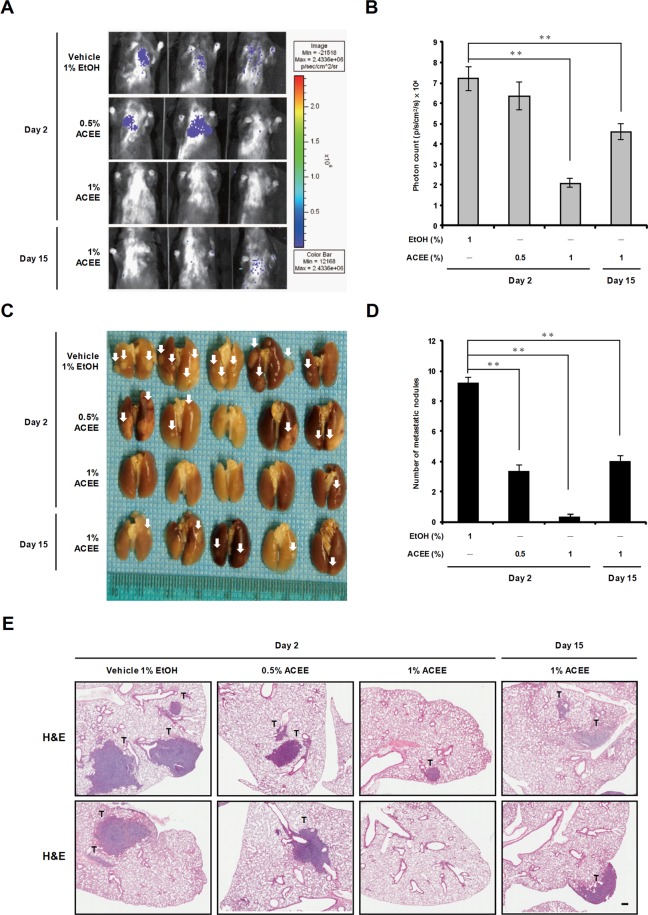
Figure 5
ACEE inhibits lung metastasis of…
Figure 5
ACEE inhibits lung metastasis of LLC cells in vivo . ( A )…
Figure 5 ACEE inhibits lung metastasis of LLC cells in vivo. (A) Bioluminescence images of control and ACEE-treated mice were obtained using the Bioluminescent IVIS Imaging System. The color scale depicts photon flux (photons/sec/cm2/steradian). (B) Magnitude of bioluminescent signal (p/s/cm2/s) representing tumor growth in vivo on day 45. (C) Lung metastatic nodules were visualized to show the inhibitory effects of ACEE on LLC tumor. White arrowheads indicate metastatic nodules. (D) Number of lung metastatic nodules formed by LLC cells in each group. (E) Representative lung tissue sections were stained with H&E. Tumor tissues are marked with “T”. Scale bar = 200 μm. Data are presented as means ± SEM (n = 5). **P < 0.01 versus the vehicle group.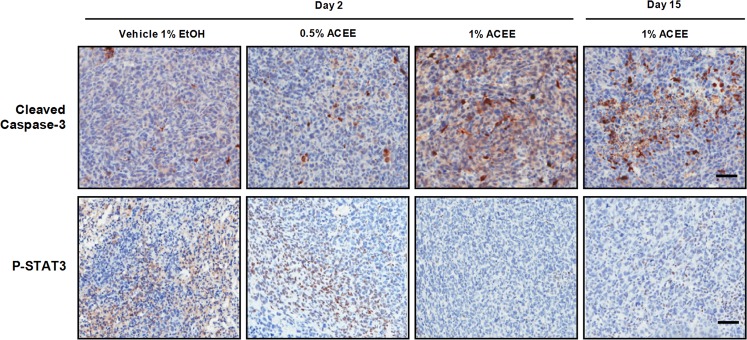
Figure 6
ACEE suppresses lung tumor growth…
Figure 6
ACEE suppresses lung tumor growth in vivo by inducing cleavage of caspase-3 and…
Figure 6 ACEE suppresses lung tumor growth in vivo by inducing cleavage of caspase-3 and by reducing P-STAT3 level. Immunohistochemistry staining was used to examine cleaved caspase-3 and P-STAT3 levels in mouse tumor tissues. Representative images of LLC cells that stained positive for cleaved caspase-3 or P-STAT3 in tumor sections obtained from control vehicle and ACEE-treated mice on day 45. Scale bar = 100 μm.