Antrodia cinnamomea induces autophagic cell death via the CHOP/TRB3/Akt/mTOR pathway in colorectal cancer cells
Figures
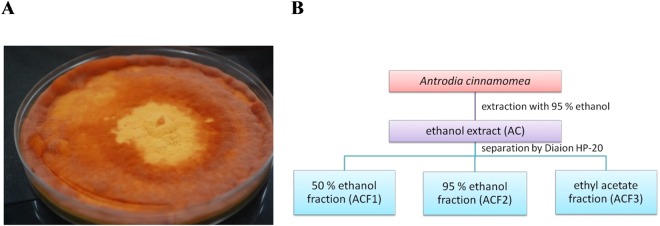
Figure 1
A. cinnamomea extract isolation. (…Figure 1
A. cinnamomea extract isolation. ( A ) Morphological observations of the A. cinnamomea… Figure 1 A. cinnamomea extract isolation. (A) Morphological observations of the A. cinnamomea fruiting bodies analysed in this study. (B) Scheme depicting the methodology used to obtain AC, ACF1, ACF2, and ACF3.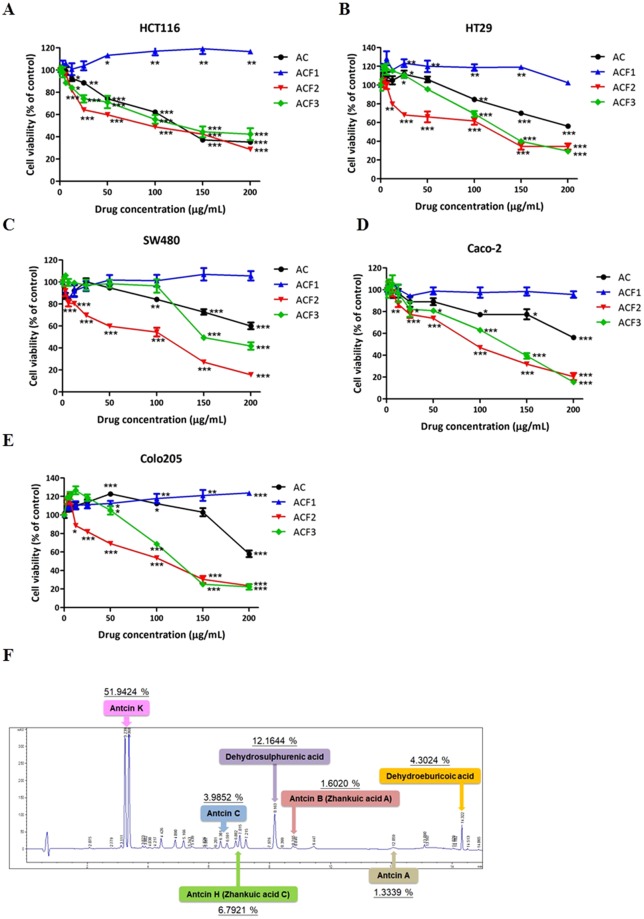
Figure 2
Effect of A. cinnamomea extract…
Figure 2
Effect of A. cinnamomea extract treatment on the cell viability of colorectal cancer…
Figure 2 Effect of A. cinnamomea extract treatment on the cell viability of colorectal cancer cell lines and HPLC chemical fingerprinting. (A) HCT116, (B) HT29, (C) SW480, (D) Caco-2 and (E) Colo205 cells were treated with AC, ACF1, ACF2, and ACF3 for 48 h. The cell viability was analysed by the MTS assay and expressed as cell viability (% control). All results are expressed as the mean ± standard deviation of three independent experiments. P values of statistical significance are represented as *p < 0.05, **p < 0.005 and ***p < 0.0005. (F) HPLC chemical fingerprint of ACF2. The compounds are antcin K, antcin C, antcin H (Zhankuic acid C), dehydrosulphurenic acid, antcin B (Zhankuic acid A), antcin A, and dehydroeburicoic acid.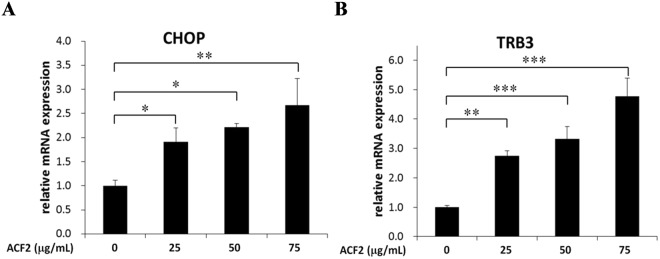
Figure 3
Effect of ACF2 treatment on…
Figure 3
Effect of ACF2 treatment on CHOP and TRB3 mRNA expression. The levels of…
Figure 3 Effect of ACF2 treatment on CHOP and TRB3 mRNA expression. The levels of (A) CHOP and (B) TRB3 mRNA were analysed by real-time PCR after HCT116 cells were treated with 25, 50, and 75 μg/ml ACF2 for 24 h. ACF2 increased CHOP and TRB3 mRNA expression in a dose-dependent manner. All of the results are expressed as the mean ± standard deviation of three independent experiments. P values of statistical significance are represented as *p < 0.05, **p < 0.005 and ***p < 0.0005.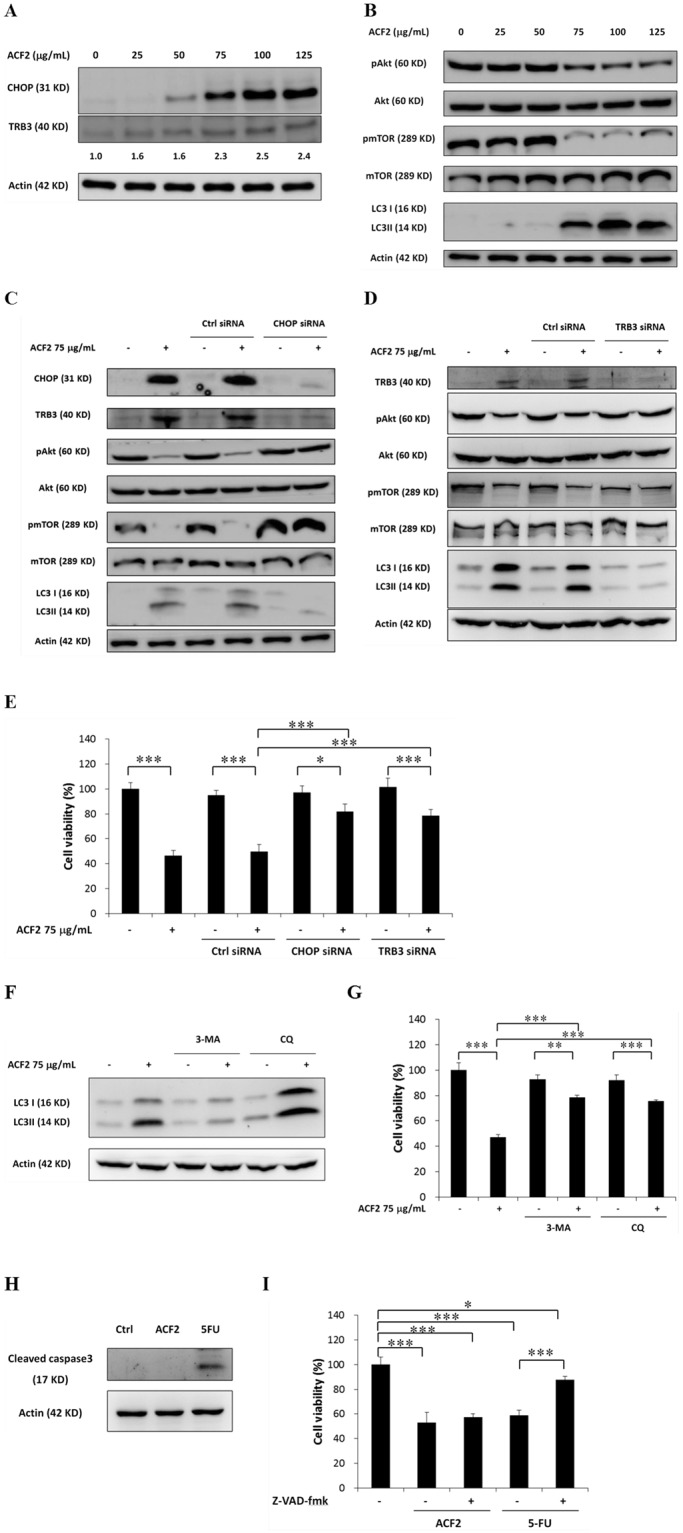
Figure 4
Effect of ACF2 treatment on…
Figure 4
Effect of ACF2 treatment on the CHOP/TRB3/Akt/mTOR pathway and autophagic cell death. HCT116…
Figure 4 Effect of ACF2 treatment on the CHOP/TRB3/Akt/mTOR pathway and autophagic cell death. HCT116 cells were treated with 25, 50, 75, 100, and 125 μg/ml ACF2 for 24 h. The levels of (A) CHOP, TRB3, (B) total and phosphorylated Akt, total and phosphorylated mTOR, LC3, and actin protein were analysed by Western blot. Densitometry analysis of TRB3 expression was performed using ImageJ software. HCT116 cells were transfected with (C) CHOP siRNA, (D) TRB3 siRNA, or control siRNA. Non-transfected or siRNA-transfected HCT116 cells were treated with 75 μg/ml ACF2 for 24 h. Representative Western blot results of CHOP, TRB3, total and phosphorylated Akt, total and phosphorylated mTOR, LC3, and actin protein are shown. (E) Non-transfected and siRNA-transfected HCT116 cells were treated with 75 μg/ml ACF2 for 48 h. The cell viability was analysed by the MTS assay and expressed as cell viability (% control). HCT116 cells were treated with (F) 0.75 mM 3-MA, 10 μM CQ, (H) 100 μM 5-FU, and 75 μg/ml ACF2 for 24 h. (F) LC3, (H) cleaved caspase3, and actin protein were analysed by Western blot. HCT116 cells were treated with (G) 0.75 mM 3-MA, 10 μM CQ, (H) 100 μM 5-FU, 20 μM Z-VAD-fmk, and 75 μg/ml ACF2 for 48 h. Cell viability was analysed by the MTS assay and expressed as cell viability (% control). 5-FU was used as a positive control. Actin protein was used to normalize the results in (A–D), (F), and (H). The groups of images were cropped from different blots. Full-length blots are presented in Supplementary Figures 2 and 3. (E), (G), and (I) All results are expressed as the mean ± standard deviation of three independent experiments. P values of statistical significance are represented as *p < 0.05, **p < 0.005 and ***p < 0.0005.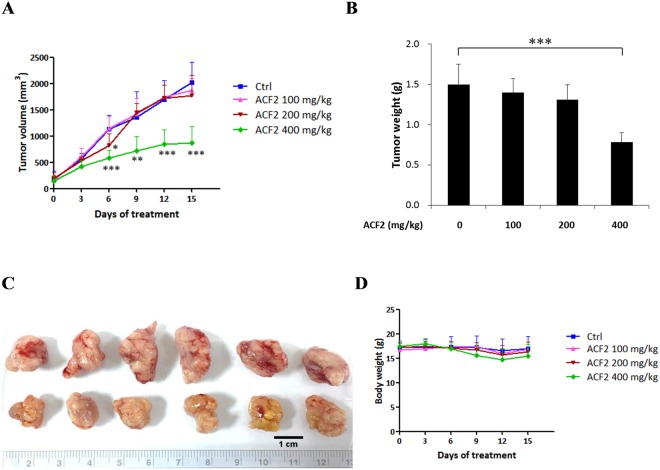
Figure 5
Effect of ACF2 treatment on…
Figure 5
Effect of ACF2 treatment on tumour volume, tumour weight, and body weight in…
Figure 5 Effect of ACF2 treatment on tumour volume, tumour weight, and body weight in human HCT116 xenograft tumour-bearing mice. On the seventh day after tumour inoculation, the effects of ACF2 were evaluated. Animals were divided into four groups, including the control group (treated with 0.2 mL of normal saline) and the 100, 200, and 400 mg/kg ACF2 treatment groups. (A) Average tumour volume. (B) Average tumour weight. (C) Representative subcutaneous tumours in the control and 400 mg/kg ACF2 treatment groups. (D) Average body weight. All results are expressed as the mean ± standard deviation; N = 6 for all groups. P values of statistical significance are represented as *p < 0.05 and ***p < 0.0005.