Antrodia cinnamomea Galactomannan Elicits Immuno-stimulatory Activity Through Toll-like Receptor 4
Abstract
Antrodia cinnamomea (A. cinnamomea) is a medicinal fungus used in traditional Chinese medicine to treat different kinds of ailments, including liver diseases, abdominal pain, drug intoxication, diarrhea, itchy skin, hypertension, and cancer. Polysaccharides have been identified as one of the major pharmacologically active ingredients present in A. cinnamomea. The present study aims to investigate the immunoenhancing activity of galactomannan isolated from A. cinnamomea. The cold water-soluble polysaccharide (galactomannan-repeated; MW>70 kDa; named ACP) of A. cinnamomea was isolated, and immunostimulatory properties were studied through different immune cell models including mouse macrophages and human dendritic cells. Through Toll-like receptor 4, ACP stimulated tumor necrosis factor-α (TNF-α) and interleukin-6 (IL-6) in J774A.1 mouse macrophages, mouse peritoneal macrophages and human dendritic cells. It was further identified that ACP elicited its immunostimulatory activity through protein kinase C-α (PKC-α) and mitogen activated protein kinases (MAPK) phosphorylation. Furthermore, ACP exerted the endotoxin tolerance-like effect through NF-κB inhibition. These findings demonstrate the potential of A. cinnamomea galactomannan as an immunostimulator or an adjuvant in immunotherapy and vaccination.
Figures 
Figure 1
Structure of the octasaccharide repeating…
Figure 1
Structure of the octasaccharide repeating unit of the Antrodia cinnamomea galactomannan (ACP).
Figure 1 Structure of the octasaccharide repeating unit of the Antrodia cinnamomea galactomannan (ACP).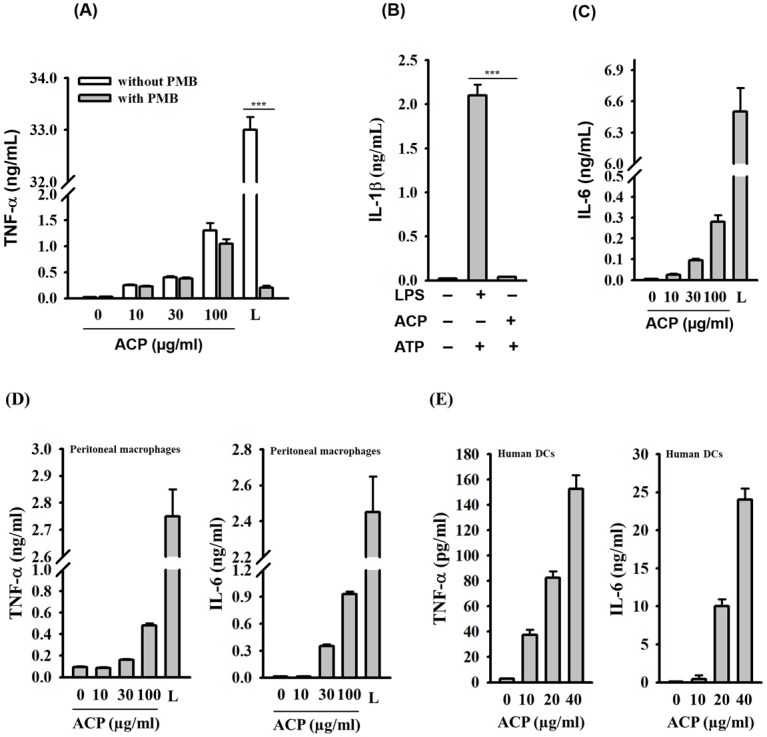
Figure 2
ACP induces cytokine expression in…Figure 2
ACP induces cytokine expression in macrophages and dendritic cells. ( A ) J774A.1… Figure 2 ACP induces cytokine expression in macrophages and dendritic cells. (A) J774A.1 macrophages were incubated for 30 min with or without polymyxin B (PMB) (10 µg/mL) and then for 24 h with or without ACP or LPS (1 µg/mL). The levels of TNF-α in the culture medium were measured by ELISA. (B) J774A.1 macrophages were incubated for 5.5 h with or without ACP (100 µg/mL) or LPS (1 µg/mL) and then for 30 min with or without ATP (5 mM). The levels of IL-1β in the culture medium were measured by ELISA. (C) J774A.1 macrophages were incubated for 24 h with or without ACP or LPS (1 µg/mL). The levels of IL-6 in the culture medium were measured by ELISA. (D) Mouse peritoneal macrophages were incubated for 24 h with or without ACP or LPS (1 µg/mL). The levels of TNF-α and IL-6 in the culture medium were measured by ELISA. (E) Human monocyte-derived dendritic cells were incubated for 24 h with or without ACP or LPS (1 µg/mL). The levels of TNF- α and IL-6 in the culture medium were measured by ELISA. The data are expressed as the means ± SD of three separate experiments. *** indicates a significant difference at the level of p< 0.001. L: LPS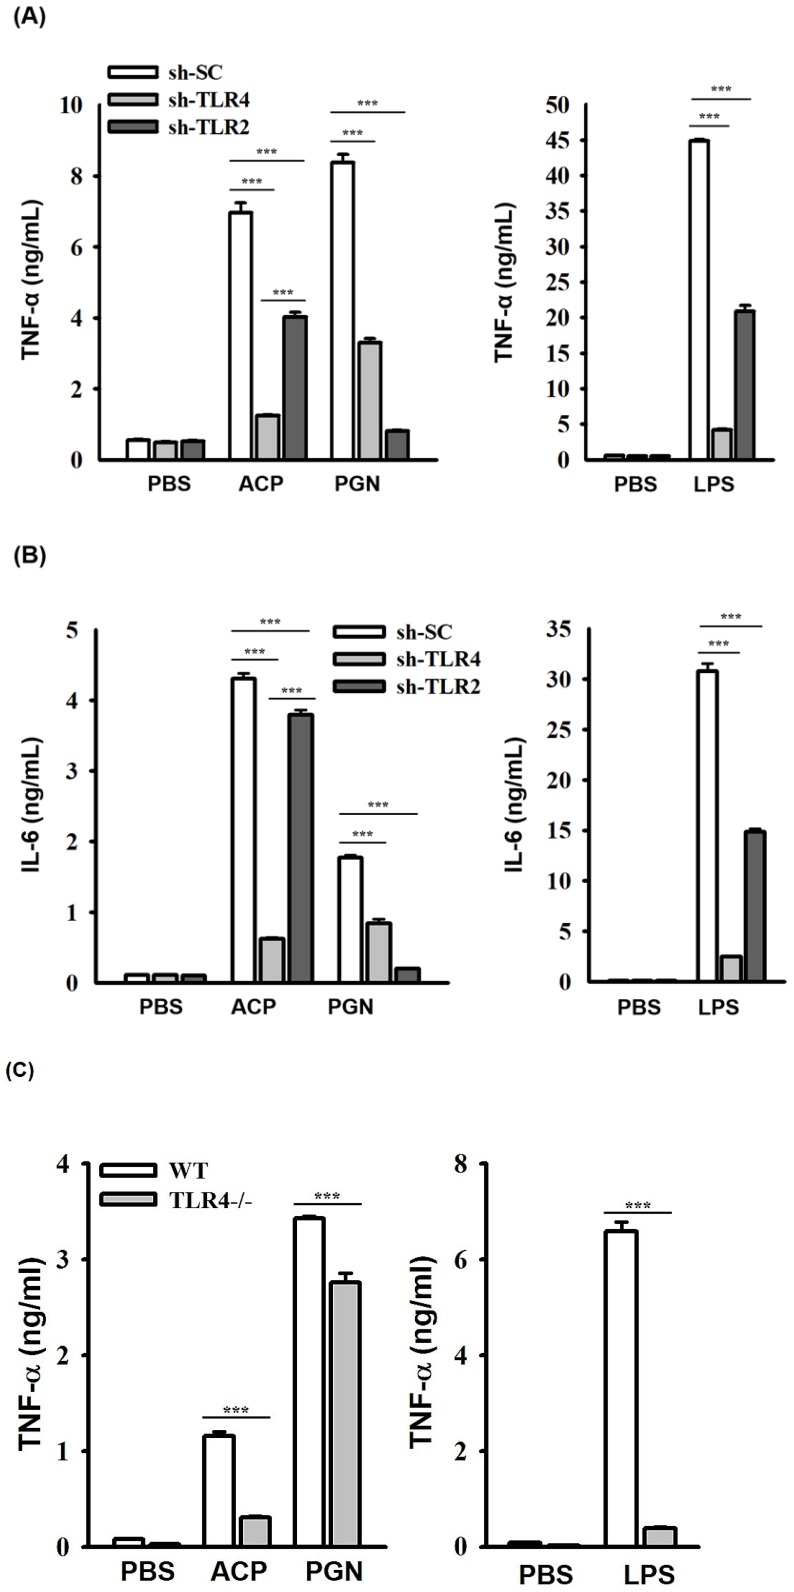
Figure 3
ACP induces cytokine expression through…Figure 3
ACP induces cytokine expression through TLR4. ( A, B ) J774A.1 macrophages stably… Figure 3 ACP induces cytokine expression through TLR4. (A, B) J774A.1 macrophages stably transfected with a control shRNA plasmid (sh-SC), a TLR4 shRNA plasmid (sh-TLR4), and a TLR2 shRNA plasmid (sh-TLR2) were incubated for 24 h with or without ACP (100 µg/mL), PGN (10 µg/mL) or LPS (1 µg/mL). The levels of TNF-α (A) and IL-6 (B) in the culture medium were measured by ELISA. (C, D) Mouse peritoneal macrophages isolated from wild-type (WT) and TLR4 knockout (TLR4-/-) mice were incubated for 24 h with or without ACP (100 µg/mL), PGN (10 µg/mL) or LPS (1 µg/mL). The levels of TNF-α (C) and IL-6 (D) in the culture medium were measured by ELISA. (E) J774A.1 macrophages were incubated for 30 min with or without ACP (100 µg/mL) and then for 24 h with or without LPS (1 µg/mL). The levels of TNF-α in the culture medium were measured by ELISA. The data are expressed as the means ± SD of three separate experiments. *** indicates a significant difference at the level of p< 0.001.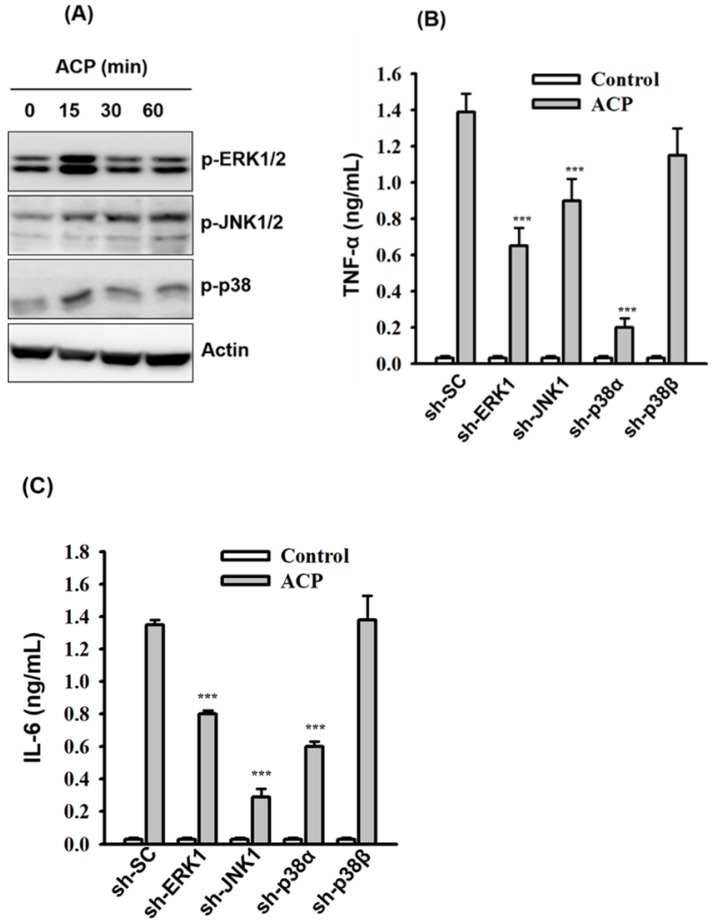
Figure 4
ACP induces cytokine expression through…Figure 4
ACP induces cytokine expression through MAPK. ( A ) J774A.1 macrophages were incubated… Figure 4 ACP induces cytokine expression through MAPK. (A) J774A.1 macrophages were incubated for 0-60 min with or without ACP (100 µg/mL). The phosphorylation levels of ERK1/2, JNK1/2 and p38 were assayed by Western blot. (B, C) J774A.1 macrophages stably transfected with a control shRNA plasmid (sh-SC), a ERK1 shRNA plasmid (sh-ERK1), a JNK1 shRNA plasmid (sh-TLR2), a p38α shRNA plasmid (sh-p38α), and a p38β shRNA plasmid (sh-p38β) were incubated for 24 h with or without ACP (100 μg/mL). The levels of TNF-α (B) and IL-6 (C) in the culture medium were measured by ELISA. The Western blot results are representative of those obtained in three different experiments. The ELISA data are expressed as the means ± SD of three separate experiments. *** indicates a significant difference at the level of p< 0.001.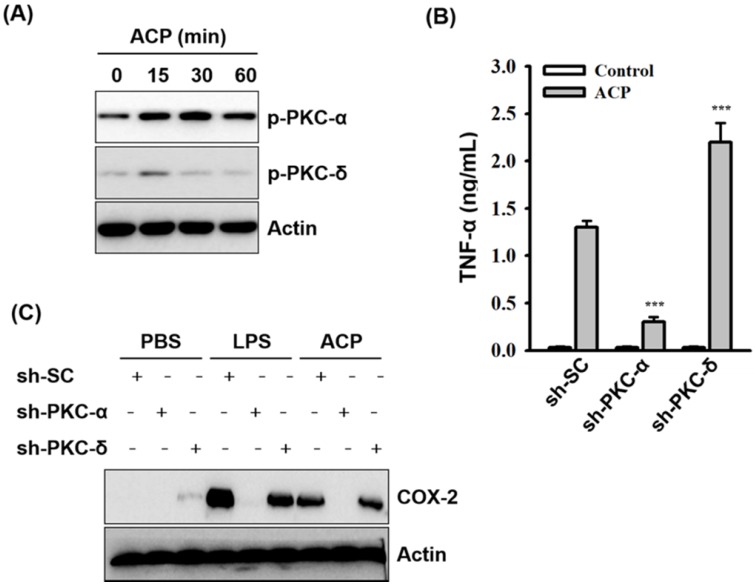
Figure 5
ACP induces cytokine expression through…Figure 5
ACP induces cytokine expression through PKC-α. ( A ) J774A.1 macrophages were incubated… Figure 5 ACP induces cytokine expression through PKC-α. (A) J774A.1 macrophages were incubated for 0-60 min with or without ACP (100 µg/mL). The phosphorylation levels of PKC-α and PKC-δ were assayed by Western blot. (B) J774A.1 macrophages stably transfected with a control shRNA plasmid (sh-SC), a PKC-α shRNA plasmid (sh-PKC-α), and a PKC-δ shRNA plasmid (sh-PKC-δ) were incubated for 24 h with or without ACP (100 μg/mL). The levels of TNF-α in the culture medium were measured by ELISA. (C) sh-SC, sh-PKC- α, and sh-PKC-δ cells were incubated for 24 h with or without ACP (100 μg/mL) or LPS (1 μg/mL). The expression levels of COX-2 were assayed by Western blot. The Western blot results are representative of those obtained in three different experiments. The ELISA data are expressed as the means ± SD of three separate experiments. *** indicates a significant difference at the level of p< 0.001 compared to ACP-treated sh-SC cells.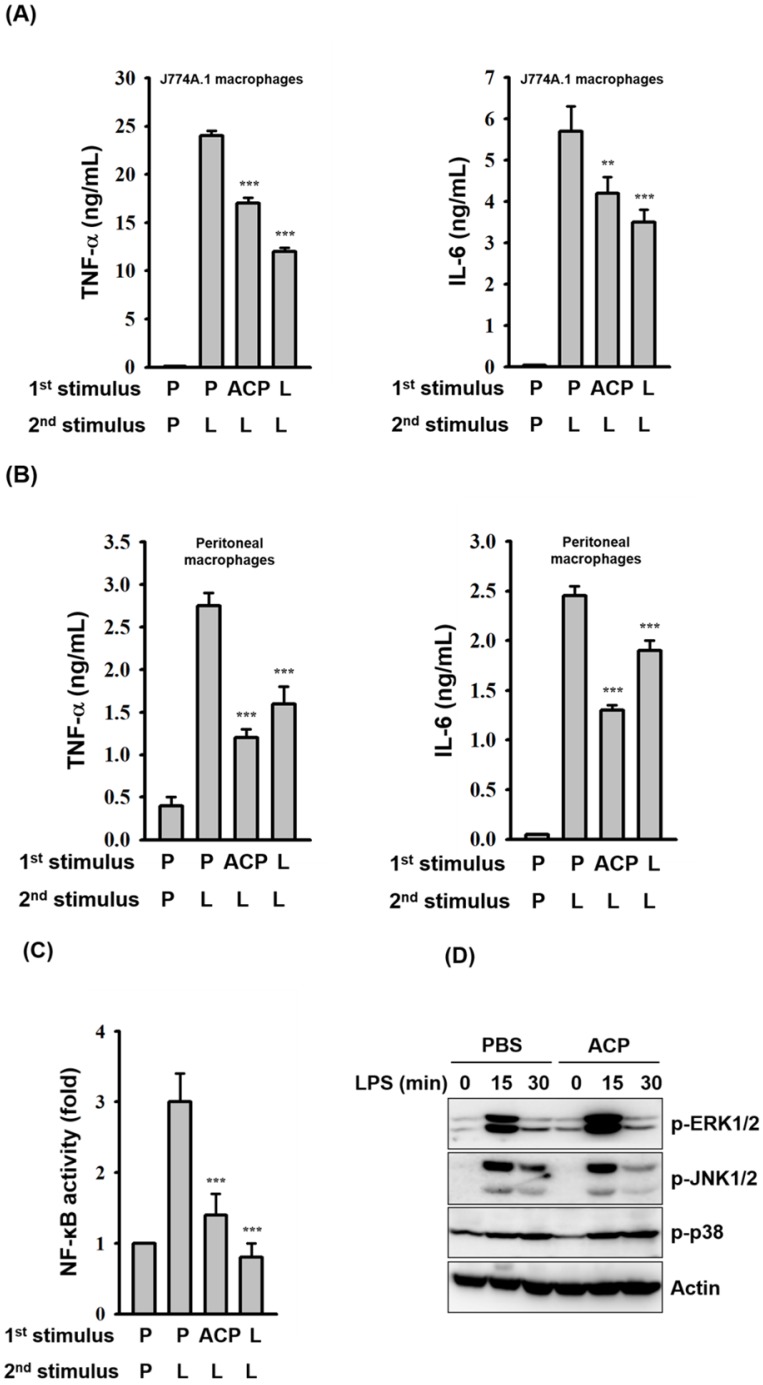
Figure 6
ACP pretreatment induces LPS tolerance.…Figure 6
ACP pretreatment induces LPS tolerance. ( A, B ) J774A.1 macrophages ( A… Figure 6 ACP pretreatment induces LPS tolerance. (A, B) J774A.1 macrophages (A) and mouse peritoneal macrophages (B) were incubated for 24 h with or without ACP (100 μg/mL) or LPS (0.1 μg/mL)(1st stimulus). After washing, cell cultures were changed for fresh medium and then were incubated for 24 h with or without LPS (1 μg/mL)(2nd stimulus). The levels of TNF-α and IL-6 in the culture medium were measured by ELISA. (C) J-Blue cells were incubated for 24 h with or without ACP (100 μg/mL) or LPS (0.1 μg/mL)(1st stimulus). After washing, cell cultures were changed for fresh medium and then were incubated for 24 h with or without LPS (1 μg/mL)(2nd stimulus). The activation levels of NF-κB were measured by an NF-κB reporter assay. (D) J774A.1 macrophages were incubated for 24 h with or without ACP (100 μg/mL). After washing, cell cultures were changed for fresh medium and then were incubated for 0-30 min with or without LPS (1 µg/mL). The phosphorylation levels of ERK1/2, JNK1/2 and p38 were assayed by Western blot. The Western blot results are representative of those obtained in three different experiments. The data are expressed as the means ± SD of three separate experiments. *** indicates a significant difference at the level of p< 0.001, compared to 1st P/2nd L group. P: PBS; L: LPS.