Antrodia cinnamomea Confers Obesity Resistance and Restores Intestinal Barrier Integrity in Leptin-deficient Obese Mice
Abstract
Obesity is associated with metabolic disorders. Thus, obesity prevention and treatment are essential for health. Antrodia cinnamomea (AC) is a multifunctional medicinal fungus used for the treatment of various diseases and for preventing diet-induced obesity. Leptin deficiency causes over-eating and spontaneous obesity. The concomitant metabolic symptoms are more severe than diet-induced obesity. Here, we used leptin-deficient (ob/ob) mice as an animal model for over-feeding to study the effect of AC on obesity. We fed C57BL/6 mice (WT, ob+/+) and ob/ob mice with AC for four weeks before performing qRT-PCR and immunoblot analysis to elaborate AC-modulated mechanisms. Further, we used Caco-2 cells as a human intestinal epithelial barrier model to examine the effect of AC on intestinal permeability. Our results suggested that AC reduces lipid deposits of the liver and epididymal white adipose tissue (EWAT) by promoting lipid metabolism and inhibiting lipogenesis-associated genes and proteins in ob/ob mice. Moreover, AC effectively repaired intestinal-barrier injury caused by leptin deficiency and enhanced intestinal barrier integrity in Caco-2 cells. Interestingly, AC significantly reduced body weight and EWAT with no compromise on food intake in ob/ob mice. Thus, AC effectively reduced obesity caused by leptin-deficiency and can potentially be used as a nutraceutical for treating obesity.
Figures 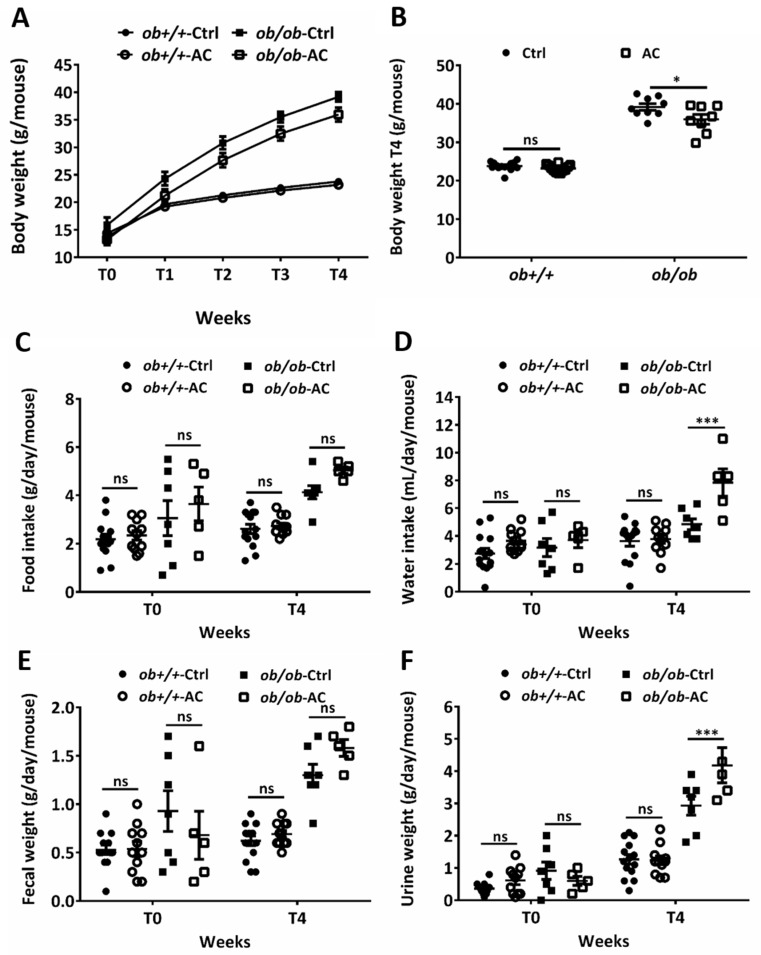
Figure 1
AC reduces body weight in…
Figure 1
AC reduces body weight in ob/ob mice. ( A ) Body weights of…
Figure 1 AC reduces body weight in ob/ob mice. (A) Body weights of 4–5 week-old ob+/+ and ob/ob fed a diet with or without AC were measured every week for 4 weeks. (B) Body weights of ob+/+ and ob/ob fed with or without AC were measured after 4 weeks (T4). (C–F) Daily food or water intake and fecal or urine weights were monitored using a metabolic cage at T0 and T4. All data are expressed as mean ± SEM, * p < 0.05, ** p < 0.01, *** p < 0.001. Non-significant; ns. n = 5–14 mice in each group.
Figure 2
AC may suppress lipid accumulation…
Figure 2
AC may suppress lipid accumulation and deposition in the liver and EWAT in…
Figure 2 AC may suppress lipid accumulation and deposition in the liver and EWAT in ob/ob mice. (A,B) Percentage of liver or epididymal white adipose tissue (EWAT) weight were normalized to body weight after ob+/+ and ob/ob mice were fed with or without AC for 4 weeks. (C,E) The liver and EWAT were examined using hematoxylin and eosin staining. (D,F) The number of liver or EWAT cells per field was estimated using the ImageJ software. Magnification, 100×. Scale bars are 20 μm for the liver and 50 μm for EWAT. All data are expressed as mean ± SEM, * p < 0.05, ** p < 0.01, *** p < 0.001. Non-significant; ns. n = 4–14 mice in each group.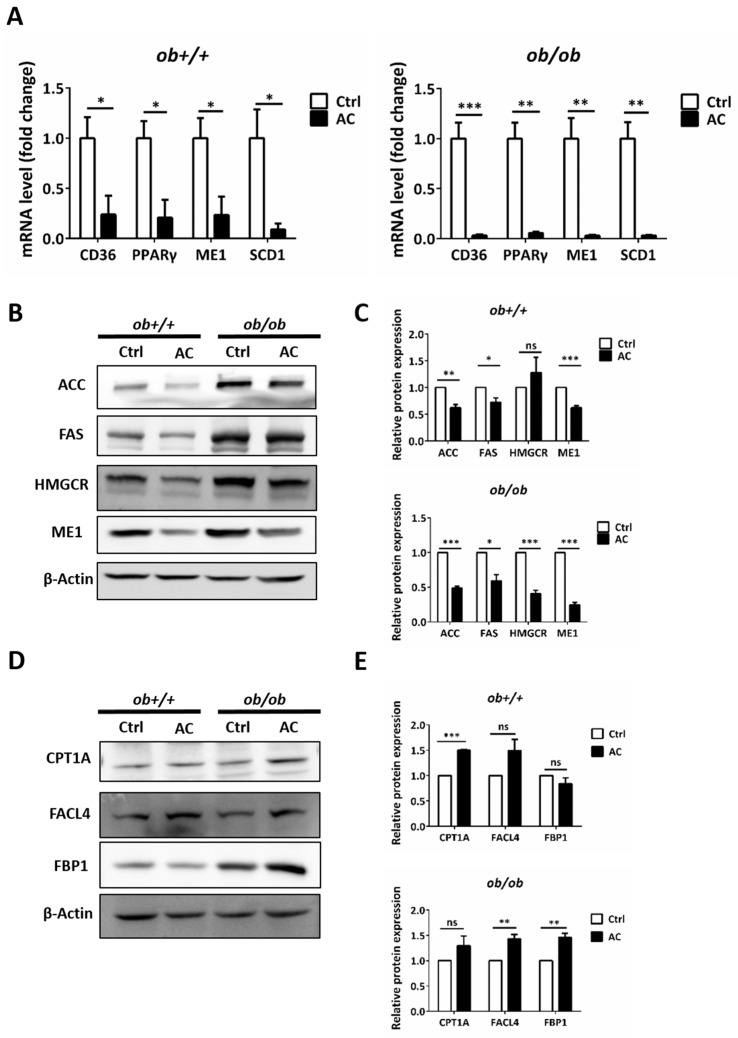
Figure 3
AC reduces hepatic lipogenesis and…
Figure 3
AC reduces hepatic lipogenesis and increases gluconeogenesis by regulating related-genes or protein in…
Figure 3 AC reduces hepatic lipogenesis and increases gluconeogenesis by regulating related-genes or protein in ob+/+ and ob/ob mice. (A) The relative mRNA expression of CD36, PPARγ, ME1, and SCD1 were compared between ob+/+Ctrl or ob/ob-Ctrl mice. (B,D) Immunoblot analysis of proteins involved in lipogenesis, β-oxidation, and gluconeogenesis. (C,E) Quantification of protein expression and comparison between ob+/+-Ctrl and ob/ob-Ctrl mice. All data are expressed as mean ± SEM, * p < 0.05, ** p < 0.01, *** p < 0.001. Non-significant; ns. n = 4–8 mice in each group. All experiments were repeated thrice.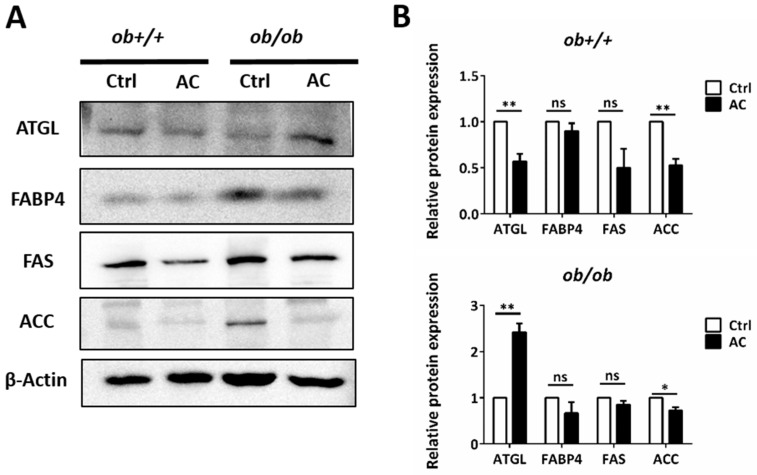
Figure 4
AC promotes expression of a…
Figure 4
AC promotes expression of a lipolysis-associated protein in the EWAT of ob+/+ and…
Figure 4 AC promotes expression of a lipolysis-associated protein in the EWAT of ob+/+ and ob/ob mice. (A) Immunoblot analysis of lipolysis pathway protein. (B) Quantification and comparison of protein expression in ob+/+-Ctrl or ob/ob-Ctrl mice. All data are expressed as mean ± SEM, * p < 0.05, ** p < 0.01, *** p < 0.001. Non-significant; ns. n = 4–8 mice in each group. All experiments were repeated thrice.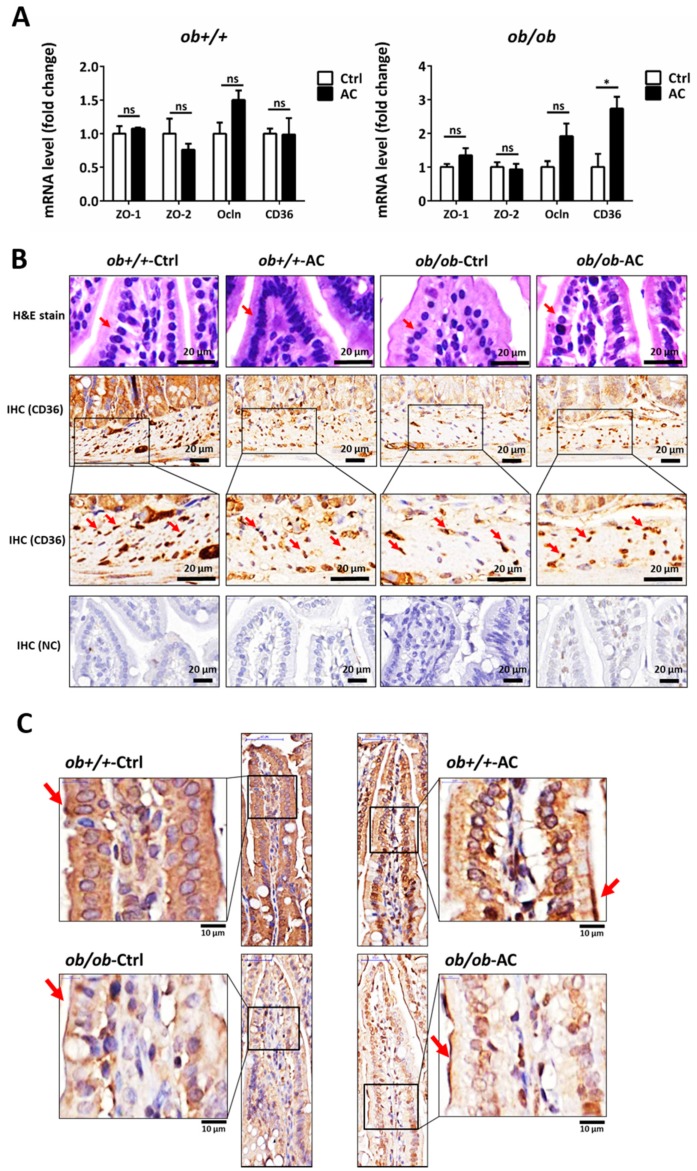
Figure 5
The intestinal barrier is maintained…
Figure 5
The intestinal barrier is maintained by AC in ob/ob mice. ( A )…
Figure 5 The intestinal barrier is maintained by AC in ob/ob mice. (A) Relative mRNA expression of tight junction proteins and CD36 between ob+/+-Ctrl and ob/ob-Ctrl mice; (B) The intestine was examined using hematoxylin and eosin staining and immunohistochemical staining of CD36. Magnification, 40×. Scale bars are 20 μm. The negative control for immunohistochemistry has been marked NC; (C) The intestine was examined using immunohistochemical staining for ZO-1. Magnification, 40× and 100×; scale bars are 50 μm and 10 μm, respectively. All data are expressed as mean ± SEM, * p < 0.05, ** p < 0.01, *** p < 0.001. Non-significant; ns. n = 4–8 mice in each group.
Figure 6
EEAC decreases intestinal permeability in…
Figure 6
EEAC decreases intestinal permeability in the Caco-2 cell barrier model. ( A )…
Figure 6 EEAC decreases intestinal permeability in the Caco-2 cell barrier model. (A) Cell viability assay of Caco-2 cells treated with 0-3000 μL/mL EEAC. (B) Effect of EEAC on intestinal permeability was measured using the trans-epithelial electrical resistance (TEER) assay. (C) Relative mRNA expression of tight junction proteins and PPARγ were compared using controls (Ctrl). (D) Immunofluorescence staining of ZO-1 (green) of Caco-2 cells treated with or without EEAC. Nuclei were stained with DAPI (blue). The negative control is marked as NC. Scale bars, 20 μm. All data are expressed as mean ± SEM, * p < 0.05, ** p < 0.01, *** p < 0.001. Non-significant; ns. All experiments were repeated thrice (n = 3).