Antrodia cinnamomea boosts the anti-tumor activity of sorafenib in xenograft models of human hepatocellular carcinoma
Figures
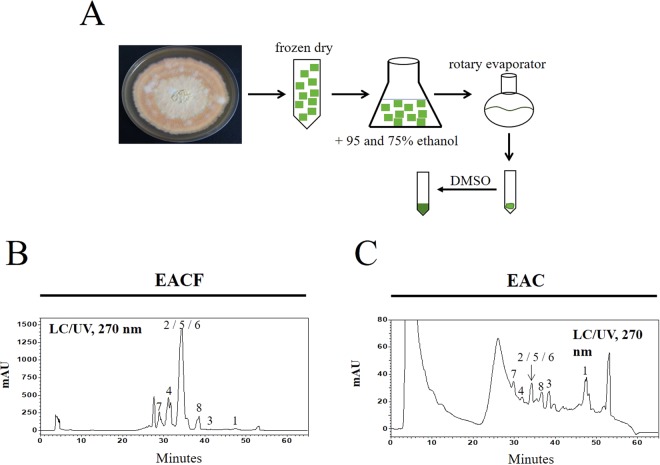
Figure 1
The preparation and identification of…
Figure 1
The preparation and identification of the major triterpenoids in A . cinnamomea extract.…
Figure 1 The preparation and identification of the major triterpenoids in A. cinnamomea extract. (A) A flowchart showing the extraction protocol of A. cinnamomea cultivated on agar plates. The dried agar plates were extracted with ethanol and concentrated by a rotary evaporator. (B, C) The dried extracts of EACF or EAC were dissolved in DMSO, and 10 mg/ml of total extracts were analyzed by HPLC/LC/MS.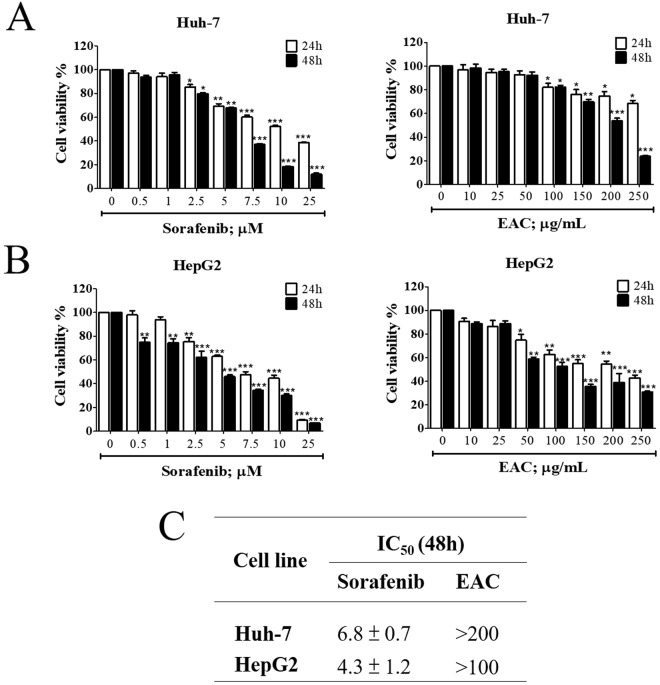
Figure 2
Antiproliferative effects of sorafenib and…
Figure 2
Antiproliferative effects of sorafenib and EAC in HCC cell lines. ( A )…
Figure 2 Antiproliferative effects of sorafenib and EAC in HCC cell lines. (A) Huh-7 cells and (B) HepG2 cells were exposed to sorafenib and EAC at the indicated concentrations in 10% FBS-Supplemented DMEM for 24 and 48 h, and cell viability was assessed by MTT assays. Columns, mean; bars, SD (n = 6). *P < 0.05; **P < 0.01; ***P < 0.001. (C) The IC50 values of sorafenib and EAC in two HCC cell lines after treatment for 48 h and cell viability was measured by MTT assay.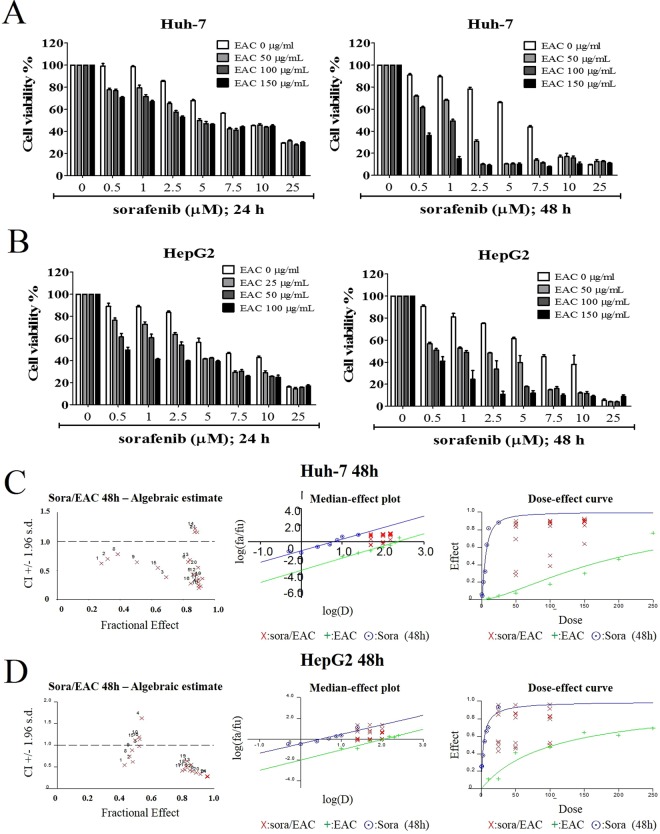
Figure 3
The synergistic combination between sorafenib…
Figure 3
The synergistic combination between sorafenib and EAC on cancer cell viability. ( A…
Figure 3 The synergistic combination between sorafenib and EAC on cancer cell viability. (A) Huh7 and (B) HepG2 cell lines were treated with sorafenib in the presence or absence of EAC at the indicated concentrations in 10% FBS-DMEM for 24 or 48 h, and cell viability was determined by MTT assays. Columns, mean; bars, SD (n = 6). (C,D) Sorafenib/EAC combination algebraic estimate, median effect plot and dose-effect curves calculated by Calcusyn software in the treated Huh7 and HepG2 cells.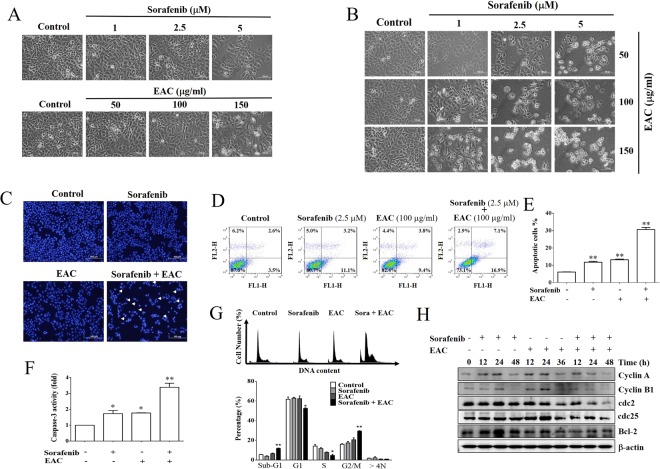
Figure 4
EAC sensitizes HCC cells to…
Figure 4
EAC sensitizes HCC cells to sorafenib-induced apoptosis in HCC cells. ( A ,…
Figure 4 EAC sensitizes HCC cells to sorafenib-induced apoptosis in HCC cells. (A, B) Phase-contrast images showing the morphological changes of Huh-7 cells treated with sorafenib alone or in combination with EAC for 48 h. (C) Nuclear morphological changes of Huh-7 cells under a fluorescence microscope. The cells were treated for 48 h then stained with DAPI. (D) Annexin V-FITC/PI double staining analysis of apoptosis in Huh-7 cells treated with sorafenib (2.5 µM) and/or EAC (100 µM) for 48 h assessed by flow cytometry. (E) Results of Annexin V-FITC/PI double staining analysis. Columns, mean; bars, SD (n = 4). (F) Flow cytometry histograms of caspase-3 activity in Huh-7 cells treated with sorafenib (2.5 µM) and/or EAC (100 µM) for 48 h. Columns, mean; bars, SD (n = 4). (G) Cell cycle distribution using PI staining and flow cytometry of Huh-7 cells treated with sorafenib (2.5 µM) and/or EAC (100 µM) for 48 h. Columns, mean; bars, SD (n = 4). (H) Western blot analysis of Huh-7 cells lysate after the indicated treatments. *P < 0.05; **P < 0.01.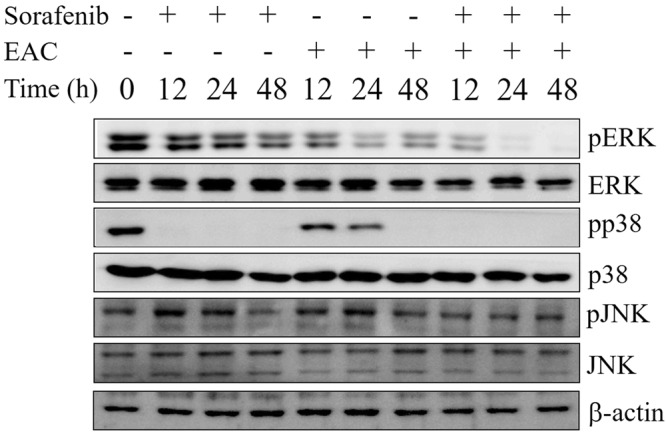
Figure 5
The effect of sorafenib/EAC combination…
Figure 5
The effect of sorafenib/EAC combination on MAPKs. Western blots of Huh-7 cells treated…
Figure 5 The effect of sorafenib/EAC combination on MAPKs. Western blots of Huh-7 cells treated with 2.5 µM sorafenib and/or 100 µg/ml EAC for 48 h. The total cell lysates were analyzed by Western blotting with antibodies against ERK, p-ERK, JNK, pJNK, p38, p-p38, and β-actin.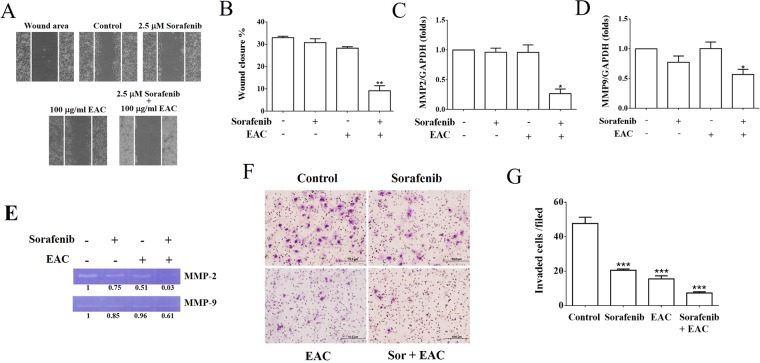
Figure 6
The inhibition of cancer cell…
Figure 6
The inhibition of cancer cell migration and MMP expression by sorafenib/EAC combination. (…
Figure 6 The inhibition of cancer cell migration and MMP expression by sorafenib/EAC combination. (A) Wound healing assay for Huh-7 cells exposed to 2.5 µM sorafenib and/or 100 µg/ml EAC for 48 h. The wounded region was observed by Olympus CK-2 inverted microscope (100× magnification). (B) The results of wound healing assay. Columns, mean; bars, SD (n = 4). (C, D) MMP-2 and MMP-9 expression in Huh-7 cells treated with 2.5 µM sorafenib and/or 100 µg/ml EAC for 48 h using Real-time PCR. Columns, mean; bars, SD (n = 4). (E) Zymography assay of Huh-7 cells treated with 2.5 µM sorafenib and/or 100 µg/ml EAC for 16 h in serum-free medium. The activity of MMP-2 and MMP-9 was determined by zymography assay with gelatin-containing SDS-PAGE. (F) Effect of sorafenib with or without EAC on Huh-7 cell invasion. Cells were treated with sorafenib and EAC at the indicated concentrations, and the invaded cells were photographed (200× magnification). (G) The invaded cells were counted in five random fields for each treatment. Data are presented as mean ± S.D (n = 5) of three independent experiments. *P < 0.05; **P < 0.01; ***P < 0.001 compared with the untreated control.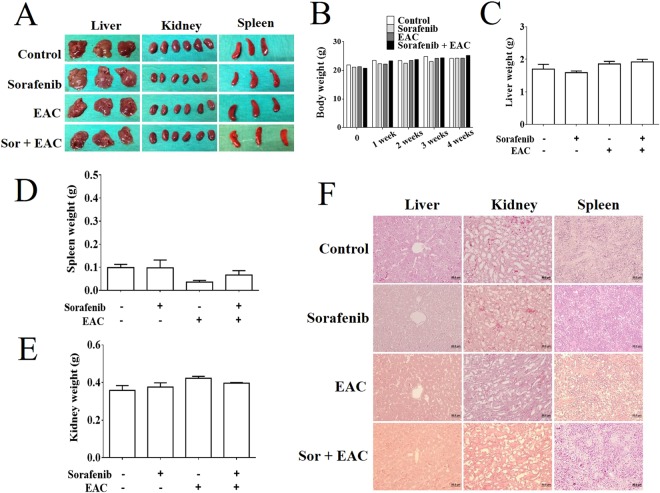
Figure 7
Assessment of sorafenib/EAC combination safety…
Figure 7
Assessment of sorafenib/EAC combination safety in mice. ( A ) The photographs of…
Figure 7 Assessment of sorafenib/EAC combination safety in mice. (A) The photographs of the livers, kidneys, and spleens of BALB/c mice treated with 2.5 mg/kg sorafenib and/or 100 mg/kg EAC (i.p.) every other day for 4 weeks. (B–E) The body, liver, spleen, and kidney weight changes through the treatment. Columns, mean; bars, SD (n = 3). (F) Representative images of the histopathological (H&E staining) analysis of liver, kidney, and spleen tissue sections (200× magnification) of the treated mice.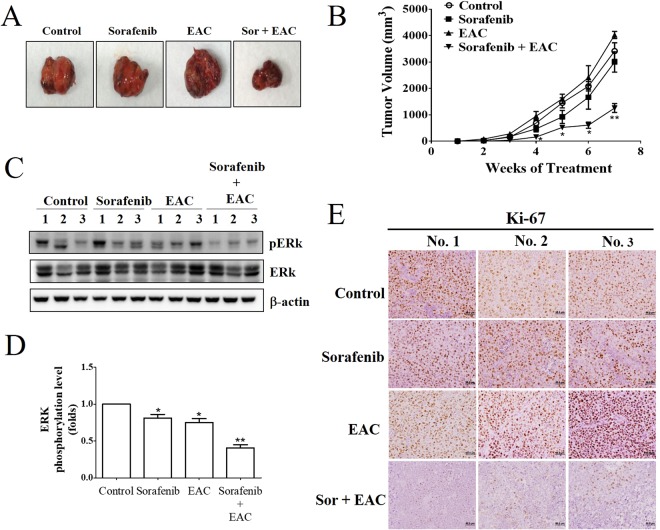
Figure 8
In vivo efficacy of sorafenib/EAC…Figure 8
In vivo efficacy of sorafenib/EAC combination in an ectopic xenograft model of HCC.… Figure 8 In vivo efficacy of sorafenib/EAC combination in an ectopic xenograft model of HCC. (A) Representative images showing Huh-7 xenograft tumors excised from NOD-SCID mice after the treatment with 2.5 mg/kg sorafenib and/or 100 mg/kg EAC (i.p.) every other day for 7 weeks. (B) Tumor volume changes over the 7 weeks of treatment. Points, mean; bars, SD. *P < 0.05; **P < 0.01. (C) Western blot analysis of ERK and p-ERK showing the drug activity in the homogenates of 3 representative subcutaneous Huh-7 tumors from each treatment group. (D) The phosphorylation levels of ERK in the tumor tissues. The Western blot images were quantified by using Image J software. Columns, mean; bars, SD (n = 3). *P < 0.05; **P < 0.01. (E) Immunohistochemistry images of Ki67 staining in representative xenograft tumors (200× magnification). All figures (8)