Antrodia camphorata Supplementation during Early Life Alters Gut Microbiota and Inhibits Young-Onset Intestinal Tumorigenesis in APC1638N Mice Later in Life
Abstract
Young-onset colorectal cancer is an increasing concern worldwide due to the growing prevalence of Westernized lifestyles in childhood and adolescence. Environmental factors during early life, particularly early-life nutrition, significantly contribute to the increasing incidence. Recently, there have been reports of beneficial effects, including anti-inflammation and anti-cancer, of a unique fungus (Antrodia camphorate, AC) native to Taiwan. The objective of this study is to investigate the impact of AC supplementation in early life on the development of young-onset intestinal tumorigenesis. APC1638N mice were fed with a high-fat diet (HF) at 4-12 weeks of age, which is equivalent to human childhood/adolescence, before switching to a normal maintenance diet for an additional 12 weeks up to 24 weeks of age, which is equivalent to young to middle adulthood in humans. Our results showed that the body weight in the HF groups significantly increased after 8 weeks of feeding (p < 0.05). Following a switch to a normal maintenance diet, the change in body weight persisted. AC supplementation significantly suppressed tumor incidence and multiplicity in females (p < 0.05) and reduced IGF-1 and Wnt/β-catenin signaling (p < 0.05). Moreover, it altered the gut microbiota, suppressed inflammatory responses, and created a microenvironment towards suppressing tumorigenesis later in life.
Figures 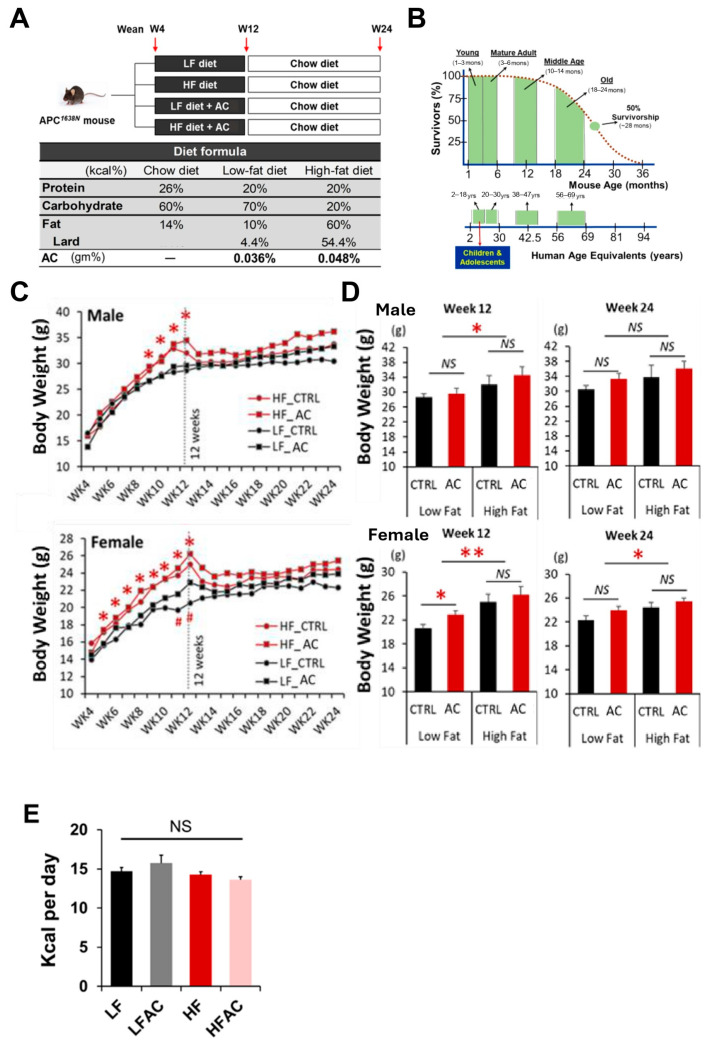
Figure 1
Experimental design and mouse body…
Figure 1
Experimental design and mouse body weight changes during the feeding period. ( A…
Figure 1 Experimental design and mouse body weight changes during the feeding period. (A) Experimental design. The APC1638N model was used to study intestinal tumorigenesis. Mice were randomly divided into low-fat diet (LF) with and without AC supplementation and high-fat diet (HF) with and without AC supplementation groups during weeks 4 to 12, and then all groups switched back to a normal maintenance diet for another 12 weeks. (B) Mouse and human life phase equivalencies. The experimental diet feeding period is equivalent to childhood and adolescence in humans. (C) Growth curves for 20-week feeding experiments in male and female mice. (D) Body weight comparisons among the LF group with and without AC supplementation and HF group with and without AC supplementation on weeks 12 and 24. (E) Feed intake comparisons among the LF group with and without AC supplementation and the HF group with and without AC supplementation groups during the initial 8-week period. Data are presented as mean ± SEM, n = 10–13 for each group. #p < 0.1, * p < 0.05, ** p < 0.01. APC: adenomatous polyposis coli. AC: Antrodia camphorata supplementation (powder). NS: not statistical significance.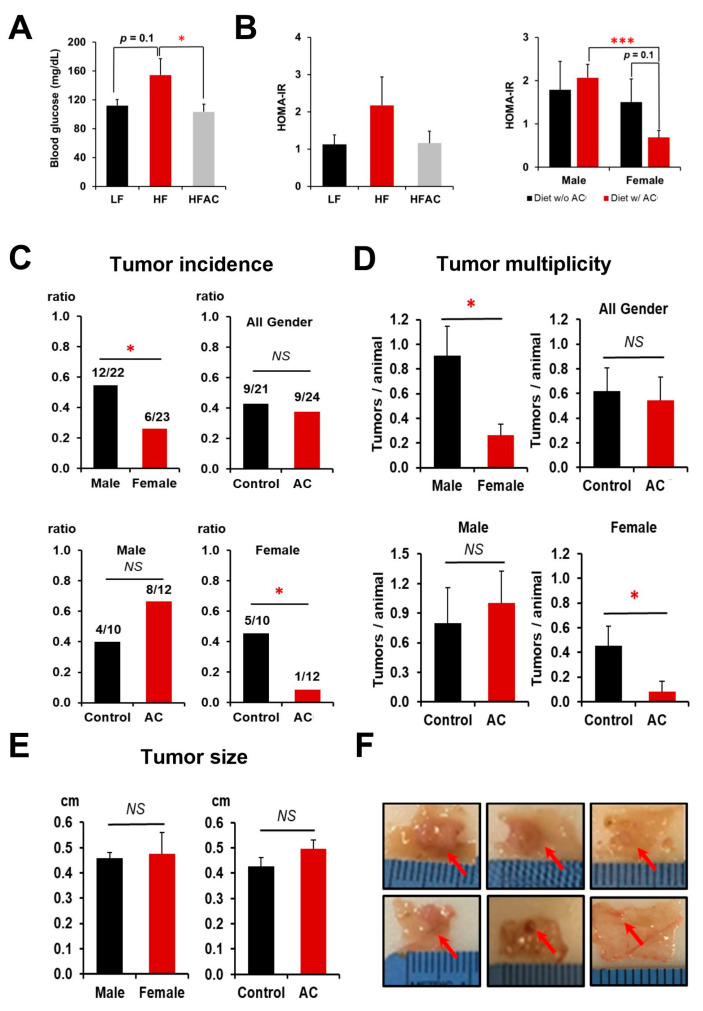
Figure 2
The influence of a high-fat…
Figure 2
The influence of a high-fat diet and AC supplementation in early life on…
Figure 2 The influence of a high-fat diet and AC supplementation in early life on blood glucose homeostasis and intestinal tumorigenesis in APC1638N mice. (A) The effects of an early-life high-fat diet (HF) with and without AC supplementation on blood glucose changes. (B) The effects of an early-life HF diet with and without AC supplementation on insulin resistance and the effects of AC supplementation on insulin resistance in male and female mice. (C) Tumor incidence in male and female mice and the differentiated impacts of AC supplementation in males and females. (D) Tumor multiplicity in male and female mice and the differentiated impacts of AC supplementation in males and females. Tumor multiplicity was calculated based on the number of tumors divided by the number of mice in each group. (E) Tumor size between male and female mice and the impact of AC supplementation on tumor size. (F) Representative pictures of intestinal tumors. Representative tumor pictures from a mouse fed without AC supplementation (top) and representative tumor pictures from a mouse fed with AC supplementation (bottom). Red arrows indicate the tumors. Control and AC in figure (C–E) meant experimental diets without and with AC supplementation, regardless of whether fed a LF or HF diet. Data are presented as mean ± SEM. * p < 0.05. *** p < 0.001. NS: not statistical significance. w/: with. w/o: without.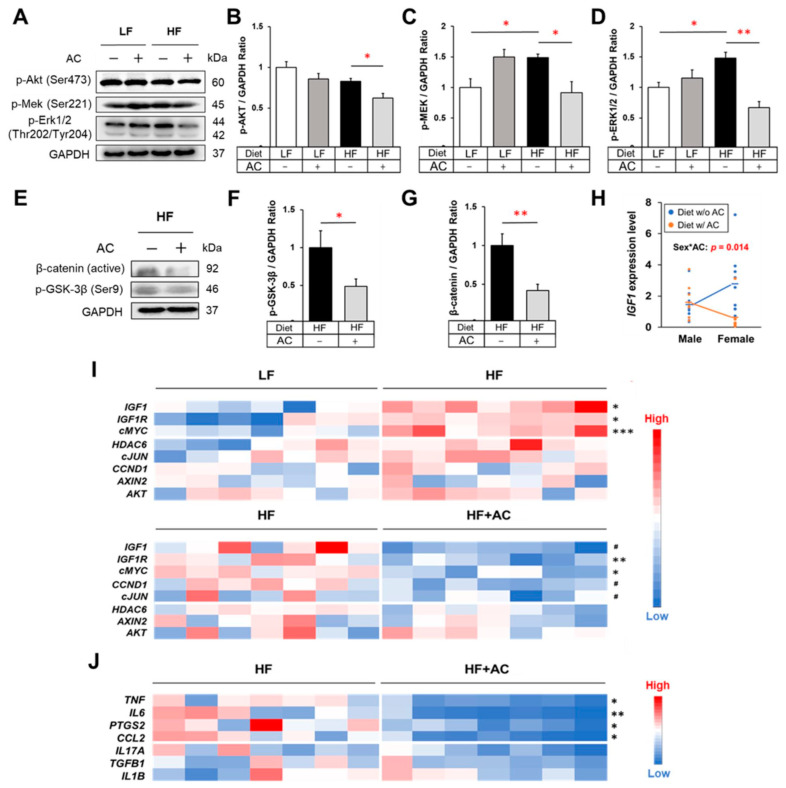
Figure 3
The influence of high-fat diet…
Figure 3
The influence of high-fat diet and AC supplementation in early life on IGF-1/MAPK…
Figure 3 The influence of high-fat diet and AC supplementation in early life on IGF-1/MAPK signaling, Wnt/β-catenin signaling, and inflammatory cytokines in APC1638N mice. (A) Western blots for phospho-Akt, phospho-Mek, and phospho-Erk in the intestine. (B–D) The effects of early-life high-fat diet (HF) and AC supplementation on protein expression of phospho-Akt, phospho-Mek, and phospho-Erk in the intestine. (E) Western blots for phospho-GSK-3β and active β-catenin in the intestine. (F,G) The effects of AC supplementation in early life on protein expression of phospho-GSK-3β and β-catenin in the intestine of mice fed with an early-life HF diet. (H) Test of the interaction between sex and AC supplementation on Igf1 gene expression. (I) Gene expression heatmaps of IGF-1/MAPK signaling and Wnt/β-catenin signaling-related genes in the small intestine. (J) Gene expression heatmap for inflammatory mediators in the small intestine. Data are presented as mean ± SEM, n = 8–11 for each group. #p < 0.1, * p < 0.05, ** p < 0.01, *** p < 0.001. w/: with. w/o: without. Original blots are presented in Supplementary Figures S2–S6.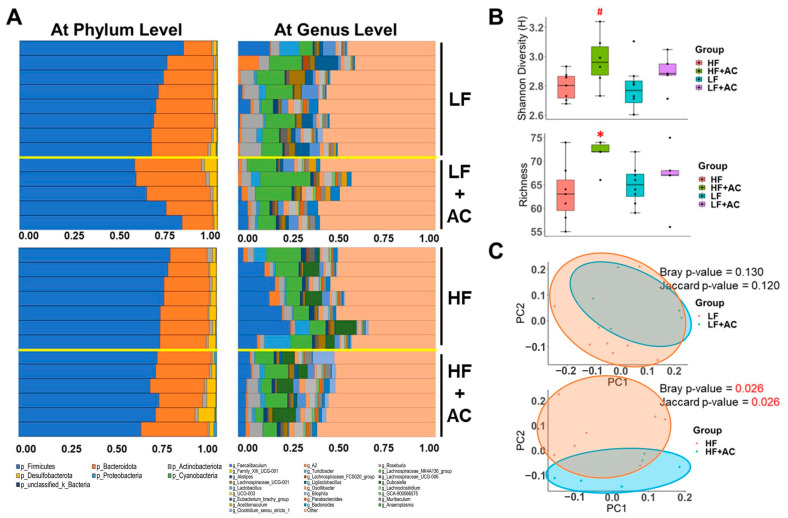
Figure 4
The influence of a high-fat…
Figure 4
The influence of a high-fat diet and AC supplementation in early life on…
Figure 4 The influence of a high-fat diet and AC supplementation in early life on cecal microbial composition in APC1638N mice. (A) Bar plots of relative abundance of microbiota at phylum level and at genus level for the comparisons between low-fat diet (LF) with and without AC supplementation and high-fat diet (HF) with and without AC supplementation. (B) Shannon and Richness metrics were used to determine α-diversity. (C) Principal Coordinates Analysis (PCoA) plot illustrates β-diversity. Red text indicates a significant difference. Permutational multivariate analysis of variance (PERMANOVA) in Jaccard and Bray–Curtis metrics indicates the statistically significant differences between an early-life HF diet with and without AC supplementation. N = 5–8 for each group. #p < 0.1, * p < 0.05.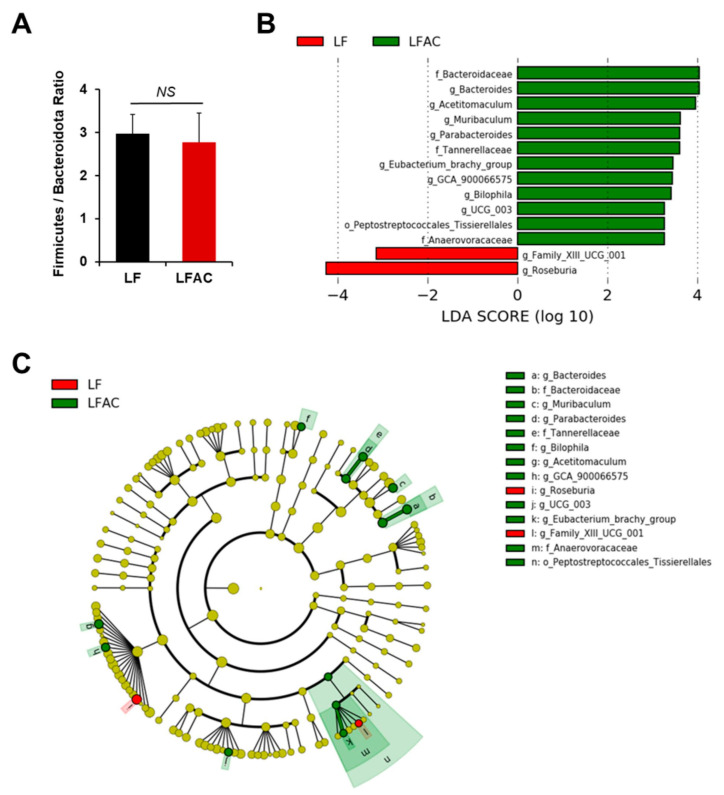
Figure 5
The influence of AC supplementation…
Figure 5
The influence of AC supplementation in early life on cecal microbial composition in…
Figure 5 The influence of AC supplementation in early life on cecal microbial composition in APC1638N mice fed with a low-fat diet. (A) Firmicutes/Bacteroidota ratio; (B) Linear discriminant analysis (LDA) effect size (LEfSe) for mice fed with a low-fat diet (LF) with and without AC supplementation shows differential microbiota at each taxon level. The threshold on the LDA score for discriminative features was set to 2.0. The abundance of the listed taxon of bacteria was significantly different (p < 0.05) between groups. Green bars indicate a higher abundance of taxa in the LF group with AC supplementation, and red bars indicate a higher abundance of taxa in the LF group without AC supplementation. (C) Cladogram of the LEfSe analysis between groups. The microbial composition was compared at different taxon levels. The taxon level is abbreviated as p-phylum, c-class, o-order, f-family, and g-genus. NS: not statistical significance.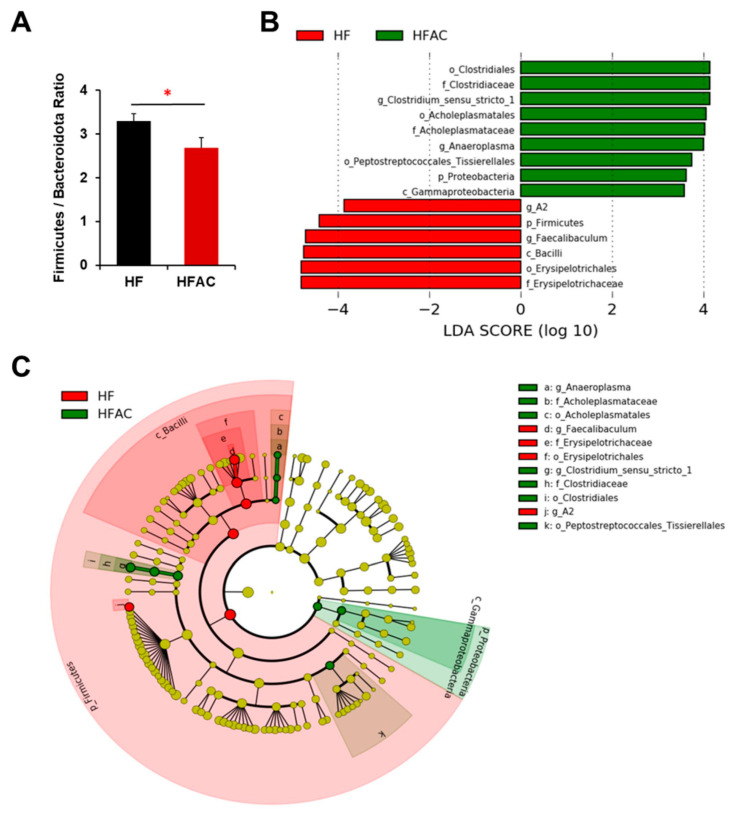
Figure 6
The influence of AC supplementation…
Figure 6
The influence of AC supplementation in early life on cecal microbial composition in…
Figure 6 The influence of AC supplementation in early life on cecal microbial composition in APC1638N mice fed with an early-life high-fat diet. (A) Firmicutes/Bacteroidota ratio (B) Linear discriminant analysis (LDA) effect size (LEfSe) for mice fed with a high-fat diet (HF) with and without AC supplementation shows differential microbiota at each taxon level. The threshold on the LDA score for discriminative features was set to 2.0. The abundance of the listed taxon of bacteria was significantly different (p < 0.05) between groups. Green bars indicate a higher abundance of taxa in HF group with AC supplementation, and red bars indicate a higher abundance of taxa in HF group without AC supplementation. (C) Cladogram of the LEfSe analysis between groups. The microbial composition was compared at different taxon levels. The taxon level is abbreviated as p-phylum, c-class, o-order, f-family, and g-genus. * p < 0.05.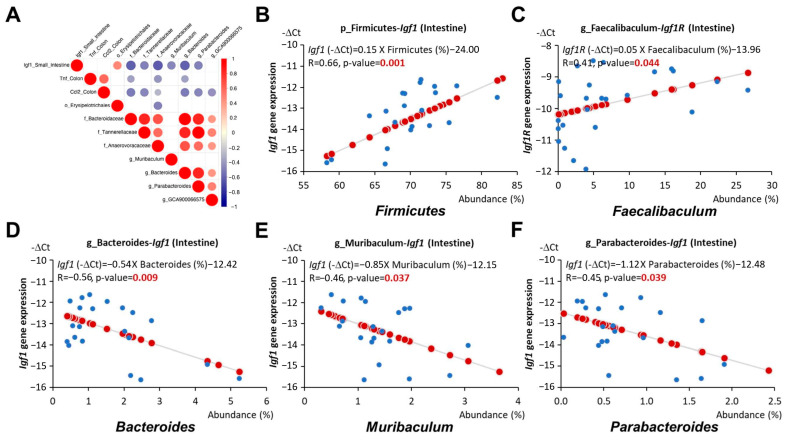
Figure 7
Relationship between gut microbiota and…
Figure 7
Relationship between gut microbiota and Igf1 expression in APC 1638N mice. ( A…
Figure 7 Relationship between gut microbiota and Igf1 expression in APC1638N mice. (A) Correlation matrix of gut microbiota and Igf1 expression in the small intestine or cytokines Tnf and Ccl2 expressions in the colon. Red or blue dots represent significantly positive or negative coefficients. (B) Linear relationships between Firmicutes and Igf1 expression in the small intestine. (C) Linear relationships between Faecalibaculum and Igf1 expression in the small intestine. (D) Linear relationships between Bacteroides and Igf1 expression in the small intestine. (E) Linear relationships between Muribaculum and Igf1 expression in the small intestine. (F) Linear relationships between Parabacteroides and Igf1 expression in the small intestine. Blue circles indicate the representative -∆Ct value and abundance (%) of each mouse. Red circles indicate the linear relationships between the x and y axes.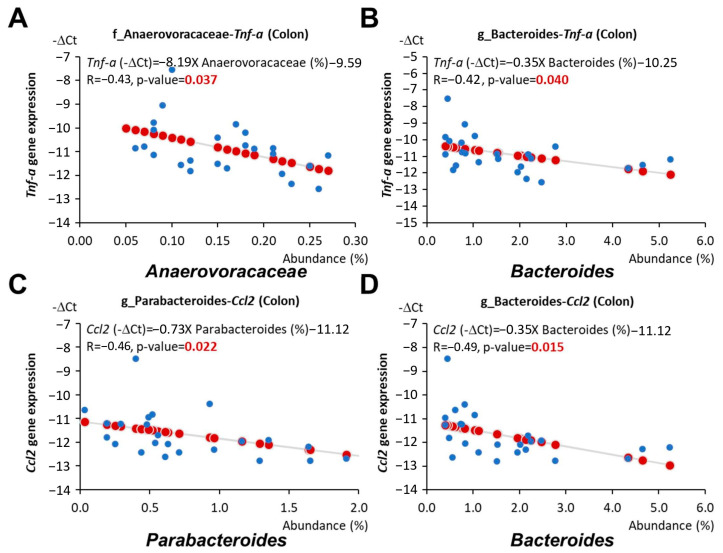
Figure 8
Relationship between gut microbiota and…
Figure 8
Relationship between gut microbiota and cytokine gene expressions in young adulthood APC 1638N…
Figure 8 Relationship between gut microbiota and cytokine gene expressions in young adulthood APC1638N mice. (A) Linear relationships between Anaerovoraceae and Tnf expression in the colon. (B) Linear relationships between Bacteroides and Tnf expression in the colon. (C) Linear relationships between Parabacteroides and Ccl2 expression in the colon. (D) Linear relationships between Bacteroides and Ccl2 expression in the colon. Blue circles indicate the representative -∆Ct value and abundance (%) of each mouse. Red circles indicate the linear relationships between the x and y axes. All figures (8)