Antrodia camphorata polysaccharide resists 6-OHDA-induced dopaminergic neuronal damage by inhibiting ROS-NLRP3 activation
Abstract
Figures 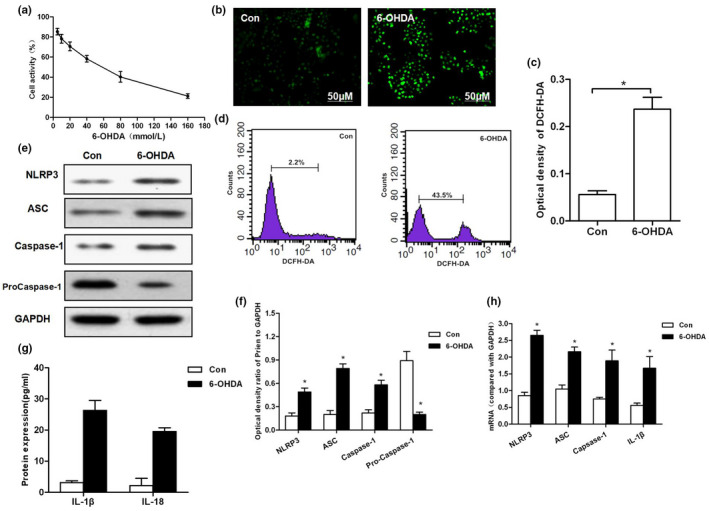
FIGURE 1
Results of 6‐OHDA‐induced ROS‐NLRP3 activation…
FIGURE 1
Results of 6‐OHDA‐induced ROS‐NLRP3 activation in MES23.5 cells. (a) Effect of 6‐OHDA on…
FIGURE 1 Results of 6‐OHDA‐induced ROS‐NLRP3 activation in MES23.5 cells. (a) Effect of 6‐OHDA on cell viability and IC50 values at gradient concentrations. (b, c) The levels of ROS production detected by DCFH‐DA probe and corresponding statistical results. (d) Flow cytometry was used to detect DCFH‐DA‐positive cells. 6‐OHDA could induce ROS production, and the number of positive cells was significantly higher than that of Con group (p < .01). (e–h) 6‐OHDA induced the activation of NLRP3 in cells. The protein and mRNA levels of key proteins, including NLRP3, ASC, and caspase‐1, were significantly increased, compared with Con group, *p < .05; levels of inflammatory factors, including IL‐1β and IL‐18, compared to Con group, *p < .05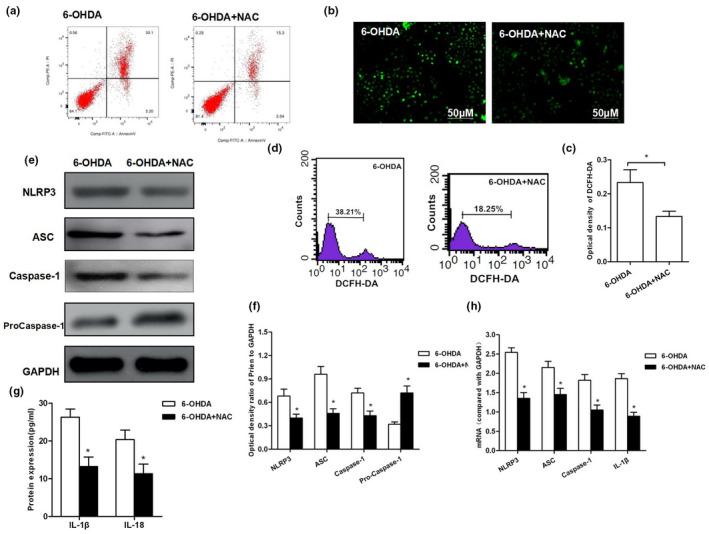
FIGURE 2
ROS inhibition resisted 6‐OHDA‐induced NLRP3…
FIGURE 2
ROS inhibition resisted 6‐OHDA‐induced NLRP3 activation resulted in cell injury. (a) After inhibition…
FIGURE 2 ROS inhibition resisted 6‐OHDA‐induced NLRP3 activation resulted in cell injury. (a) After inhibition of ROS, the same concentration of 6‐OHDA was used for intervention. As a result, the apoptotic rate was significantly down‐regulated in 6‐OHDA + NAC group than that in 6‐OHDA group (p < .05). (b, c) DCFH‐DA probe was used to detect the level of ROS production and corresponding statistical results. (d) Flow cytometry was used to detect DCFH‐DA‐positive cells. The number of positive cells was significantly less in 6‐OHDA‐NAC group than that in 6‐OHDA group (p < .01).(e–h) Detection of NLRP3 activation: Both protein and mRNA levels of key proteins NLRP3, ASC, and caspase‐1 were significantly decreased in 6‐OHDA‐NAC group than those in 6‐OHDA group, *p < .05; the levels of inflammatory factors IL‐1β and IL, *p < .05 compared to 6‐OHDA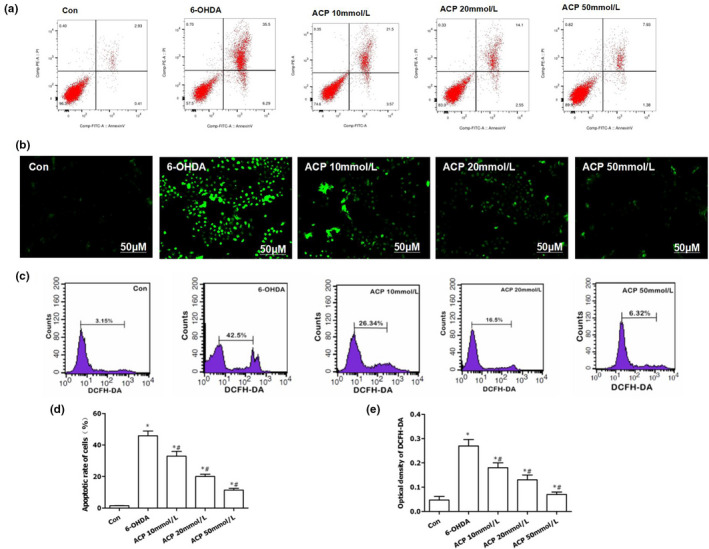
FIGURE 3
ACP protected dopaminergic neurons by…
FIGURE 3
ACP protected dopaminergic neurons by inhibiting 6‐OHDA‐induced ROS expression. (a, d) ACP exerted…
FIGURE 3 ACP protected dopaminergic neurons by inhibiting 6‐OHDA‐induced ROS expression. (a, d) ACP exerted a protective effect on 6‐OHDA‐induced dopaminergic neurons. ACP intervention led to significantly down‐regulated apoptotic rate, compared with Con group, *p < .05; compared with 6‐OHDA group, #p < .05. (b, c) DCFH‐DA staining was used to detect ROS expression. The cellular level of ROS was significantly down‐regulated after ACP intervention, and the number of positive cells decreased, as indicated by flow cytometry. (e) The results of fluorescence intensity after DCFH‐DA staining: The absorbance was significantly down‐regulated after ACP intervention in a dose‐dependent manner, compared with Con group, *p < .05; compared with 6‐OHDA group, #p < .05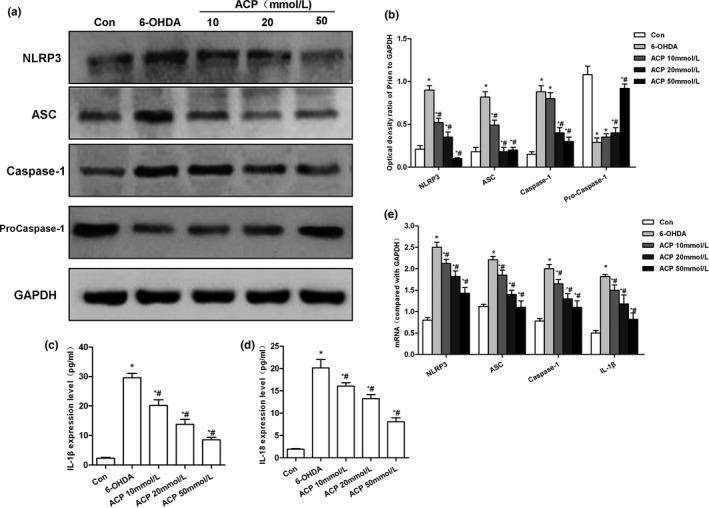
FIGURE 4
Effect of protein and mRNA…
FIGURE 4
Effect of protein and mRNA expression of NPRP3 after ACP intervention. (a, b)…
FIGURE 4 Effect of protein and mRNA expression of NPRP3 after ACP intervention. (a, b) ACP pretreatment led to significantly down‐regulated 6‐OHDA‐induced NLRP3 activation. In addition, the expression of NLRP3, ASC, and caspase‐1 was down‐regulated, while that of pro‐caspase‐1 was up‐regulated, and the level of pro‐caspase‐1 was decreased, *p < .05 compared to Con group; #p < .05 compared to 6‐OHDA group. (b, c) ACP pretreatment resulted in the significantly down‐regulated levels of inflammatory factors IL‐1β and IL‐18 in the culture medium, compared with Con group, *p < .05; compared with 6‐OHDA group, #p < .05. (d) ACP pretreatment caused down‐regulation in the mRNA expression levels of NLRP3, ASC, caspase‐1, and IL‐1β, which was consistent with protein level trend, compared with Con group, *p < .05; compared with 6‐OHDA group, #p < .05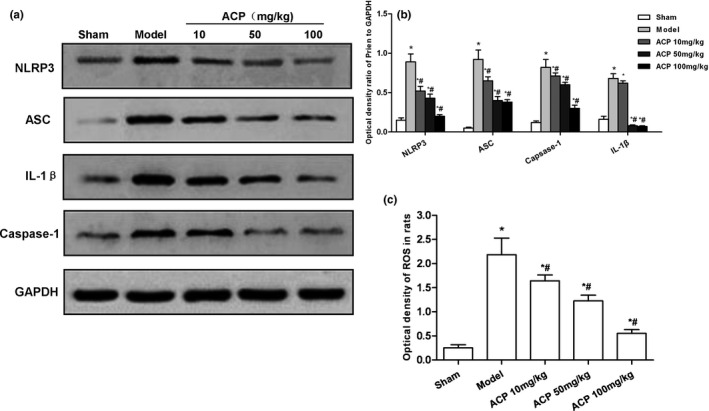
FIGURE 5
Effect of ACP on the…
FIGURE 5
Effect of ACP on the expression of ROS‐NLRP3 in the striatum of PD…
FIGURE 5 Effect of ACP on the expression of ROS‐NLRP3 in the striatum of PD mice. (a, b) ACP intervention could lead to the activation of NLRP3 inflammasome in mouse striatum. The expression levels of NLRP3, ASC, caspase‐1, and IL‐1β were significantly higher in Model group than those in Sham group. After ACP intervention, the expression level was decreased compared with Sham Group, *p < .05; compared with Model group, #p < .05. (c) Fluorescence detection of ROS in the striatum. The level of ROS was significantly higher in Model group than that in Sham group. Moreover, the expression level of ROS was decreased after ACP intervention, compared with Sham group, *p < .05; compared with Model group, #p < .05