Antrodia camphorata polysaccharide improves inflammatory response in liver injury via the ROS/TLR4/NF-κB signal
Abstract
Antrodia Camphorata Polysaccharide (ACP) refers to a kind of polysaccharide extracted from the natural porous fungus Antrodia camphorata. This study investigated the mechanism of action of ACP in protecting the liver. The results showed that ACP suppressed the LPS-induced KC cell activation, reduced the expression of inflammatory factors, increased the SOD level and suppressed ROS expression. In addition, N-acetylcysteine (NAC) was adopted for pre-treatment to suppress ROS. The results indicated that NAC synergistically exerted its effect with ACP, suggesting that ACP played its role through suppressing ROS. Further detection revealed that ACP activated the Nrf2 signal. It was discovered in the mouse model that, ACP effectively improved liver injury in mice, decreased ALT and AST levels, and suppressed the expression of inflammatory factors. This study suggests that ACP can exert its effect against oxidative stress via the Nrf2-ARE signalling, which further improves the production of ROS and the activation of TLR4-NF-κB signalling, and protects the liver against liver injury.
Figures 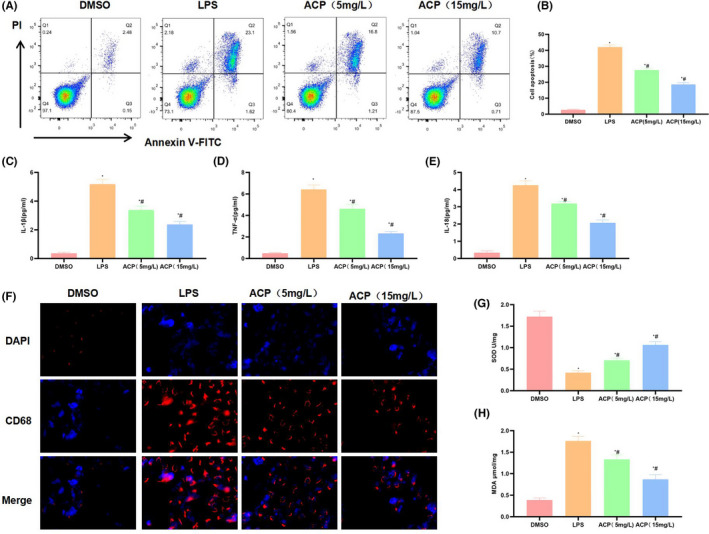
FIGURE 1
Effect of ACP on the…
FIGURE 1
Effect of ACP on the activation of KCs ( n = 3). (A,…
FIGURE 1 Effect of ACP on the activation of KCs (n = 3). (A, B) Cell apoptosis detection results. LPS promoted the inflammatory injury of KCs and increased the cell apoptosis rate, while ACP suppressed cell apoptosis in a dose‐dependent manner, and high‐dose ACP generated more obvious effect. *p < 0.05, compared with DMSO; #p < 0.05, compared with LPS. (C–E) Expression and release of inflammatory factors. LPS promoted the expression and release of IL‐1β, IL‐18 and TNF‐α in KCs. ACP significantly suppressed such change and lowered the levels of inflammatory factors. *p < 0.05, compared with DMSO; #p < 0.05, compared with LPS. (F) CD68 expression detected by immunofluorescence staining (n = 3). LPS activated KCs and up‐regulated CD68 expression, while ACP suppressed KC activation and decreased CD68 expression. (G, H) SOD and MDA detection results (x¯ ± s, n = 3). LPS down‐regulated SOD expression and increased MDA level, whereas ACP significantly increased SOD expression, decreased MDA level, and had antagonistic effect on LPS. *p < 0.05, compared with DMSO; #p < 0.05, compared with LPS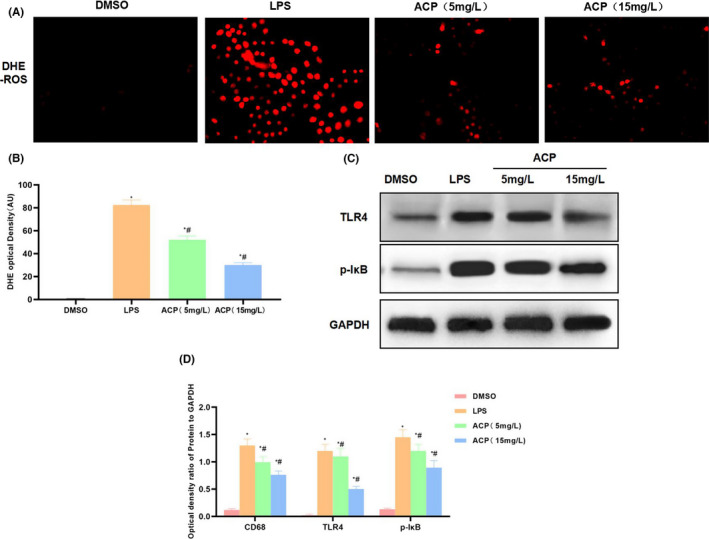
FIGURE 2
Effect of ACP on the…
FIGURE 2
Effect of ACP on the ROS‐TLR4/NFκB signal in the activation of KCs (…
FIGURE 2 Effect of ACP on the ROS‐TLR4/NFκB signal in the activation of KCs (n = 3). (A, B) ROS expression detected by DHE probe. LPS activated ROS expression and significantly increased the fluorescence intensity, while ACP suppressed ROSDE level in a dose‐dependent manner, and the fluorescence intensity was significantly weakened compared with LPS. *p < 0.05, compared with DMSO; #p < 0.05, compared with LPS. (C, D) Protein expression detection results. LPS activated TLR4/NFκB signal, remarkably up‐regulated TLR4 and p‐IкB expression, while ACP suppressed TLR4 and p‐IкB expression. *p < 0.05, compared with DMSO; #p < 0.05, compared with LPS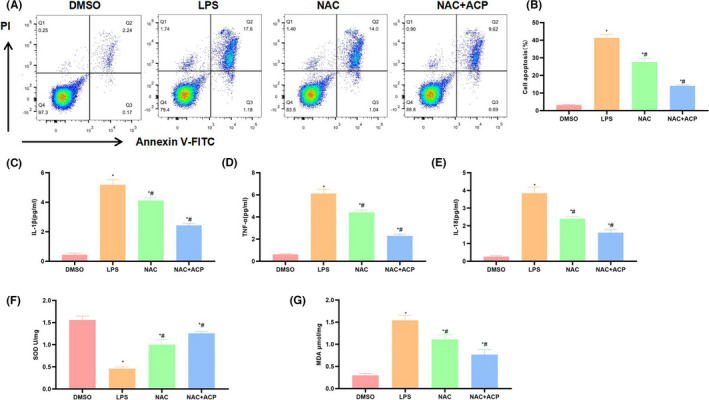
FIGURE 3
Effect of synergistic action of…
FIGURE 3
Effect of synergistic action of NAC with ACP in suppressing ROS on KC…
FIGURE 3 Effect of synergistic action of NAC with ACP in suppressing ROS on KC activation (n = 3). (A, B) Cell apoptosis detection results. NAC synergistically suppressed inflammatory injury of KCs with ACP and decreased the cell apoptosis rate. *p < 0.05, compared with DMSO; #p < 0.05, compared with LPS. (C–E) Inflammatory factor expression and release. LPS promoted the expression and release of IL‐1β, IL‐18 and TNF‐α in KCs, NAC synergistically decreased inflammatory factor expression with ACP. *p < 0.05, compared with DMSO; #p < 0.05, compared with LPS. (F, G) SOD and MDA detection results. LPS down‐regulated SOD expression and increased MDA level, whereas NAC + ACP significantly increased SOD level and decreased MDA expression. *p < 0.05, compared with DMSO; #p < 0.05, compared with LPS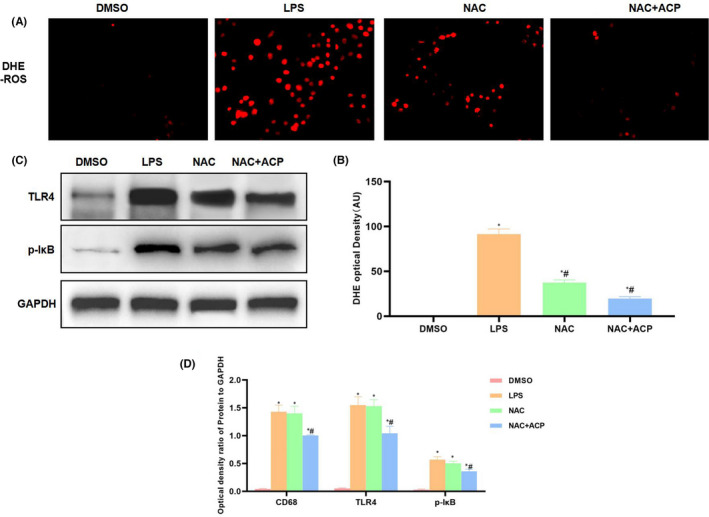
FIGURE 4
Effect of ACP on ROS‐TLR4/NFκB…
FIGURE 4
Effect of ACP on ROS‐TLR4/NFκB signal in KC activation ( n = 3).…
FIGURE 4 Effect of ACP on ROS‐TLR4/NFκB signal in KC activation (n = 3). (A, B) ROS expression detected by DHE (x¯ ± s, n = 3). NAC suppressed ROS expression, NAC + ACP further inhibited ROS expression and exerted the synergistic effect. In comparison with LPS, the fluorescence intensity significantly decreased. *p < 0.05, compared with DMSO; #p < 0.05, compared with LPS. (C, D) Protein expression detection results (x¯ ± s, n = 3). The expression of TLR4 and p‐IкB in LPS group was significantly up‐regulated, while NAC + ACP inhibited TLR4 and p‐IкB expression. *p < 0.05, compared with DMSO; #p < 0.05, compared with LPS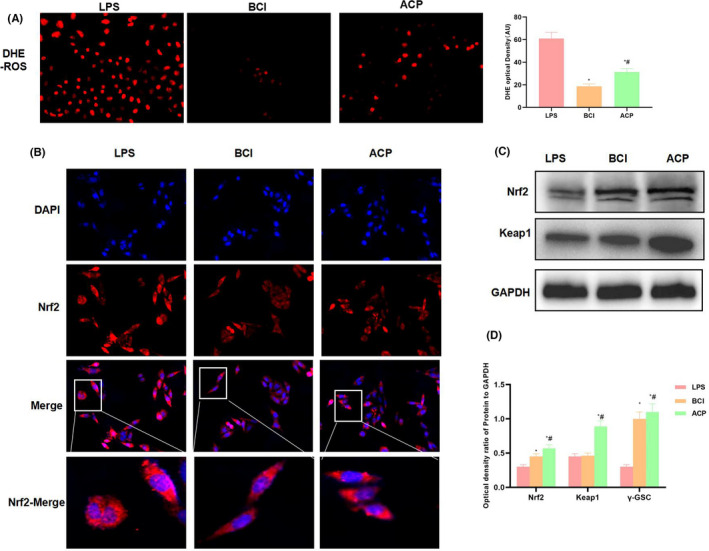
FIGURE 5
Mechanism of ACP in activating…
FIGURE 5
Mechanism of ACP in activating Nrf2 signal to exert the anti‐ROS effect (…
FIGURE 5 Mechanism of ACP in activating Nrf2 signal to exert the anti‐ROS effect (n = 3). (A) ROS expression detected by DHE. BCI activated Nrf2 to suppress ROS expression. Compared with LPS, the fluorescence intensity significantly decreased. ACP suppressed ROS levels. *p < 0.05, compared with LPS; #p < 0.05, compared with BCI. (B) Nrf2 expression detected by immunofluorescence staining. LPS activated the expression of Nrf2, while BCI and ACP further promoted NRf2 expression and improved its nuclear translocation. (C, D) Protein expression detection results. BCI activated Nrf2 signal, and up‐regulated the expression of Nrf2 and Keap1. Similarly, ACP also activated Nrf2 expression, and its effect was comparable to BCI. *p < 0.05, compared with LPS; #p < 0.05, compared with BCI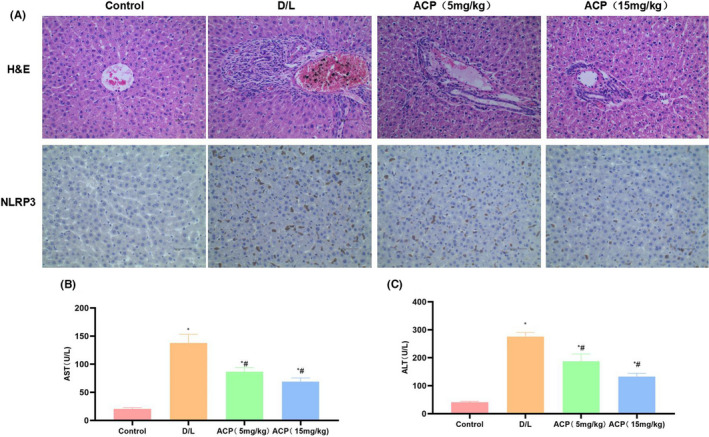
FIGURE 6
Effect of ACP on liver…
FIGURE 6
Effect of ACP on liver injury of mice. (A) H&E staining and immunohistochemical…
FIGURE 6 Effect of ACP on liver injury of mice. (A) H&E staining and immunohistochemical staining of mouse liver tissues (n = 5). NLRP3 expression was negative in Control group, while that in D/L group was up‐regulated, and ACP suppressed NLRP3 expression. H&E staining suggested that mouse liver tissues in D/L group experienced severe inflammation and oedema, with significant difference compared with Control group, while ACP improved inflammatory response and oedema. (B, C) ALT and AST expression in mice (n = 10). ALT and AST expression in peripheral blood of D/L mice was substantially up‐regulated, significantly higher than that in Control group. ACP intervention down‐regulated ALT and AST levels, and high‐dose ACP had superior effect to low‐dose ACP. *p < 0.05, compared with Control group; #p < 0.05, compared with D/L group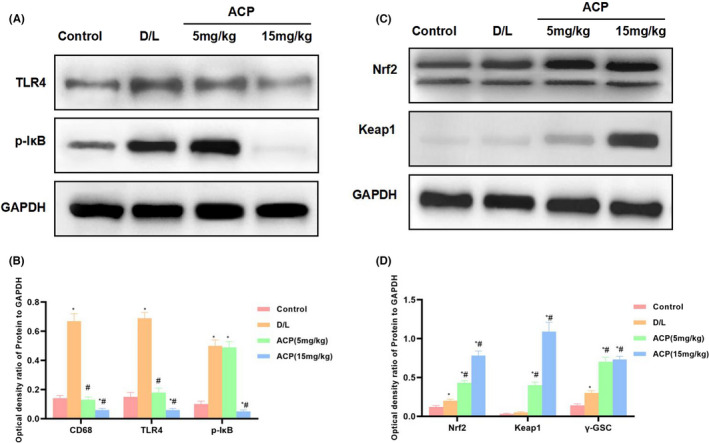
FIGURE 7
Effect on protein expression in…
FIGURE 7
Effect on protein expression in mouse liver tissues ( n = 3). TLR4…
FIGURE 7 Effect on protein expression in mouse liver tissues (n = 3). TLR4 and I‐κB expression significantly increased in D/L group, higher than that in Control group. ACP intervention suppressed protein expression, inhibited TLR4 and I‐κB expression, activated the Nrf2 signal, and up‐regulated Nrf2 and keap1 protein levels. *p < 0.05, compared with Control group; #p < 0.05, compared with D/L group All figures (7)