Antrodia Camphorata Polysaccharide activates autophagy and regulates NLRP3 degradation to improve liver injury-related inflammatory response
Abstract
This study illustrated the liver protection mechanism of ACP from the perspective of autophagy activation. ACP suppressed the inflammatory injury of KCs, and decreased the cell apoptosis rate. After LTG and LC3 staining, ACP promoted lysosomal production, increased LC3 expression, activated autophagy, and suppressed the expression of NLRP3 and inflammatory factors. Under the electron microscope, ACP accelerated the production of autophagosomes. After simultaneous treatment with 3-MA and ACP, the effect of ACP on resisting KC injury decreased, the expression of NLRP3 was up-regulated, and autophagy was suppressed. As discovered in the mouse model of liver injury, ACP inhibited the ALT and AST levels, promoted the occurrence of autophagy, reduced NLRP3 expression and alleviated liver injury. ACP activates autophagy to induce NLRP3 degradation, thus suppressing inflammatory response in liver injury and exerting the liver protection effect, which is one of the mechanisms of action of ACP.
Figures 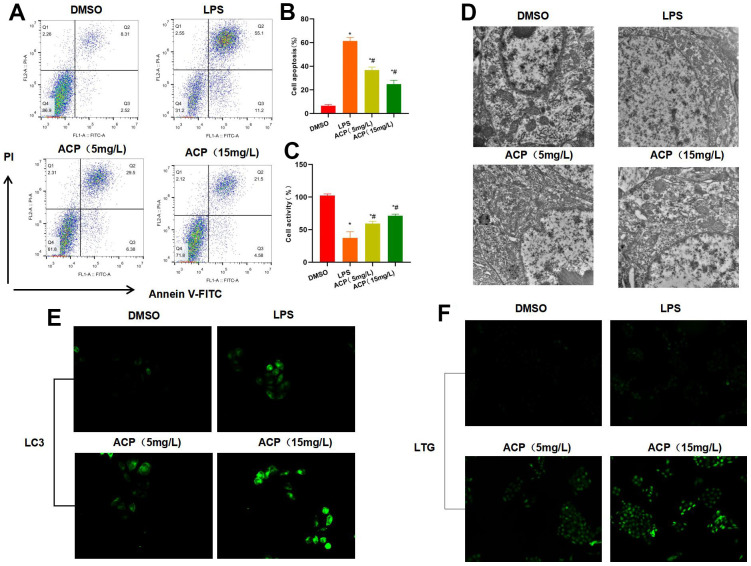
Figure 1
ACP suppressed cell injury and…Figure 1
ACP suppressed cell injury and activated autophagy (n=3). ( A , B )… Figure 1 ACP suppressed cell injury and activated autophagy (n=3). (A, B) Flow cytometry revealed that LPS induced cell injury and significantly increased the apoptosis rate, while ACP suppressed cell apoptosis in a dose-dependent manner. *P<0.05 compared with DMSO, #P<0.05 compared with LPS. (C) Cell viability test suggested that cell viability decreased in LPS group, lower than that of DMSO group, while ACP suppressed LPS. *P<0.05 compared with DMSO, #P<0.05 compared with LPS. (D) Electron microscope observation demonstrated no obvious lysosome or autophagosome formation in DSMO, while weak autophagy activation was seen in LPS group, and obvious autophagosomes were detected in ACP, suggesting that ACP activated autophagy. (E) LC3 fluorescence staining revealed that LC3 was not significantly activated in DMSO, lowly expressed in LPS and significantly up-regulated in ACP, higher than that in DMSO and LPS group. (F) Lysosome probe LTG analysis suggested that ACP promoted lysosome formation and markedly enhanced the fluorescence intensity.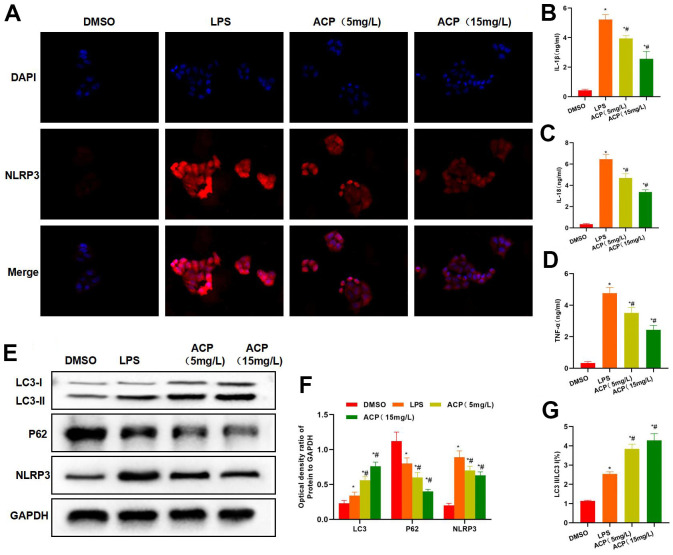
Figure 2
ACP suppressed inflammatory response and…Figure 2
ACP suppressed inflammatory response and NLRP3 activation. ( A ) NLRP3 fluorescence staining… Figure 2 ACP suppressed inflammatory response and NLRP3 activation. (A) NLRP3 fluorescence staining revealed that, LPS promoted NLRP3 expression, and the fluorescence intensity significantly increased, while ACP suppressed NLRP3 expression, significantly lower than LPS group. (B–D) Inflammatory factor detection revealed that, ACP decreased the expression of IL-1β, IL-18 and TNF-α, and the difference was significant compared with LPS group. *P<0.05 compared with DMSO, #P<0.05 compared with LPS. (E, F) Protein detection indicated that LC3 expression significantly increased in ACP group, P62 and NLRP3 expression decreased, and NLRP3 expression was negatively correlated with LC3 expression. At the same time, LC3 II expression increased, showing that autophagy was activated. *P<0.05 compared with DMSO, #P<0.05 compared with LPS. (G) Ratio of LC3 I to LC3 II significantly increased when LC3 I was transformed into LC3 II, suggesting that autophagy was activated and the autophagy flow was smooth. *P<0.05 compared with DMSO, #P<0.05 compared with LPS.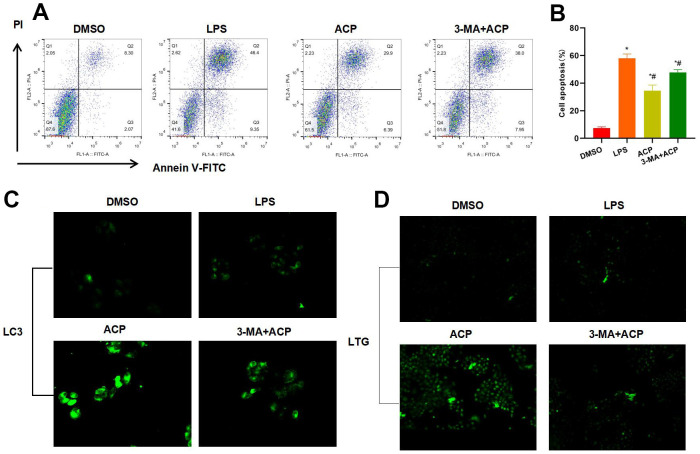
Figure 3
Suppressing autophagy antagonized the effect…Figure 3
Suppressing autophagy antagonized the effect of ACP (n=3). ( A , B )… Figure 3 Suppressing autophagy antagonized the effect of ACP (n=3). (A, B) Flow cytometry results revealed that 3-MA suppressed autophagy, and the effect of ACP was antagonized. Moreover, the cell apoptosis rate in 3-MA+ACP group significantly increased, higher than that of ACP group. *P<0.05 compared with DMSO, #P<0.05 compared with LPS. (C) LC3 staining suggested that 3-MA suppressed LC3 expression, and the fluorescence intensity was weakened. (D) LTG probe detection suggested that 3-MA suppressed lysosome formation.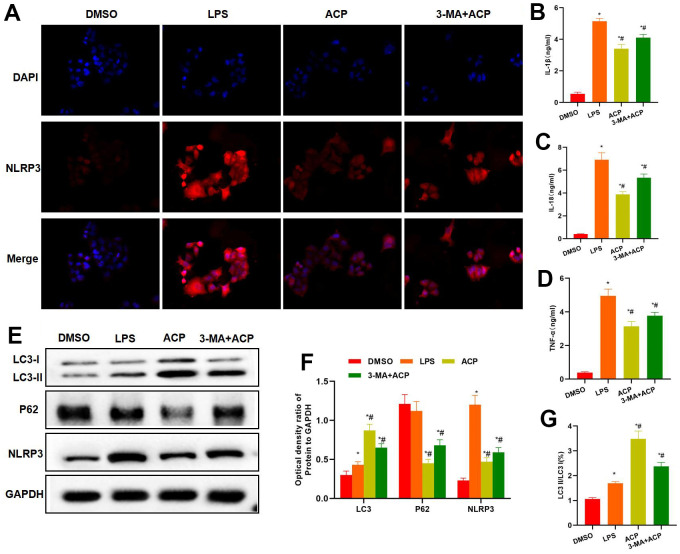
Figure 4
Suppressing autophagy enhanced inflammatory response…Figure 4
Suppressing autophagy enhanced inflammatory response and NLRP3 expression. ( A ) NLRP3 staining… Figure 4 Suppressing autophagy enhanced inflammatory response and NLRP3 expression. (A) NLRP3 staining results indicated that, 3-MA antagonized the effect of ACP, and NLRP3 expression markedly increased in 3-MA+ACP group, higher than that in ACP group. (B–D) The expression levels of inflammatory factors IL-1β, IL-18 and TNF-α in 3-MA+ACP group were higher than those in ACP group. *P<0.05 compared with DMSO, #P<0.05 compared with LPS. (E–G) Protein detection demonstrated that 3-MA suppressed autophagy, LC3 expression decreased in 3-MA+ACP group, while NLRP3 and P62 expression increased, and the differences were significant compared with ACP group. Meanwhile, the LC3 II/LC3 I ratio decreased. *P<0.05 compared with DMSO, #P<0.05 compared with LPS.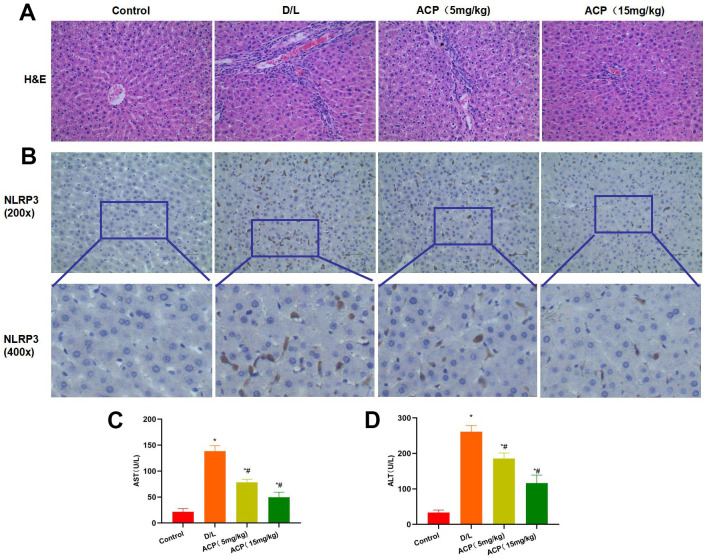
Figure 5
ACP suppressed liver injury in…Figure 5
ACP suppressed liver injury in mice (n=5). ( A ) In H&E staining,… Figure 5 ACP suppressed liver injury in mice (n=5). (A) In H&E staining, obvious inflammatory response and injury were observed in liver tissues of D/L group, along with distinct bubble-like lesions, while ACP suppressed tissue inflammation and alleviated injury. (B) In NLRP3 staining, NLRP3 expression significantly increased in D/L group, while it was not expressed in Control group, demonstrating that liver injury led to NLRP3 activation. ACP dramatically reduced NLRP3 expression in tissues, and the difference was significant compared with D/L group. (C, D) In ALT and AST detection, ACP alleviated liver injury, and reduced ALT and AST expression in a dose-dependent manner. *P<0.05 compared with Control, #P<0.05 compared with D/L.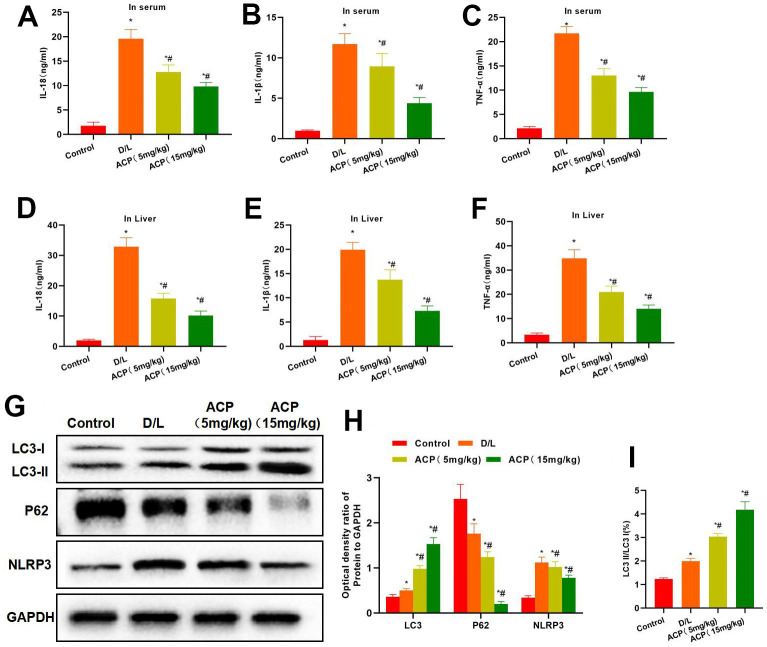
Figure 6
ACP suppressed inflammatory response and…Figure 6
ACP suppressed inflammatory response and activated autophagy. ( A – F ) As… Figure 6 ACP suppressed inflammatory response and activated autophagy. (A–F) As discovered from serum and tissue inflammatory factor detection, the expression of serum and tissue inflammatory factors in D/L group increased, which was significantly higher than that of Control group. While ACP reduced the serum inflammatory factor levels in a dose-dependent manner. *P<0.05 compared with Control, #P<0.05 compared with D/L. (G–I) In protein detection, ACP promoted LC3 expression in tissues while suppressing NLRP3 expression, meanwhile, P62 expression also increased, and the LC3 II/LC3 I ratio increased in tissues. *P<0.05 compared with Control, #P<0.05 compared with D/L.