Antrodan Alleviates High-Fat and High-Fructose Diet-Induced Fatty Liver Disease in C57BL/6 Mice Model via AMPK/Sirt1/SREBP-1c/PPARγ Pathway
Abstract
Non-alcoholic fatty liver disease (NAFLD) and -steatohepatitis (NASH) imply a state of excessive fat built-up in livers with/or without inflammation and have led to serious medical concerns in recent years. Antrodan (Ant), a purified β-glucan from A. cinnamomea has been shown to exhibit tremendous bioactivity, including hepatoprotective, antihyperlipidemic, antiliver cancer, and anti-inflammatory effects. Considering the already well-known alleviating bioactivity of A. cinnamomea for the alcoholic steatohepatitis (ASH), we propose that Ant can be beneficial to NAFLD, and that the AMPK/Sirt1/PPARγ/SREBP-1c pathways may be involved in such alleviations. To uncover this, we carried out this study with 60 male C57BL/6 mice fed high-fat high-fructose diet (HFD) for 60 days, in order to induce NAFLD/NASH. Mice were then grouped and treated (by oral administration) as: G1: control; G2: HFD (HFD control); G3: Ant, 40 mgkg (Ant control); G4: HFD+Orlistat (10 mg/kg) (as Orlistat control); G5: HFD+Ant L (20 mg/kg); and G6: HFD+Ant H (40 mg/kg) for 45 days. The results indicated Ant at 40 mg/kg effectively suppressed the plasma levels of malondialdehyde, total cholesterol, triglycerides, GOT, GPT, uric acid, glucose, and insulin; upregulated leptin, adiponectin, pAMPK, Sirt1, and down-regulated PPARγ and SREBP-1c. Conclusively, Ant effectively alleviates NAFLD via AMPK/Sirt1/CREBP-1c/PPARγ pathway.
Figures 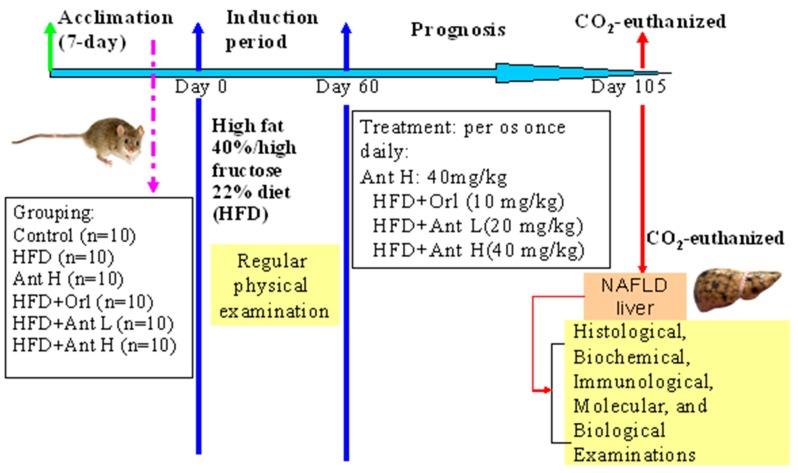
Figure 1
The time course of scheduled…
Figure 1
The time course of scheduled experiment to assess the alleviative effect of Antrodan…
Figure 1 The time course of scheduled experiment to assess the alleviative effect of Antrodan for high fructose diet (HFD)–induced fatty liver in C57BL/6 mice. HFD: high fat 40% and high fructose 22% diet. Ant: Antrodan. Ant L: low dose Ant (20 mg/kg). Ant H: high dose Ant (40 mg/kg).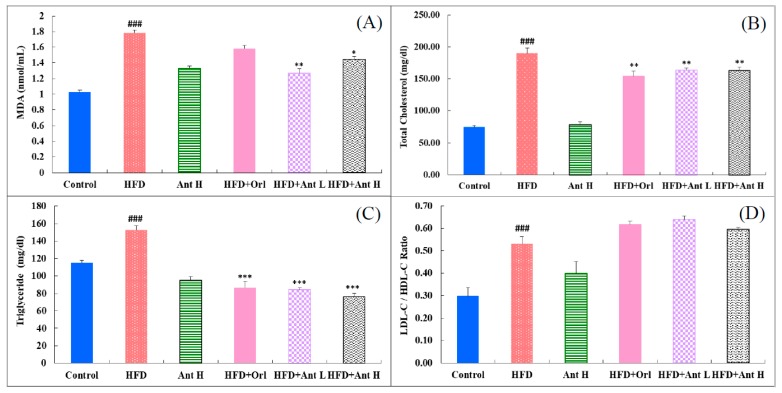
Figure 2
Effects of Antrodan on the…
Figure 2
Effects of Antrodan on the plasma lipid peroxidation ( A ) and lipid…
Figure 2 Effects of Antrodan on the plasma lipid peroxidation (A) and lipid profiles (B–D) in HFD-fed mice. Dada are expressed as mean ± SEM (n = 10). HFD: high fat 40% and high fructose 22% diet. Ant: Antrodan. HFD+Orl: HFD+Orlistat (10 mg/kg). HFD+Ant L: HFD+Ant (20 mg/kg), HFD+Ant H: HFD+Ant (40 mg/kg). ### p < 0.001 and ## p < 0.01 compared to the control; *** p < 0.001 and ** p < 0.01 compared to the HFD group.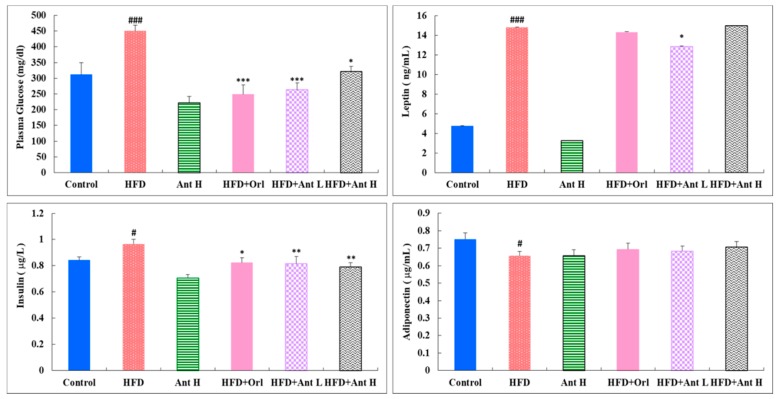
Figure 3
Effect of Antrodan on the…
Figure 3
Effect of Antrodan on the plasma levels of glucose, insulin, leptin, and adiponectin…
Figure 3 Effect of Antrodan on the plasma levels of glucose, insulin, leptin, and adiponectin in the HFD-fed mice. Data are expressed as mean ± SEM (n = 10). HFD: high fat 40% and high fructose 22% diet. Ant: Antrodan. Ant H: Ant 40 mg/kg, HFD+Orl: HFD+Orlistat (10 mg/kg), HFD+nt L: HFD+Ant (20 mg/kg), HFD+Ant H: HDF+Ant (40 mg/kg). ### p < 0.001 and # p < 0.05 compared to the control; ***p < 0.001, ** p < 0.01 and * p < 0.05 compared to the HFD group.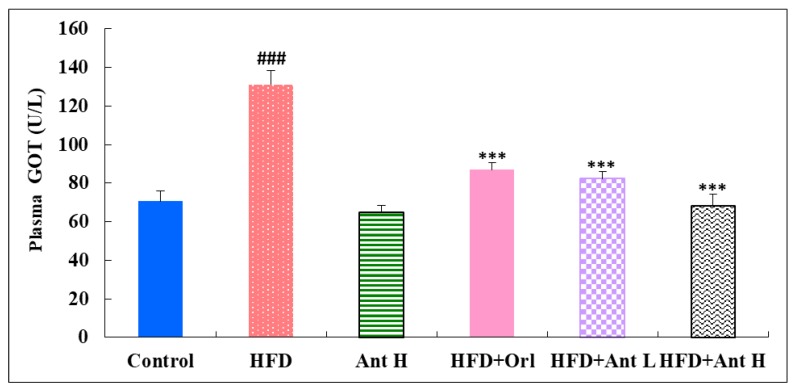
Figure 4
Effects of Antrodan on the…
Figure 4
Effects of Antrodan on the plasma levels of GOT, GPT, and uric acid…
Figure 4 Effects of Antrodan on the plasma levels of GOT, GPT, and uric acid in HFD-fed mice. Values are expressed as the mean ± SEM (n =10). ### p < 0.001, ## p < 0.01 and # p < 0.05 compared to the control; *** p < 0.001, ** p < 0.0.01 and * p < 0.05 compared to the HFD group.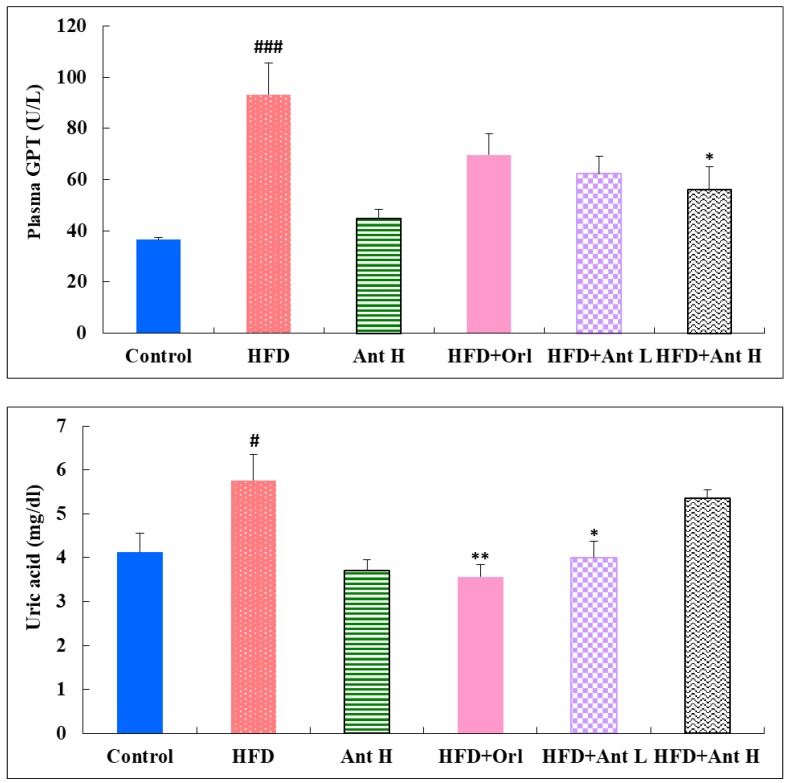
Figure 4
Effects of Antrodan on the…
Figure 4
Effects of Antrodan on the plasma levels of GOT, GPT, and uric acid…
Figure 4 Effects of Antrodan on the plasma levels of GOT, GPT, and uric acid in HFD-fed mice. Values are expressed as the mean ± SEM (n =10). ### p < 0.001, ## p < 0.01 and # p < 0.05 compared to the control; *** p < 0.001, ** p < 0.0.01 and * p < 0.05 compared to the HFD group.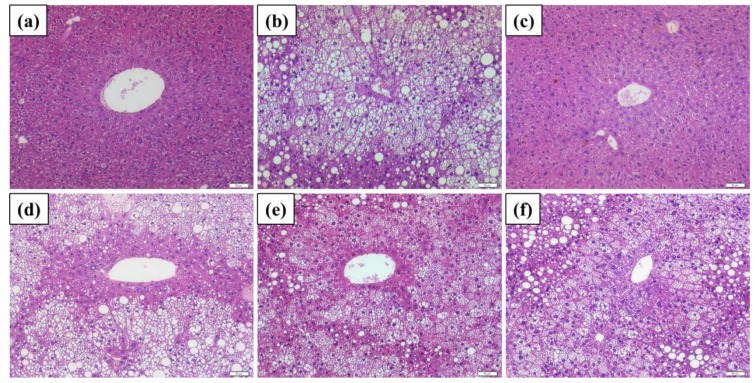
Figure 5
Liver biopsy with Hematoxylin and…
Figure 5
Liver biopsy with Hematoxylin and Eosin staining. HFD: high fat 40% and high…
Figure 5 Liver biopsy with Hematoxylin and Eosin staining. HFD: high fat 40% and high fructose 22% diet. Ant: Antrodan; (a) control; (b) steatosis caused by HFD; (c) HFD+Ant-L (20 mg/kg). (d) HFD+Orl: HFD+orlistat (10 mg/kg). (e) HFD+Ant-L (20 mg/kg), and (f) HFD+Antr (40 mg/kg). Scale bar: 100 μm. (Magnification, 200×).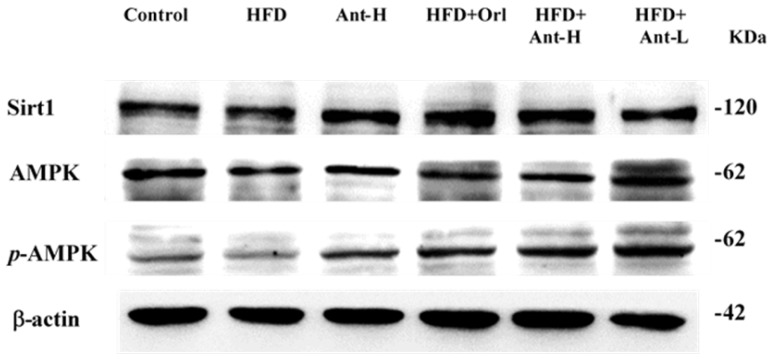
Figure 6
Effect of Antrodan on high-fat/high-fructose…
Figure 6
Effect of Antrodan on high-fat/high-fructose diet-induced expression of Sirt1, AMPK and p-AMPK in…
Figure 6 Effect of Antrodan on high-fat/high-fructose diet-induced expression of Sirt1, AMPK and p-AMPK in the liver tissues of mice. Data are expressed as the mean ± SEM (n = 10). # p < 0.05 and ## p < 0.01 compared with the control. * p < 0.05, ** p < 0.01 and *** p < 0.001 compared with the HFD group.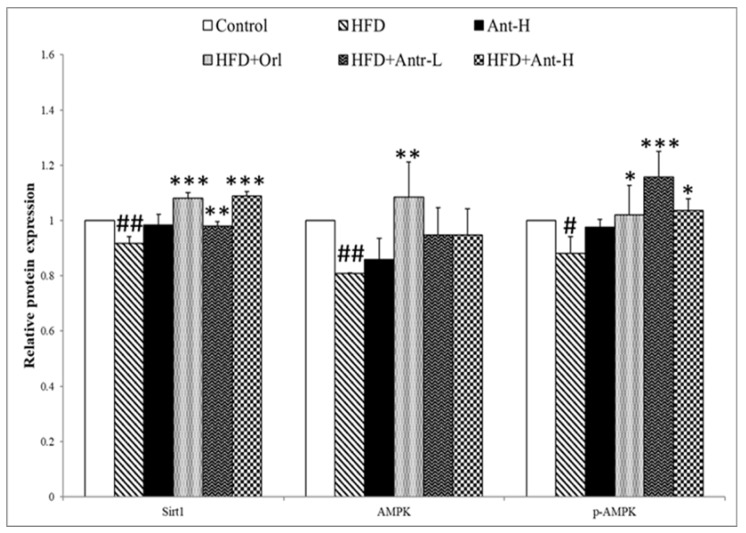
Figure 6
Effect of Antrodan on high-fat/high-fructose…
Figure 6
Effect of Antrodan on high-fat/high-fructose diet-induced expression of Sirt1, AMPK and p-AMPK in…
Figure 6 Effect of Antrodan on high-fat/high-fructose diet-induced expression of Sirt1, AMPK and p-AMPK in the liver tissues of mice. Data are expressed as the mean ± SEM (n = 10). # p < 0.05 and ## p < 0.01 compared with the control. * p < 0.05, ** p < 0.01 and *** p < 0.001 compared with the HFD group.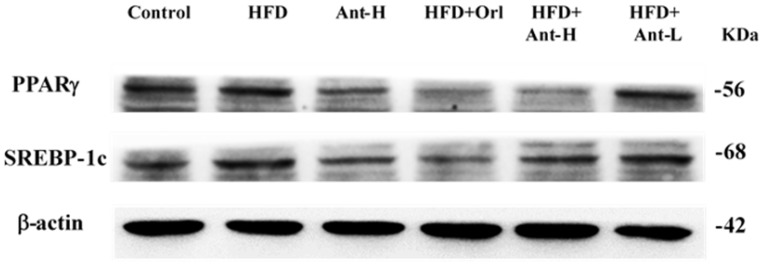
Figure 7
Effect of Antrodan on high-fat/high-fructose…
Figure 7
Effect of Antrodan on high-fat/high-fructose diet-induced expression of PPARγ and SREBP-1c in the…
Figure 7 Effect of Antrodan on high-fat/high-fructose diet-induced expression of PPARγ and SREBP-1c in the liver tissues of mice. Data are expressed as the mean ± SEM (n = 10). # p < 0.05 and ## p < 0.01 compared with the control. * p < 0.05 and ** p < 0.01 compared with the HFD group.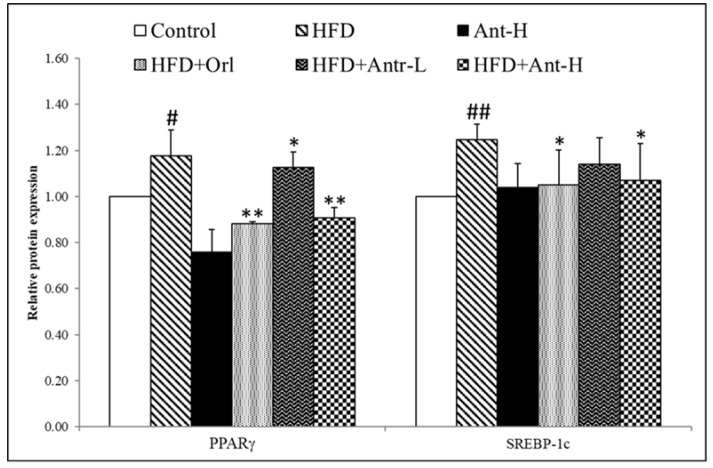
Figure 7
Effect of Antrodan on high-fat/high-fructose…
Figure 7
Effect of Antrodan on high-fat/high-fructose diet-induced expression of PPARγ and SREBP-1c in the…
Figure 7 Effect of Antrodan on high-fat/high-fructose diet-induced expression of PPARγ and SREBP-1c in the liver tissues of mice. Data are expressed as the mean ± SEM (n = 10). # p < 0.05 and ## p < 0.01 compared with the control. * p < 0.05 and ** p < 0.01 compared with the HFD group.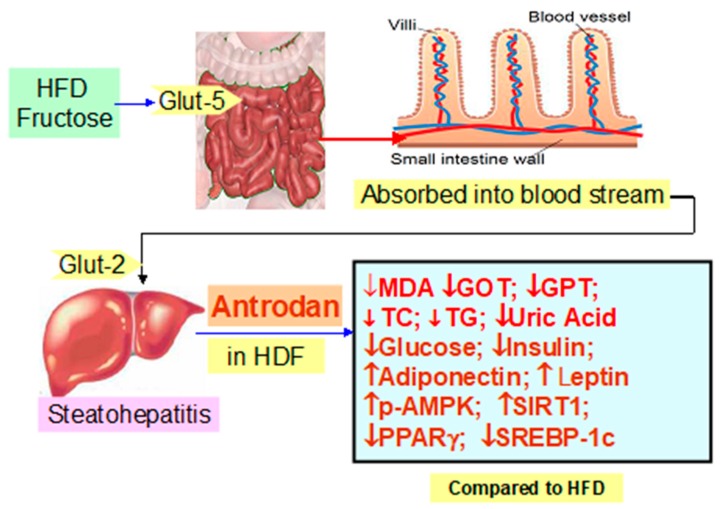
Figure 8
Summary of the results in…
Figure 8
Summary of the results in this study. GOT: Glutamate-oxaloacetate transaminase; GPT: Glutamate-pyruvate transaminase;…
Figure 8 Summary of the results in this study. GOT: Glutamate-oxaloacetate transaminase; GPT: Glutamate-pyruvate transaminase; p-AMPK: phosphor-AMP-activated protein kinase; PPARγ: Peroxisome proliferator-activated receptor gamma; SREBP-1c: Sterol regulatory element-binding protein-1c. Fructose contained in the high fat HFD is transported via glucose transporter 5 (Glut-5) located on the villi in intestine into the blood stream and then distributed to many tissues, in particular, the liver carrying Glut-2 via which fructose is transferred into the cytoplasm of cells, where HFD induces steatohepatitis, which can be alleviated by Antrodan at 20–40 mg/kg.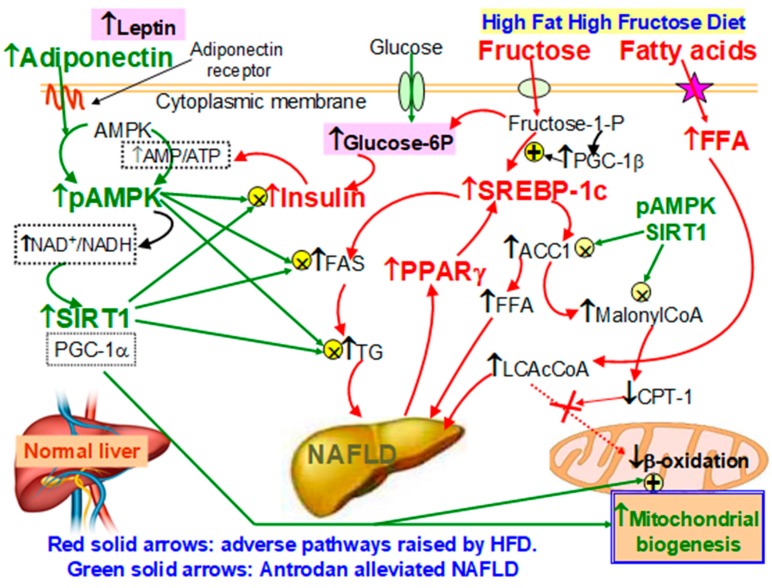
Figure 9
Antrodan alleviated the HFD-induced NAFLD…
Figure 9
Antrodan alleviated the HFD-induced NAFLD via the. AMPK/SREBP-1c/PPARγ pathway HFD: High fat-high fructose…
Figure 9 Antrodan alleviated the HFD-induced NAFLD via the. AMPK/SREBP-1c/PPARγ pathway HFD: High fat-high fructose diet. NAFLD: non-alcoholic fatty liver disease. ACC1: Acetyl-CoA carboxylase-1; AMPK: AMP-activated protein kinase; p-AMPK: phosphor-AMP-activated protein kinase; FAS: fatty acid synthase; FFA: free fatty acids; LCAc-CoA: long chain acyl CoA. PPARγ: Peroxisome proliferator-activated receptor gamma; SREBP-1c: Sterol regulatory element-binding protein-1c. TG: triglycerides; CPT-1: carnitine palmitoyltransferase I. The major part of fructose was transported into the hepatocytes is converted into glucose, which induces insulin resistance. The latter in turn increases the low energy index AMP/ATP, together with the adiponectin induced by Antrodan induces the conversion of AMPK into pAMPK. pAMPK increases the ratio NAD+/NADH and upregulates SIRT1. Working together with pAMPK, SIRT1 suppressed the insulin resistance and the level of TG, and the activity of FAS, ACC1 and malonyl-CoA biosynthesis, leading to enhanced CPT-1 and β-oxidation. All figures (12)