Antifatigue Effects of Antrodia cinnamomea Cultured Mycelium via Modulation of Oxidative Stress Signaling in a Mouse Model
Figures
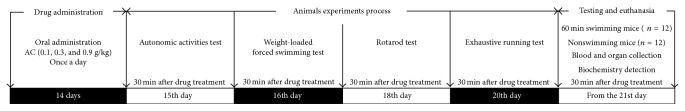
Figure 1
The experimental protocol and drug…
Figure 1
The experimental protocol and drug administration.
Figure 1 The experimental protocol and drug administration.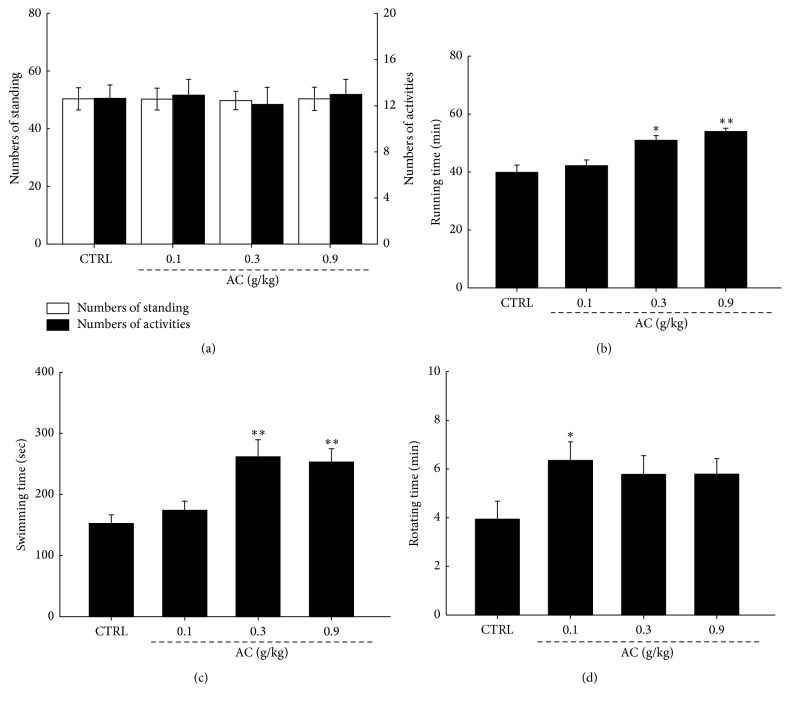
Figure 2
Three-week AC treatment brought no…
Figure 2
Three-week AC treatment brought no significant differences in movements (a) but significantly prolonged…
Figure 2 Three-week AC treatment brought no significant differences in movements (a) but significantly prolonged exhaustive time in (b) running, (c) swimming, and (d) rotating tests. The data were expressed as means ± SEM (n = 24) and analyzed using a one-way ANOVA. ∗P < 0.05 and ∗∗P < 0.01 in a comparison with the control mice.
Figure 3
Three-week AC treatment reduced the…
Figure 3
Three-week AC treatment reduced the activities of sera (a) ALT and (b) AST…
Figure 3 Three-week AC treatment reduced the activities of sera (a) ALT and (b) AST of mice with or without 60 min swimming. The data are expressed as means ± SEM (n = 12) and analyzed using a one-way ANOVA. ∗P < 0.05 in a comparison with the control mice without swimming; #P < 0.05 in a comparison with the control mice with 60 min swimming.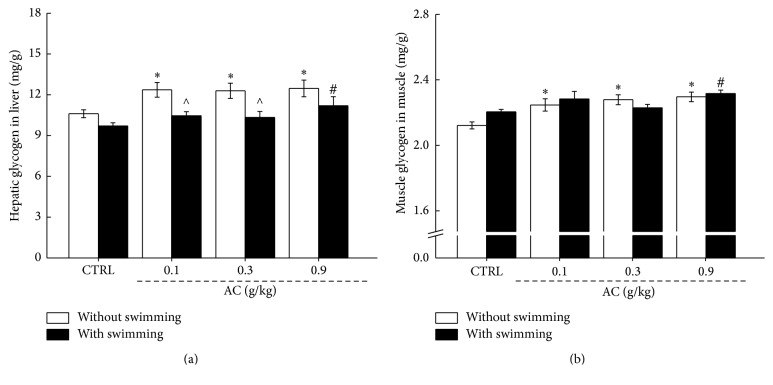
Figure 4
Three-week AC treatment enhanced the…
Figure 4
Three-week AC treatment enhanced the levels of (a) hepatic glycogen and (b) skeletal…
Figure 4 Three-week AC treatment enhanced the levels of (a) hepatic glycogen and (b) skeletal muscle glycogen of mice with or without 60 min swimming. The data are expressed as means ± SEM (n = 12) and analyzed using a one-way ANOVA. ∗P < 0.05 in a comparison with the control mice without swimming; #P < 0.05 in a comparison with the control mice with 60 min swimming; ∧P < 0.05 in a comparison between the same agent treated mice with and without 60 min swimming.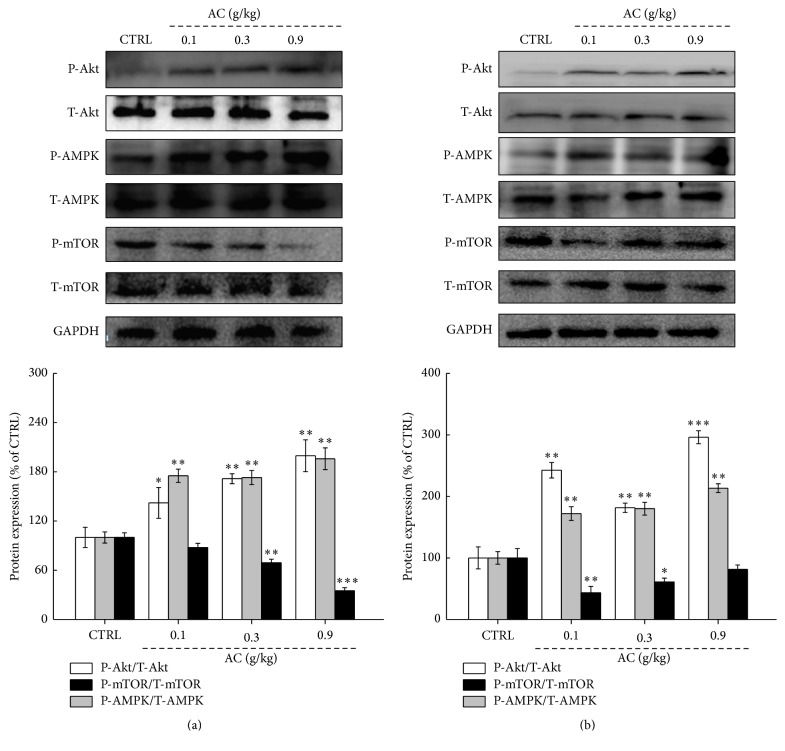
Figure 5
Three-week AC treatment upregulated the…
Figure 5
Three-week AC treatment upregulated the levels of phosphor-Akt and phosphor-AMPK and suppressed the…
Figure 5 Three-week AC treatment upregulated the levels of phosphor-Akt and phosphor-AMPK and suppressed the expression of phosphor-mTOR in (a) livers and (b) skeletal muscle of mice with 60 min swimming. The data on quantified protein expression were normalized to the expressions of GAPDH. The data are expressed as means ± SEM (n = 6) and analyzed using a one-way ANOVA ∗P < 0.05, ∗∗P < 0.01, and ∗∗∗P < 0.001 in a comparison with the control mice.