Antcins, triterpenoids from Antrodia cinnamomea, as new agonists for peroxisome proliferator-activated receptor α
Abstract
Peroxisome proliferator-activated receptor α (PPARα) is a nuclear hormone receptor that transcriptionally regulates lipid metabolism and inflammation; therefore, PPARα agonists are promising agents to treat dyslipidemia and metabolic disorders. PPARα full agonists, such as fibrates, are effective anti-hypertriglyceride agents, but their use is limited by adverse side effects. Hence, the aim of this study was to identify small molecules that can activate PPARα while minimizing the adverse effects. Antrodia cinnamomea, a rare medical mushroom, has been used widely in Asian countries for the treatment of various diseases, including liver diseases. Antcin B, H and K (antcins) and ergostatrien-3β-ol (EK100) are bioactive compounds isolated from A. cinnamomea with anti-inflammatory actions. Antcins, ergostane-type triterpenoids, contain the polar head with carboxylate group and the sterol-based body. Here, we showed at the first time that sterol-based compounds, antcins, but not EK100, activate PPARα in a cell-based transactivation study. The in silico docking studies presented several significant molecular interactions of antcins, including Tyr314, and His440 in the ligand-binding domain of PPARα, and these interactions are required for helix 12 (H12) stabilization. We propose that PPARα activation activity of antcins is related to their binding mode which requires conventional H12 stabilization, and that antcins can be developed as safe selective PPARα modulators.
Figures 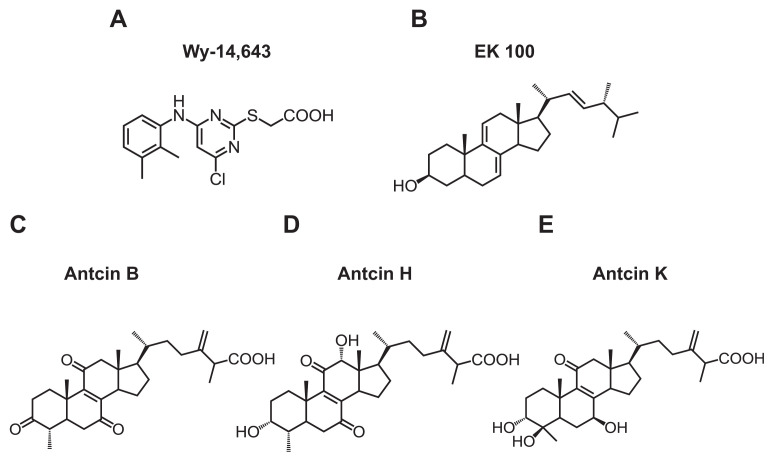
Fig. 1
Chemical structure of (A) Wy-14,643,…
Fig. 1
Chemical structure of (A) Wy-14,643, (B) EK100, (C) antcin B, (D) antcin H,…
Fig. 1 Chemical structure of (A) Wy-14,643, (B) EK100, (C) antcin B, (D) antcin H, and (E) antcin K.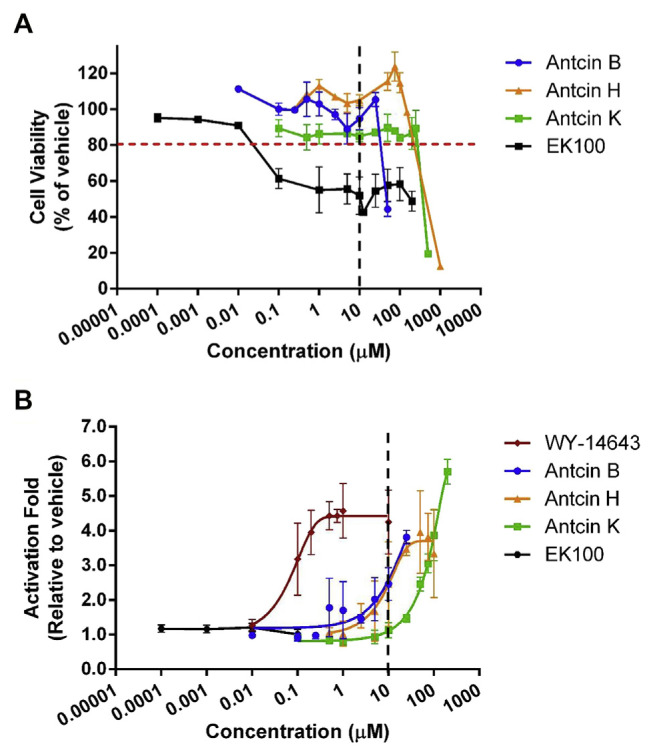
Fig. 2
Antcins are PPARα agonist. (A)…
Fig. 2
Antcins are PPARα agonist. (A) Cell viability and (B) PPARα transactivation by different…
Fig. 2 Antcins are PPARα agonist. (A) Cell viability and (B) PPARα transactivation by different concentrations of Wy-14,643, antcin B, H, and K, and EK100. The CHO–K1 cells were co-transfected with the plasmids encoding chimeric receptor constructs containing PPARα LBD and their cognate ALP reporters (see “Methods”). After transfection, cells were treated with vehicle (ethanol) or ligands with various concentrations. Data are means ± SD of at least three replicates.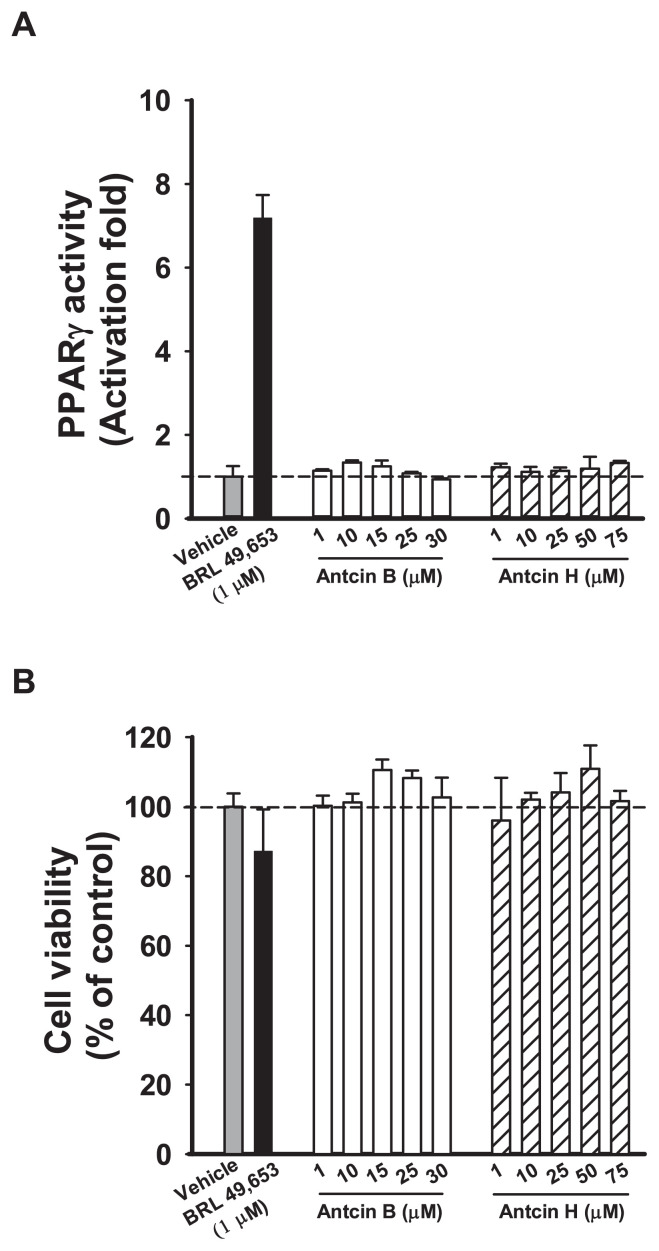
Fig. 3
Antcin B and H are…
Fig. 3
Antcin B and H are not PPARγ agonists. (A) PPARγ transactivation and (B)…
Fig. 3 Antcin B and H are not PPARγ agonists. (A) PPARγ transactivation and (B) Cell viability by different concentrations of antcin B and H. The CHO–K1 cells were co-transfected with the plasmids encoding chimeric receptor constructs containing PPARγ LBD and their cognate ALP reporters (see “ Methods”). After transfection, cells were treated with vehicle (ethanol) or ligands with various concentrations. Data are means ± SD of at least three replicates.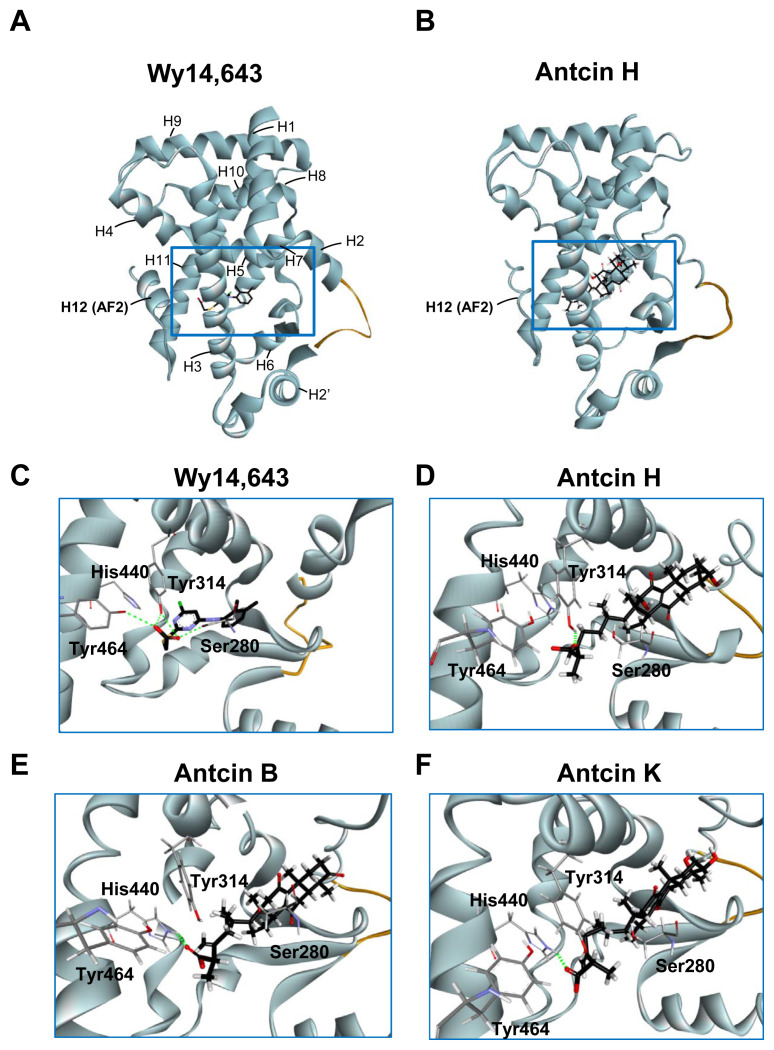
Fig. 4
Three-dimensional structures of PPARα-LBD stabilized…
Fig. 4
Three-dimensional structures of PPARα-LBD stabilized by the ligands. (A, B) Overall structure of…
Fig. 4 Three-dimensional structures of PPARα-LBD stabilized by the ligands. (A, B) Overall structure of Wy-14,643 (A) and antcin H (B) bound with PPARα in ribbon representation. The bound ligands are shown in stick representation. The H12 (AF2) helix is labeled. Missing residues in the H2–H2′ loop are depicted as an orange curve. (C–F) Close-up view of the Wy-14,643 (C), antcin H (D), antcin B (E), and antcin K (F) at the binding site of PPARα showing the interacting residues. Ligands are shown as black sticks, and receptor residues are shown as grey sticks. The bound ligands and receptor residues are shown in stick representation with oxygen, nitrogen, chloride, sulfur and hydrogen atoms depicted in red, blue, green, yellow, and white, respectively. Hydrogen bonds are shown as dotted green lines.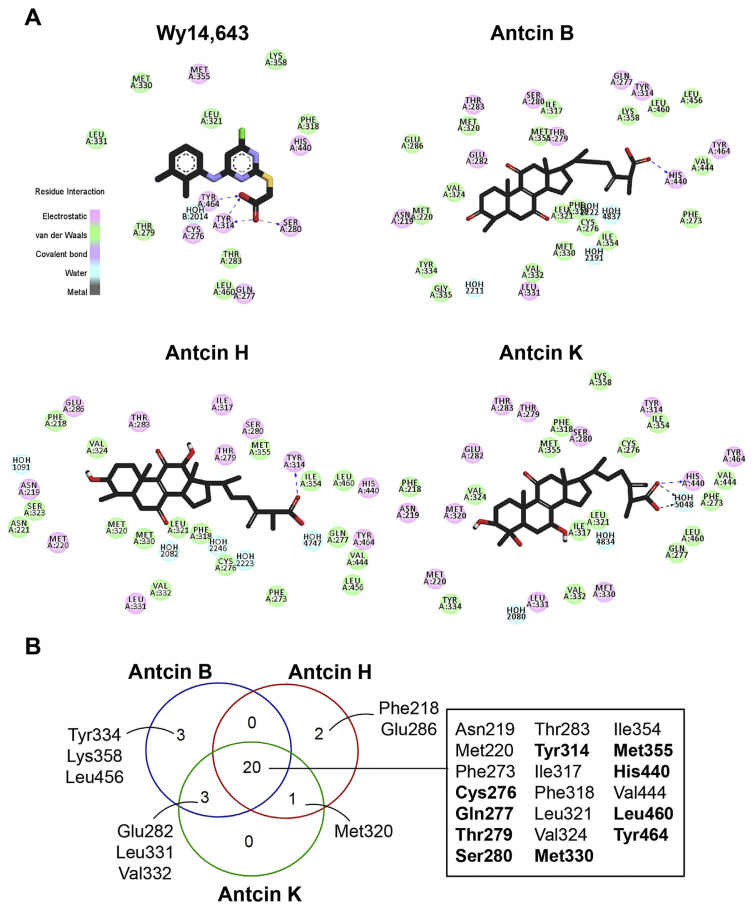
Fig. 5
Major interactions established by key…
Fig. 5
Major interactions established by key residues were identified using docking analysis. (A) Two-dimensional…
Fig. 5 Major interactions established by key residues were identified using docking analysis. (A) Two-dimensional interaction diagram of the predicted binding mode of the ligands (Wy-14,643, antcin B, H, and K), PPARα, and bound water molecules (blue). Ligands are shown as black sticks with oxygen, nitrogen, chloride, sulfur and hydrogen atoms depicted in red, blue, green, yellow, and white, respectively. Hydrophobic and electrostatic interactions are indicated in green and pick, respectively. Hydrogen bonds are shown as dashed blue lines. (B) Venn diagram showing the overlapping numbers of key residues by antcin B, H and K. Twenty residues shared by antcins were listed in the box, and ten of them commonly interacted by Wy-14,643 were highlighted in bold.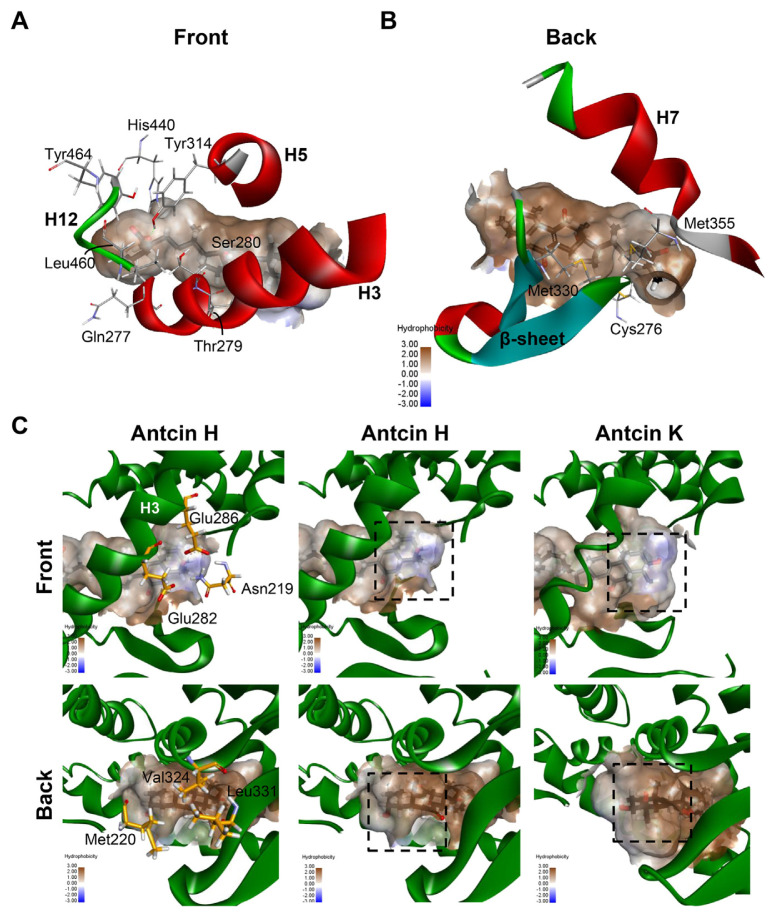
Fig. 6
Maps of the hydrophobicity at…
Fig. 6
Maps of the hydrophobicity at the binding site of PPARα docked with the…
Fig. 6 Maps of the hydrophobicity at the binding site of PPARα docked with the antcin H and K. (A, B) Ten residues shared by antcins and Wy-14,643 are showed as grey sticks. The bound ligands are shown as black sticks. H3, H5 and H7 of PPARα are shown in ribbon representation. (C) Maps of the hydrophobicity at the binding site of PPARα docked with the antcin H and K. Ligands and receptor residues surrounding ring A of antcins are shown as black and yellow sticks, respectively. Regions surrounding ring A are highlighted in dotted rectangles.