The functional influences of common ABCB1 genetic variants on the inhibition of P-glycoprotein by Antrodia cinnamomea extracts
Figures
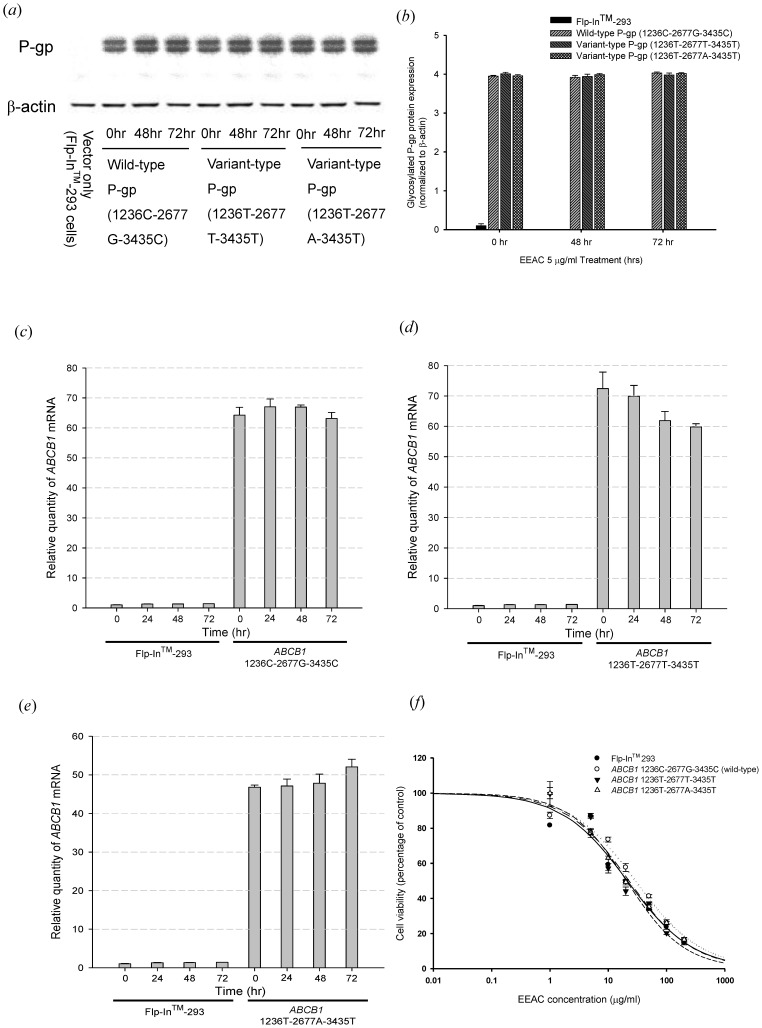
Figure 1. Effect of EEAC on P-gp…
Figure 1. Effect of EEAC on P-gp mRNA and protein expression level.
( a )(…
Figure 1. Effect of EEAC on P-gp mRNA and protein expression level. (a)(b) Western blot of P-gp expression with C219 monoclonal antibody (2 µg protein/lane). The upper one was the mature fully glycosylated (∼170 kD) and the lower one was the immature P-gp (∼150 kD). The expression of β-actin was used as loading control. Treatment of EEAC 5 µg/mL for 48 and 72 hours demonstrated no effect on P-gp protein expression. (c)(d)(e) Analysis of mRNA levels with real-time quantitative RT-PCR. There were no significant ABCB1 mRNA expression differences after treating the P-gp expressed cells with 5 µg/ml EEAC for 24, 48 and 72 hours. (f) Cytotoxicity study of EEAC by MTT assay. The IC50 of EEAC for Flp-In™ 293, ABCB1 1236C-2677G-3435C (wild-type), ABCB1 1236T-2677T-3435T and ABCB1 1236T-2677A-3435T were 21.27, 29.31, 20.60 and 22.74 µg/ml, respectively. There was no significant difference among the IC50. Data were presented as mean ± SE of at least three experiments, each in triplicate.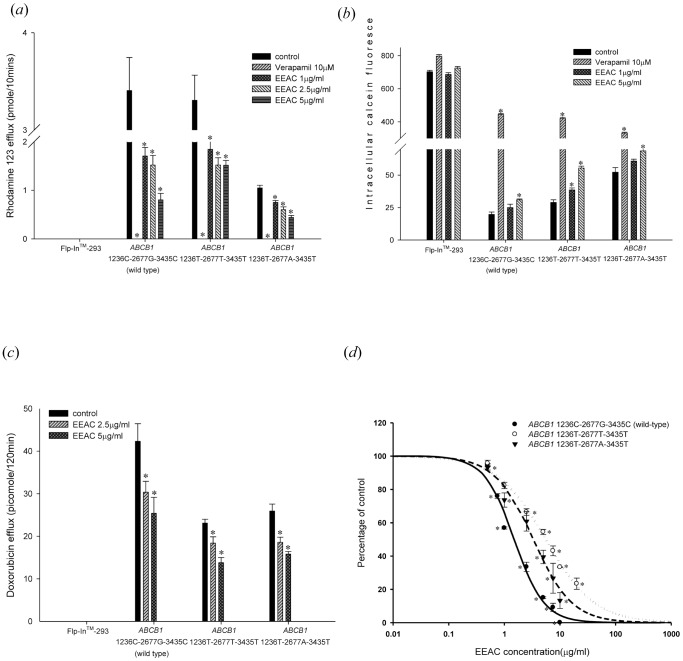
Figure 2. Evaluation of influences of EEAC…
Figure 2. Evaluation of influences of EEAC on P-glycoprotein efflux function.
( a ) Rhodamine…
Figure 2. Evaluation of influences of EEAC on P-glycoprotein efflux function. (a) Rhodamine 123 efflux assay: EEAC inhibited P-gp mediated efflux of rhodamine 123 in a concentration dependent manner. Verapamil 10 µM was used as a positive control. EEAC significantly inhibited rhodamine 123 efflux in wild-type P-gp, as well as the two variant-types P-gp. *p<0.05 as compared to rhodamine 123 efflux without EEAC (control). (b) Calcein-AM uptake assay: EEAC increased intracellular accumulation of calcein in a dose dependent manner in wild-type P-gp, as well as the two variant-types P-gp. Verapamil 10 µM was used as a positive control. *p<0.05 as compared to calcein-AM uptake without EEAC (control). (c) Doxorubicin (10 µM) efflux assay: EEAC inhibited P-gp mediated efflux of doxorubicin in a concentration dependent manner. EEAC significantly inhibited doxorubicin efflux in wild-type P-gp, as well as the two variant-types P-gp. *p<0.05 as compared to doxorubicin efflux without EEAC (control). (d) The IC50 of the inhibitory effect of EEAC on rhodamine 123 efflux by ABCB1 1236C-2677G-3435C (wild type), ABCB1 1236T-2677T-3435T and ABCB1 1236T-2677A-3435T were 1.51, 5.56 and 3.33 µg/ml, respectively, indicating the inhibitory effect of EEAC on rhodamine 123 efflux by wild-type P-gp was the most potent. Above data were presented as mean ± SE of at least three experiments, each in triplicate. *p<0.05 as compared to rhodamine 123 efflux without EEAC (control).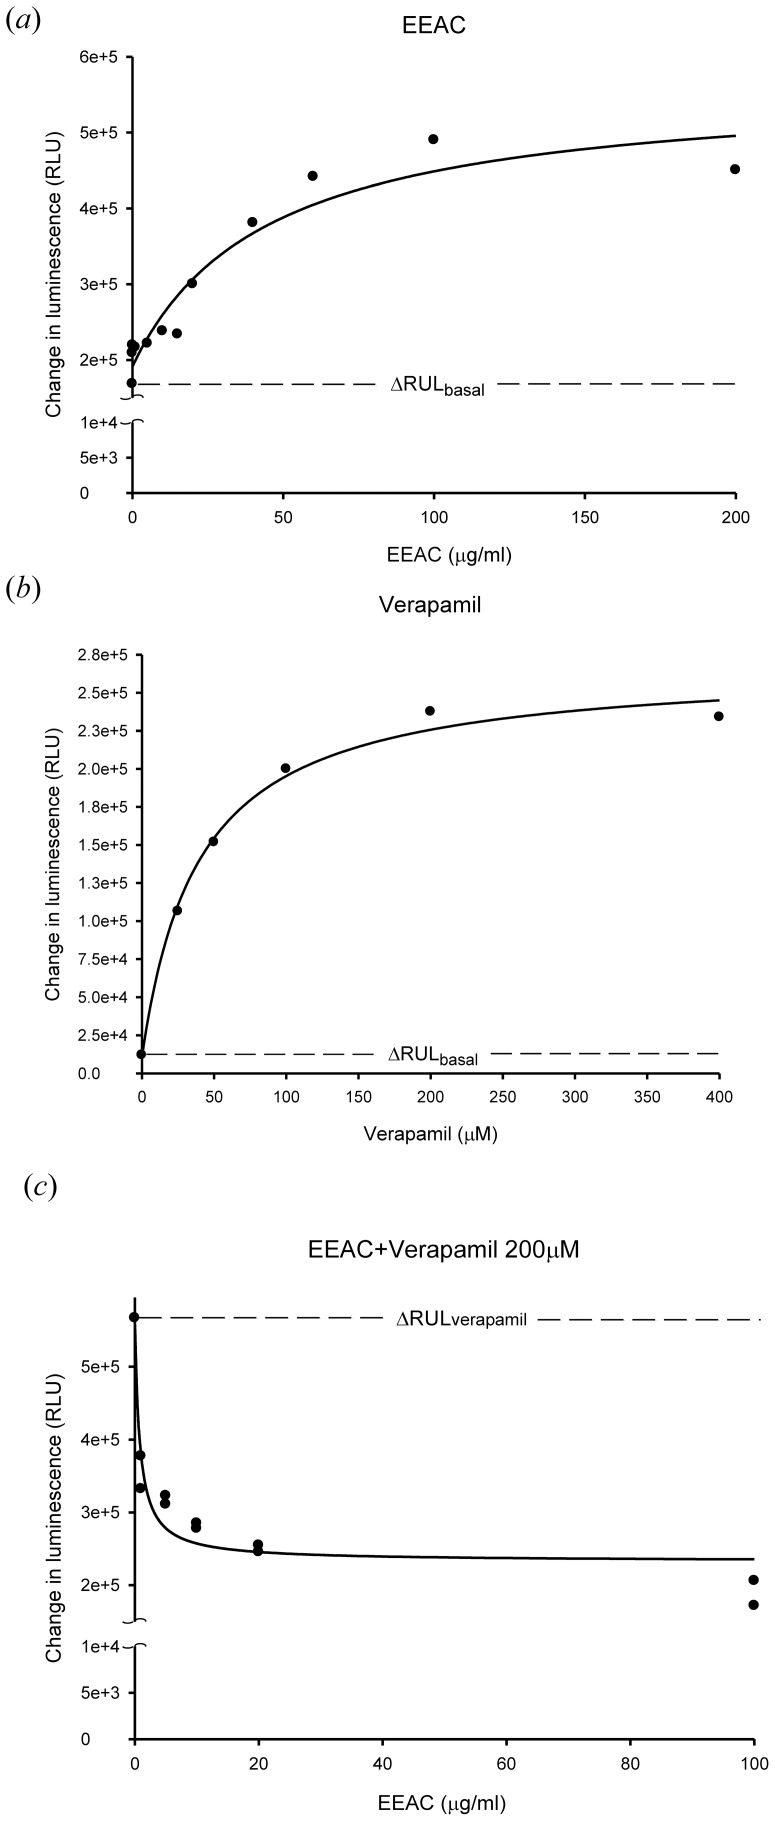
Figure 3. Effect of EEAC on P-glycoprotein…
Figure 3. Effect of EEAC on P-glycoprotein ATPase activity.
( a ) Incubation with EEAC…
Figure 3. Effect of EEAC on P-glycoprotein ATPase activity. (a) Incubation with EEAC (0.01–200 µg/ml) stimulated the P-gp ATPase activity. Data were analyzed in terms of RLUs. (b) Verapamil (25–400 µM) showed its capacity to stimulate P-gp ATPase activity. (c) EEAC (1–100 µg/ml) was tested for its capacity to inhibit 200 µM verapamil-stimulated P-gp ATPase activity. Above results indicated that EEAC stimulated the P-gp ATPase activity and inhibited 200 µM verapamil-stimulated P-gp ATPase activity at concentration 5 µg/ml.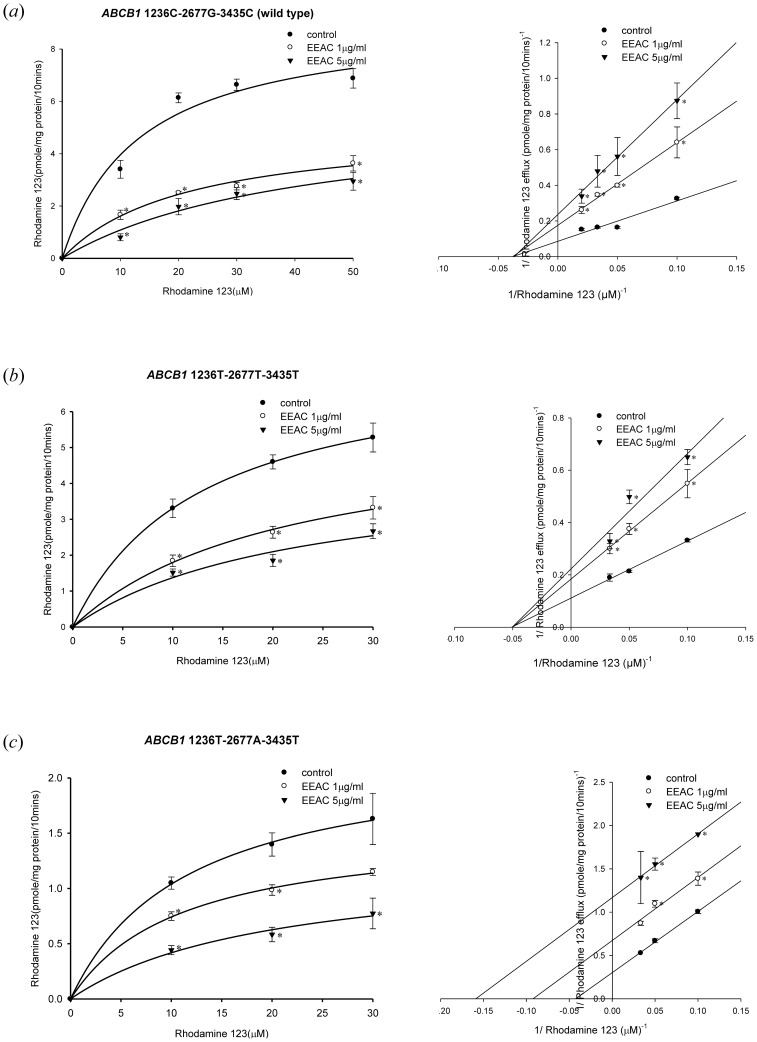
Figure 4. Concentration-dependent rhodamine 123 efflux (10–30…
Figure 4. Concentration-dependent rhodamine 123 efflux (10–30 µM) in the presence or absence of EEAC.
Figure 4. Concentration-dependent rhodamine 123 efflux (10–30 µM) in the presence or absence of EEAC. The left panels showed the nonlinear regression analysis of rhodamine 123 efflux and the right panels demonstrated the Lineweaver-Burk plot analysis of rhodamine 123 efflux. (a) Wild-type P-gp (1236C-2677G-3435C). (b) Variant-type P-gp (1236T-2677T-3435T). (c) Variant-type P-gp (1236T-2677A-3435T). Data were presented as mean ± SE of at least three experiments, each in triplicate. *p<0.05 as compared to rhodamine 123 efflux without EEAC (control).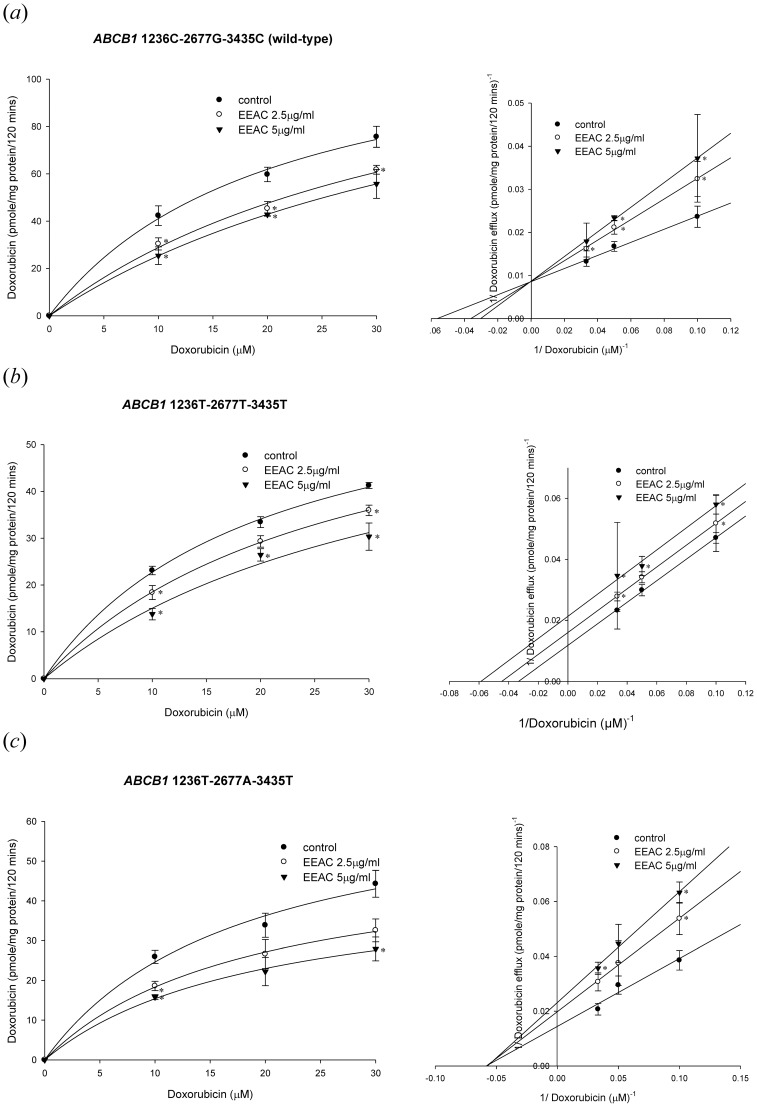
Figure 5. Concentration-dependent doxorubicin efflux (10–30 µM)…
Figure 5. Concentration-dependent doxorubicin efflux (10–30 µM) in the presence or absence of EEAC.
The…
Figure 5. Concentration-dependent doxorubicin efflux (10–30 µM) in the presence or absence of EEAC. The left panels showed the nonlinear regression analysis of doxorubicin efflux and the right panels demonstrated the Lineweaver-Burk plot analysis of doxorubicin efflux. (a) Wild-type P-gp (1236C-2677G-3435C). (b) Variant-type P-gp (1236T-2677T-3435T). (c) Variant-type P-gp (1236T-2677A-3435T). Data were presented as mean ± SE of at least three experiments, each in triplicate. *p<0.05 as compared to doxorubicin efflux without EEAC (control).