The Ethanolic Extract of Taiwanofungus camphoratus (Antrodia camphorata) Induces Cell Cycle Arrest and Enhances Cytotoxicity of Cisplatin and Doxorubicin on Human Hepatocellular Carcinoma Cells
Figures
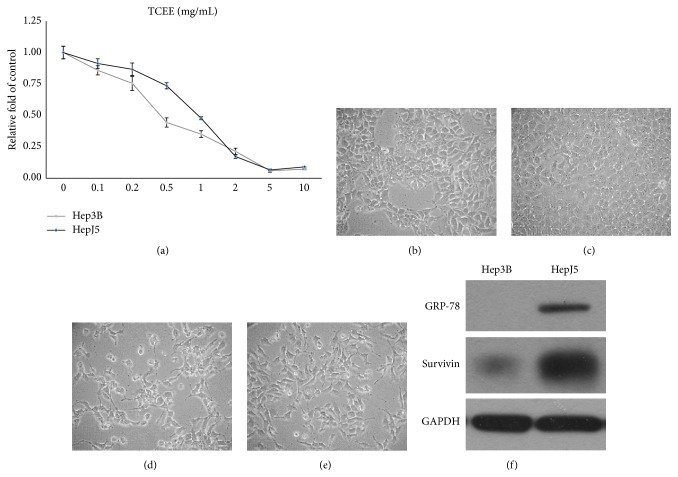
Figure 1
Cell growth inhibition of TCEE…
Figure 1
Cell growth inhibition of TCEE on human hepatocellular carcinoma cells, Hep3B and HepJ5.…
Figure 1 Cell growth inhibition of TCEE on human hepatocellular carcinoma cells, Hep3B and HepJ5. (a) Hep3B (gray line) and HepJ5 (black line) cells were treated with 0 to 10 mg/mL TCEE for 48 hr, and the cell viability was determined by MTT assay. IC50 of TCEE is 0.48 mg/mL on Hep3B cells and 0.91 mg/mL on HepJ5 cells, respectively. Experiments were repeated in triplicate and presented data were mean plus standard deviation. ((b) to (e)) Morphological observation on Hep3B and HepJ5 cells treated with 0 mg/mL TCEE ((b) and (c) Hep3B and HepJ5, resp.) or 0.5 to 1.0 mg/mL TCEE for 48 hr ((d) and (e) Hep3B and HepJ5, resp.). TCEE treated cells demonstrated apoptotic-like morphological changes such as cell shrinkage and cell blebbing compared with cells treated with normal culture medium. Magnification = 100x. (f) Expressions of survivin and GRP-78 on Hep3B and HepJ5 cells were determined by western blotting analysis. HepJ5 cells demonstrated higher expression of both survivin and GRP-78 than Hep3B cells. GAPDH served as the internal control.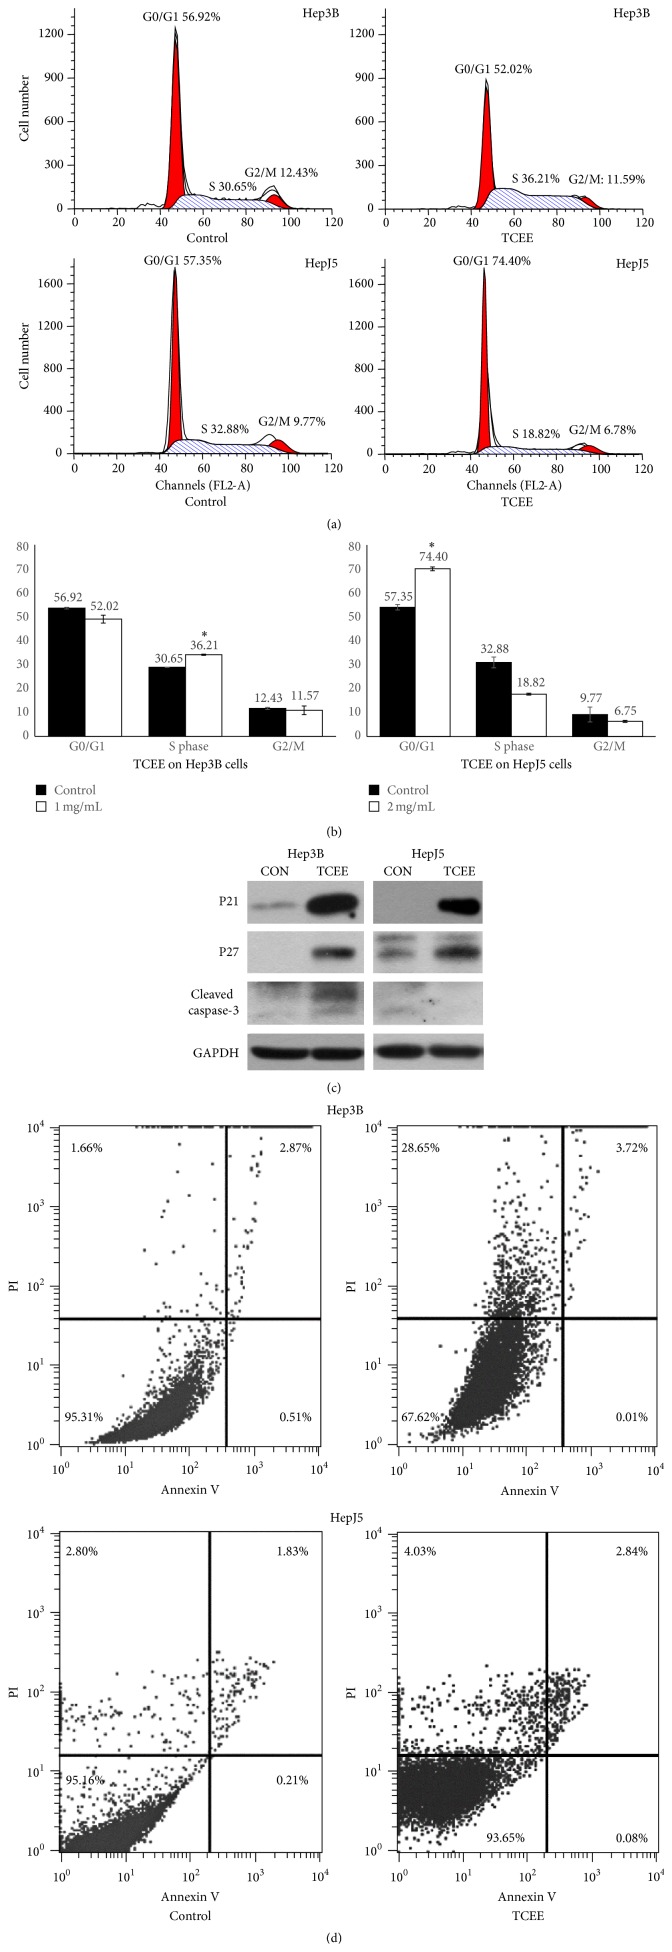
Figure 2
TCEE induced cell cycle arrest…
Figure 2
TCEE induced cell cycle arrest and activation of caspase-3. (a) The cell cycle…
Figure 2 TCEE induced cell cycle arrest and activation of caspase-3. (a) The cell cycle distribution was analyzed by FACS using PI staining on Hep3B and HepJ5 cells which were treated with 1 or 2 mg/mL TCEE for 24 hr. (b) Bar charts for the comparison of control or TCEE treated cells. Data were presented as mean plus standard deviation. ∗ indicated statistical significance compared with the control group (P < 0.05 by Student's t-test). (c) Expressions of P21 and P27 and cleaved caspase-3 on Hep3B and HepJ5 cells with 0.5 or 1.0 mg/mL TCEE treatment for 48 hr were determined by western blotting analysis. GAPDH was used as the normalization control. The semiquantitative data were shown in Table 2. (d) Cell apoptosis was analyzed by the FACS analysis using the double-staining of PI and FITC-labelled annexin V on Hep3B and HepJ5 cells which were treated with 1 or 2 mg/mL TCEE for 24 hr.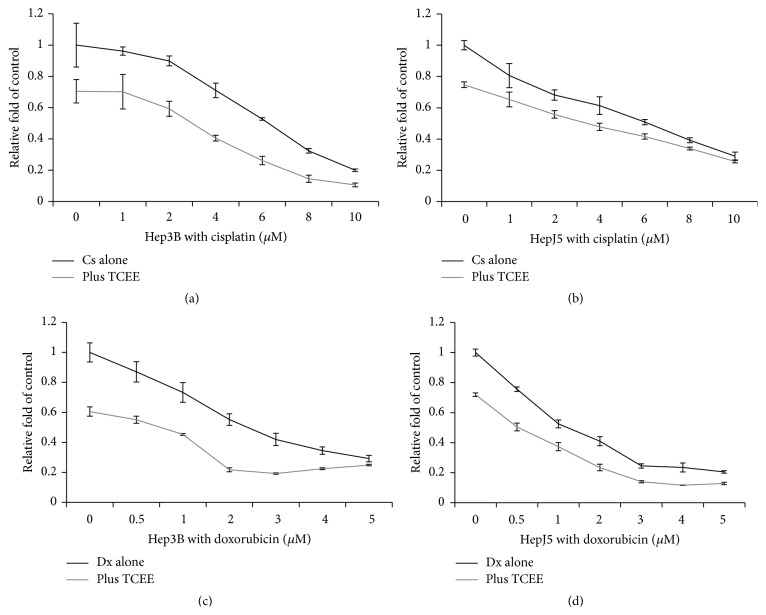
Figure 3
The cell growth inhibition of…
Figure 3
The cell growth inhibition of cisplatin or doxorubicin with TCEE treatment on Hep3B…
Figure 3 The cell growth inhibition of cisplatin or doxorubicin with TCEE treatment on Hep3B and HepJ5 cells. Hep3B and HepJ5 cells were treated with 0 to 10 μM cisplatin or 0 to 5 μM doxorubicin in combination with 0 (black line) or 0.2 to 0.5 mg/mL (gray line) TCEE, respectively, for 48 hr. Cell viability was determined by MTT assay. Experiments were triplicated and data were presented as mean plus standard deviation. Data were presented as mean plus standard deviation.