The in vitro and in vivo depigmentation activity of coenzyme Q0, a major quinone derivative from Antrodia camphorata, through autophagy induction in human melanocytes and keratinocytes
Abstract
Figures 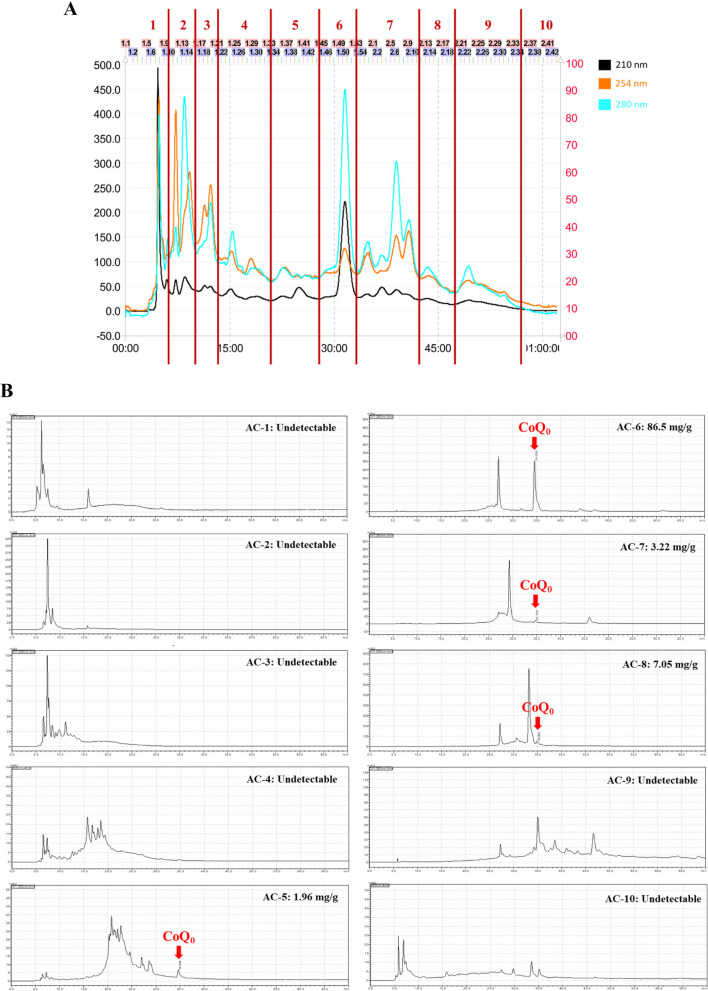
Fig. 1
CoQ 0 isolation from Antrodia…
Fig. 1
CoQ 0 isolation from Antrodia camphorata by MPLC and HPLC analysis. A Antrodia…
Fig. 1 CoQ0 isolation from Antrodia camphorata by MPLC and HPLC analysis. AAntrodia camphorata was eluted by a mobile phase consisting of water and methanol by using an RP-18 MPLC glass column. B Ten fractions (AC-1 to AC-10) were ascertained by using an RP-C18 HPLC column. A series of standard solutions (CoQ0) were created by diluting the stock solution, and they were utilized to calculate the CoQ0 concentration of the AC-1 to AC-10 fractions. The final CoQ0 product was dissolved in 0.1% DMSO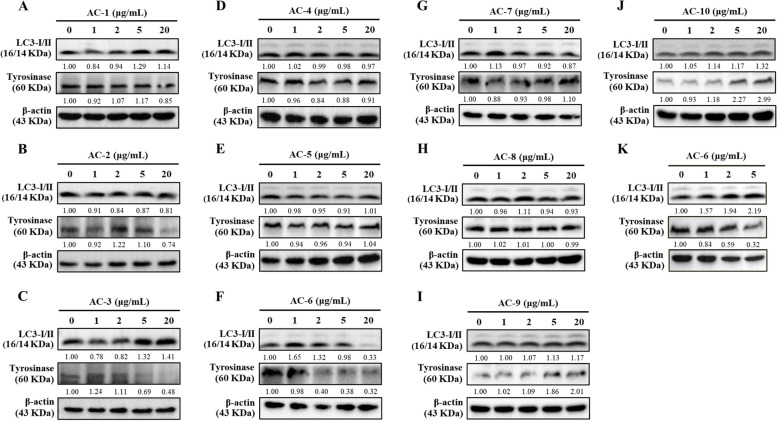
Fig. 2
AC-6 upregulated LC3-I/II and inhibited…
Fig. 2
AC-6 upregulated LC3-I/II and inhibited tyrosinase expression in melanoma B16F10 cells. A-K B16F10…
Fig. 2 AC-6 upregulated LC3-I/II and inhibited tyrosinase expression in melanoma B16F10 cells. A-K B16F10 cells were treated with AC-1 to AC-10 (0-20 μg/mL) or AC-6 (0-5 μg/mL) for 24 h. The expression of LC3-I/II and tyrosinase was evaluated by immunoblotting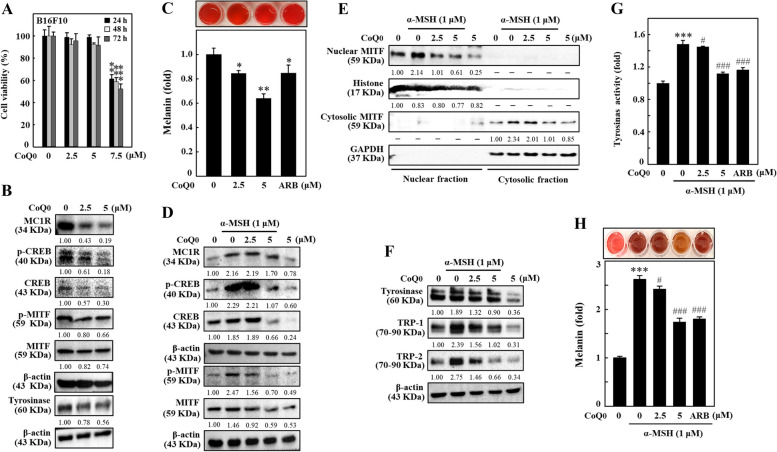
Fig. 3
CoQ 0 suppressed melanogenesis in…
Fig. 3
CoQ 0 suppressed melanogenesis in α-MSH-stimulated B16F10 cells. A Cells were incubated with…
Fig. 3 CoQ0 suppressed melanogenesis in α-MSH-stimulated B16F10 cells. A Cells were incubated with CoQ0 (0-7.5 μM) for 24, 48, or 72 h, and an MTT assay was conducted to determine cell viability. B Cells were treated with CoQ0 (0-5 μM) for the indicated durations, and the levels of MC1R (5 min), p-CREB (1.5 h), CREB (1.5 h), p-MITF (4 h), MITF (4 h), and tyrosinase (24 h) were measured using immunoblotting. C Cells were treated with CoQ0 (0-5 μM, 72 h), and melanin formation was determined as described in the Methods section. D, F Cells were first treated with CoQ0 (0-5 μM), followed by stimulation with α-MSH (1 μM) for the indicated time to measure (D) MC1R (5 min), p-CREB (1.5 h), CREB (1.5 h), p-MITF (4 h), and MITF (4 h) levels; (E) nuclear and cytosolic MITF (4 h) levels; and (F) tyrosinase (24 h), TRP-1 (24 h), and TRP-2 (24 h) levels using immunoblotting. G, H Tyrosinase activity was determined after 24 h, and melanin levels were measured after 72 h, as described in the Methods section. Arbutin (ARB, 200 μM) was used as a positive control. The results are the mean ± SD (n=3). *p < 0.05; **p< 0.01; ***p < 0.001 compared with untreated cells. #p < 0.05; ###p < 0.001 compared with CoQ0-treated cells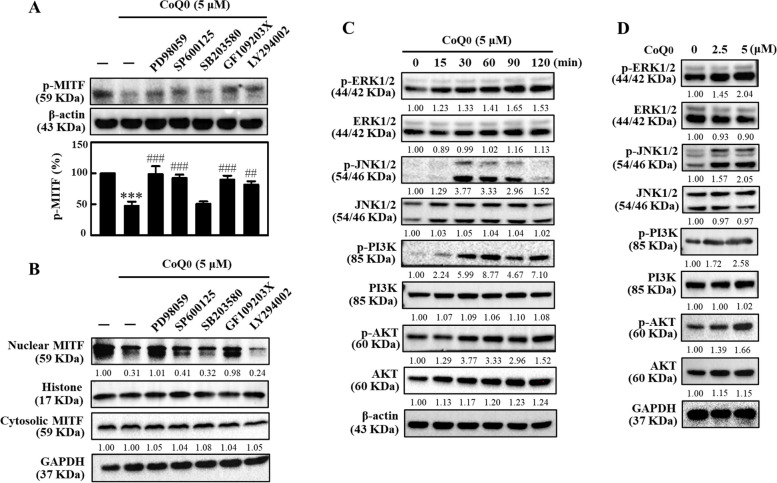
Fig. 4
CoQ 0 suppressed MITF nuclear…
Fig. 4
CoQ 0 suppressed MITF nuclear translocation in B16F10 cells through the ERK, JNK,…
Fig. 4 CoQ0 suppressed MITF nuclear translocation in B16F10 cells through the ERK, JNK, and PI3K/AKT signaling pathways. A, B Cells were first treated with inhibitors of ERK (PD98059, 30 μM), JNK (SP600125, 25 μM), p38 (SB203580, 20 μM), PKC (GF109203X, 2.5 μM), or PI3K/AKT (LY294002, 30 μM) for 1 h followed by CoQ0 (5 μM, 4 h). Levels of p-MITF, and nuclear/cytosolic MITF were determined using immunoblotting. C Cells were treated with CoQ0 (5 μM, 0-120 min). An immunoblotting assay was performed to determine the levels of the p-ERK1/2, ERK1/2, p-JNK1/2, JNK1/2, p-PI3K, PI3K, p-AKT, and AKT proteins. D Cells were treated with CoQ0 (0-5 μM) for the indicated time, and immunoblotting was performed to determine the levels of the p-ERK1/2 (90 min), ERK1/2 (90 min), p-JNK1/2 (30 min), JNK1/2 (30 min), p-PI3K (60 min), PI3K (60 min), p-AKT (60 min), and AKT (60 min) proteins. The results are the mean ± SD (n=3). ***p < 0.001 compared with untreated cells. ###p < 0.001 compared with CoQ0-treated cells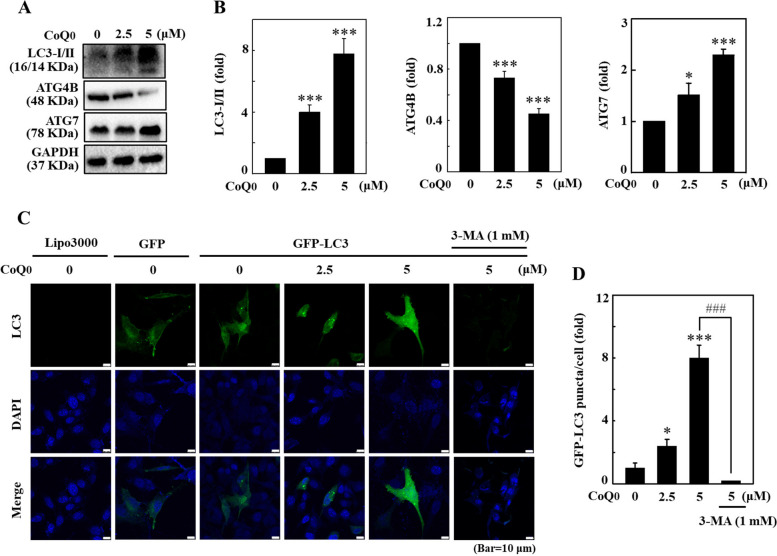
Fig. 5
CoQ 0 induced autophagic flux…
Fig. 5
CoQ 0 induced autophagic flux in B16F10 cells. A , B Cells were…
Fig. 5 CoQ0 induced autophagic flux in B16F10 cells. A, B Cells were treated with CoQ0 (0-5 μM, 24 h). After incubation, the cells were subjected to an immunoblotting assay to determine LC3-I/II, ATG4B, and ATG7 protein levels. C, D The GFP-LC3 expression vector was transfected into the cells, followed by treatment with CoQ0 (0-5 μM, 24 h). GFP-LC3 puncta induced by CoQ0 were observed using a confocal microscope. The quantification of cells developing GFP-LC3 puncta is presented in a histogram. The results are the mean ± SD (n=3). *p < 0.05; ***p < 0.001 compared with untreated cells. ###p < 0.001 compared with CoQ0-treated cells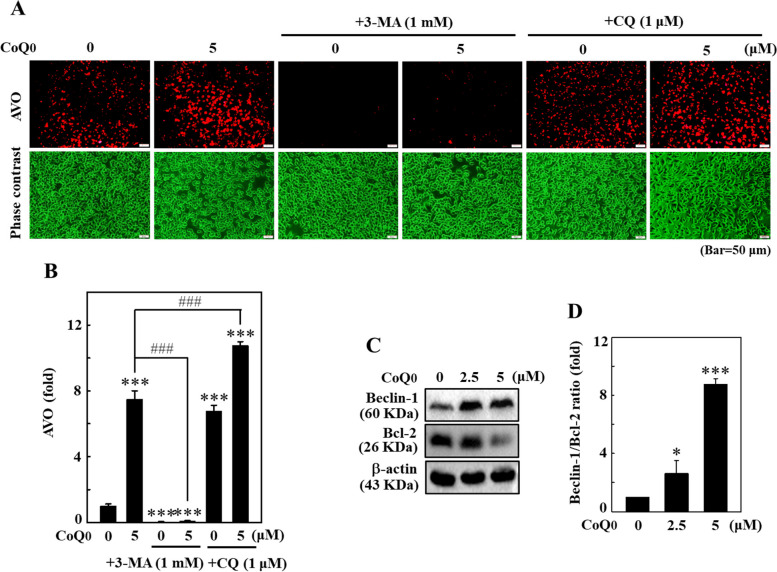
Fig. 6
CoQ 0 increased AVO formation…
Fig. 6
CoQ 0 increased AVO formation and dysregulated the Beclin-1/Bcl-2 ratio in B16F10 cells.…
Fig. 6 CoQ0 increased AVO formation and dysregulated the Beclin-1/Bcl-2 ratio in B16F10 cells. A, B Cells were first treated with 3-MA (1 mM, 1 h) or CQ (1 μM, 1 h) and then with CoQ0 (0 or 5 μM, 24 h). A fluorescence microscope was used to visualize the formation of intracellular AVOs (under a red filter). The intensity of red fluorescence is proportional to the AVO number. C, D Cells were treated with CoQ0 (0-5 μM, 24 h). The immunoblotting assay was performed to determine Beclin-1 and Bcl-2 protein levels, and the data are presented as the ratio of Beclin-1/Bcl-2. The results are the mean ± SD (n=3). *p < 0.05; ***p < 0.001 compared with untreated cells. ###p < 0.001 compared with CoQ0-treated cells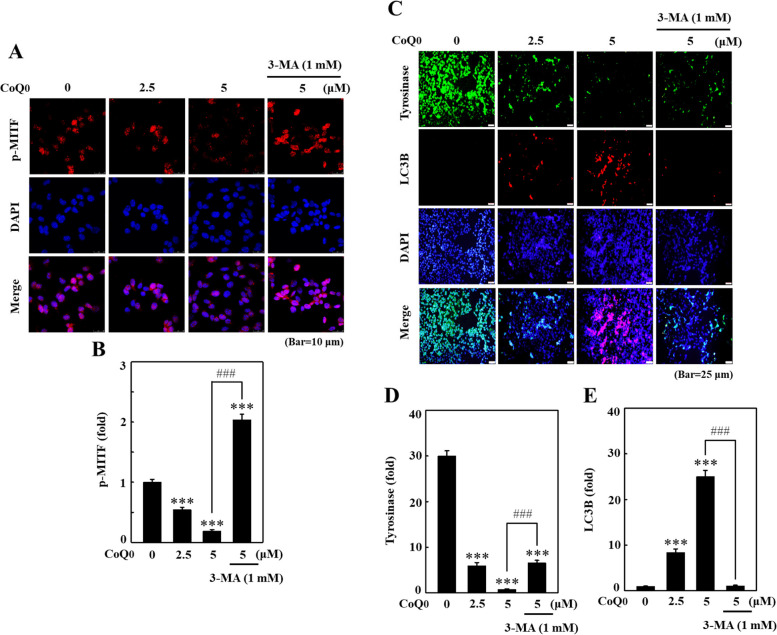
Fig. 7
CoQ 0 suppressed p-MITF and…
Fig. 7
CoQ 0 suppressed p-MITF and tyrosinase expression through autophagy in B16F10 cells. Cells…
Fig. 7 CoQ0 suppressed p-MITF and tyrosinase expression through autophagy in B16F10 cells. Cells were pretreated with or without 3-MA (1 mM, 1 h), followed by CoQ0 (0-5 μM) for 4 h (A, B) or 24 h (C, E). At the end of the treatment, the p-MITF (A, B), tyrosinase, and LC3B (C, E) levels were measured using immunofluorescence staining. The results are the mean ± SD (n=3). ***p < 0.001 compared with untreated cells. ###p < 0.001 compared with CoQ0-treated cells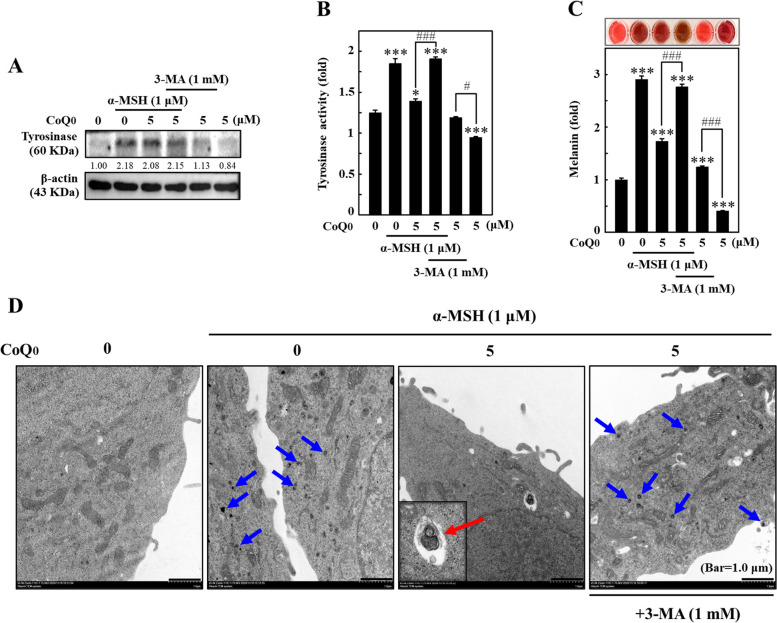
Fig. 8
CoQ 0 inhibited melanogenesis by…
Fig. 8
CoQ 0 inhibited melanogenesis by inducing autophagy in α‐MSH-stimulated B16F10 cells. A-C Cells…
Fig. 8 CoQ0 inhibited melanogenesis by inducing autophagy in α‐MSH-stimulated B16F10 cells. A-C Cells were treated with CoQ0 (0 or 5 μM) in the absence or presence of 3-MA (1 mM, 1 h) followed by stimulation with α‐MSH (1 μM) for 24 h (A, B) or 72 h (C). A An immunoblotting assay was applied to measure the tyrosinase expression. B Tyrosinase enzyme activity was measured as described in Materials and Methods. C Intracellular melanin levels were quantified. The results are the mean ± SD (n=3). *p < 0.05; ***p < 0.001 compared with untreated cells. #p < 0.05; ###p < 0.001 compared with CoQ0-treated cells. D Cells were treated with or without 3-MA (1 mM, 1 h) followed by treatment with CoQ0 (0 or 5 μM) and stimulation with α‐MSH (1 μM, 24 h). Melanosome-engulfing autophagosomes within cells were observed under TEM. The blue and red arrows indicate melanosome-engulfing autophagosomes, and autolysosomes formation, respectively.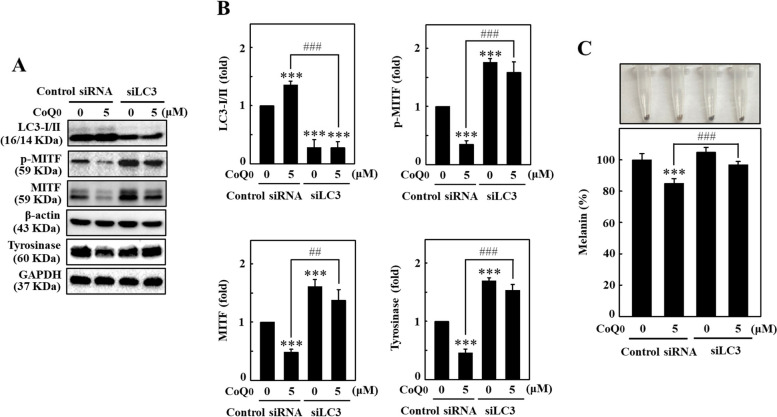
Fig. 9
Silencing LC3 diminished CoQ 0…
Fig. 9
Silencing LC3 diminished CoQ 0 -induced antimelanogenesis in B16F10 cells. A , B…
Fig. 9 Silencing LC3 diminished CoQ0-induced antimelanogenesis in B16F10 cells. A, B Cells transfected with the control siRNA and siLC3 were treated with CoQ0 (0 or 5 μM) for the indicated duration to determine the levels of LC3B (24 h), p-MITF (4 h), MITF (4 h), and tyrosinase (24 h) proteins. The proteins were extracted after various treatments and subjected to immunoblotting. C Transfected B16F10 cells were treated with CoQ0 (0 or 5 μM, 24 h), followed by the measurement of intracellular melanin levels. The results are the mean ± SD (n=3). **p < 0.01; ***p < 0.001 compared with untreated siRNA-transfected cells. ##p < 0.01; ###p < 0.001 compared with CoQ0-treated siRNA-transfected cells.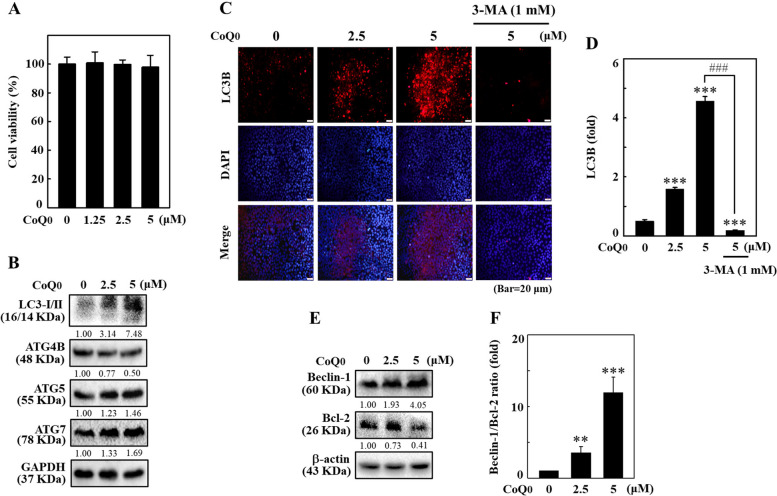
Fig. 10
CoQ 0 modulated autophagy-associated proteins…
Fig. 10
CoQ 0 modulated autophagy-associated proteins in HaCaT cells. Cells were treated with CoQ…
Fig. 10 CoQ0 modulated autophagy-associated proteins in HaCaT cells. Cells were treated with CoQ0 (0-5 μM, 24 h). A Cell viability was examined by MTT assay. B Cells were subjected to immunoblotting to determine LC3-I/II, ATG4B, ATG5, and ATG7 protein levels. C, D Cells were first treated with or without 3-MA (1 mM, 1 h) followed by treatment with CoQ0 (0-5 μM, 24 h). Immunofluorescence staining was performed to determine LC3B levels. E, F Cells were treated with CoQ0 (0-5 μM, 24 h) and then subjected to immunoblotting to determine Beclin-1 and Bcl-2 protein levels. Data are presented as the Beclin-1/Bcl-2 ratio. The results are the mean ± SD (n=3). **p < 0.01; ***p < 0.001 compared with untreated cells. ###p < 0.001 compared with CoQ0-treated cells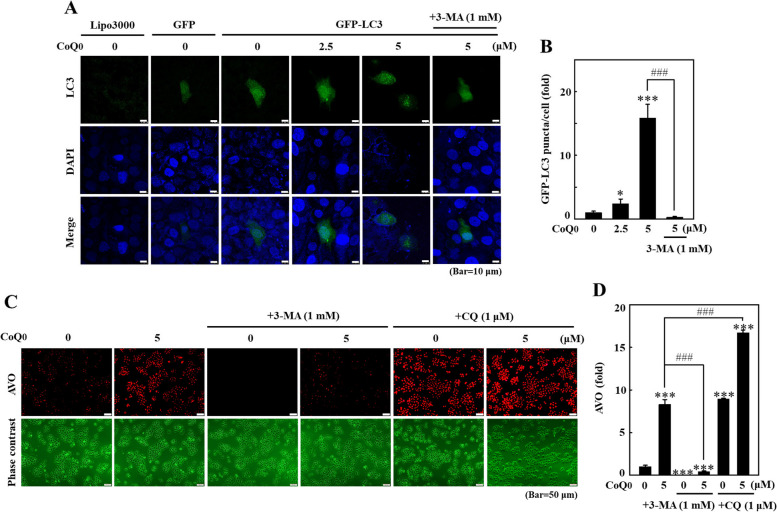
Fig. 11
CoQ 0 induced autophagy flux…
Fig. 11
CoQ 0 induced autophagy flux in HaCaT cells. Cells were first treated with…
Fig. 11 CoQ0 induced autophagy flux in HaCaT cells. Cells were first treated with or without 3-MA (1 mM, 1 h) and/or CQ (1 μM, 1 h) followed by CoQ0 (0-5 μM, 24 h). A, B Cells were transfected with the GFP-LC3 expression vector, and the formation of GFP-LC3 puncta induced by CoQ0 was observed under a confocal microscope. C, D Intracellular AVO formation in cells was observed under a fluorescence microscope. The results are the mean ± SD (n=3). *p < 0.05; ***p < 0.001 compared with untreated cells. ###p < 0.001 compared with CoQ0-treated cells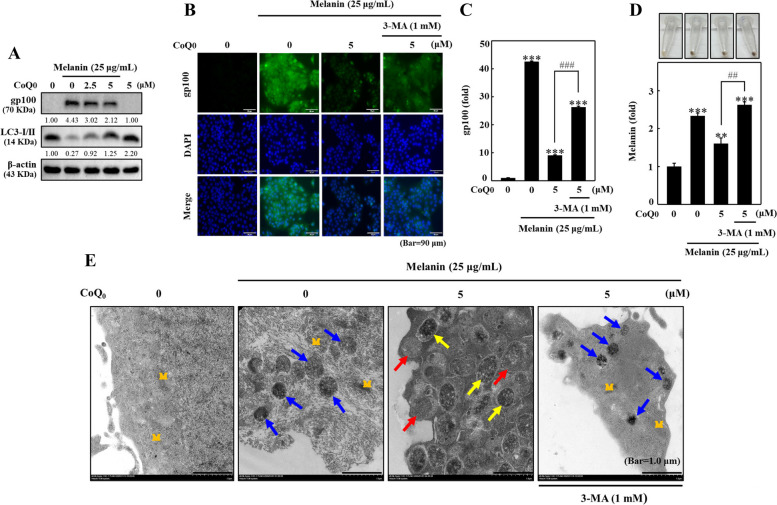
Fig. 12
CoQ 0 suppressed melanosome associated…
Fig. 12
CoQ 0 suppressed melanosome associated gp100 expression and triggered melanin degradation by inducing…
Fig. 12 CoQ0 suppressed melanosome associated gp100 expression and triggered melanin degradation by inducing autophagy in melanin-feeding HaCaT cells. Melanin-treated HaCaT cells were pretreated with or without 3-MA (1 mM, 1 h), followed by treatment with CoQ0 (0-5 μM, 24 or 72 h). A The gp100 and LC3B expressions (24 h) were determined using immunoblotting. B, C The gp100 expression (24 h) as assessed by immunofluorescence staining. D The intracellular melanin levels (72 h) were estimated using the procedures described in the methodology section. The results are the mean ± SD (n=3). **p < 0.01; ***p < 0.001 compared with untreated cells. ##p< 0.01; ###p < 0.001 compared with CoQ0-treated cells. E TEM was used to analyze the CoQ0 promoted formation of melanosome-engulfing autophagosomes, and autolysosomes. Melanin-treated HaCaT cells were pretreated with or without 3-MA (1 mM, 1 h) followed by CoQ0 (0 or 5 μM, 24 h). M = mitochondria. The blue, yellow, and red arrows indicate melanin/melanosomes, autophagosomes containing melanin/melanosomes, and autolysosomes, respectively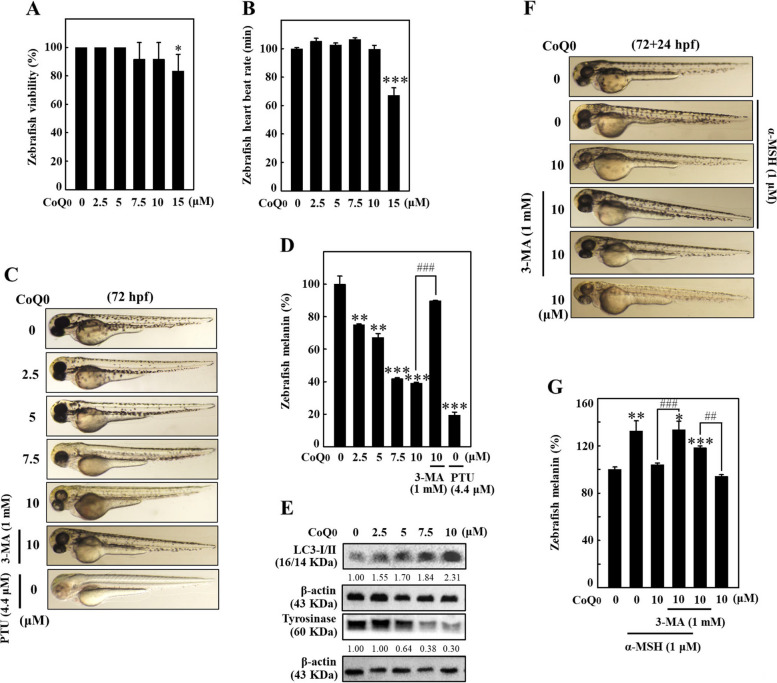
Fig. 13
CoQ 0 triggered antimelanogenesis and…
Fig. 13
CoQ 0 triggered antimelanogenesis and melanin degradation in zebrafish embryos. A-E Zebrafish embryos,…
Fig. 13 CoQ0 triggered antimelanogenesis and melanin degradation in zebrafish embryos. A-E Zebrafish embryos, 9 hpf, were treated with or without 3-MA (1 mM), followed by vehicle (0.1% DMSO) or CoQ0 (0-15 μM) up to 72 hpf. A, B The viability (%) and heart rate (beats/min) of zebrafish were measured using a stereomicroscope. C, D CoQ0 suppressed melanogenesis in zebrafish. PTU (4.4 μM) served as a positive control. E At the end of treatments, proteins were extracted, and an immunoblotting assay was conducted to measure LC3-II and tyrosinase expression. F, G CoQ0 triggered melanin degradation in zebrafish. Zebrafish at 72 hpf were treated with or without 3-MA (1 mM) followed by CoQ0 (0 or 10 μM) for 24 h (72+24 hpf) with or without α-MSH (1 μM) stimulation. The change in endogenous body pigmentation (melanin levels) in zebrafish (lateral views are shown) was measured as described in the methodology section. The results are the mean ± SD (n=3). *p < 0.05; **p < 0.01; ***p < 0.001 compared with control zebrafish embryos. ##p < 0.01; ###p < 0.001 compared with CoQ0-treated zebrafish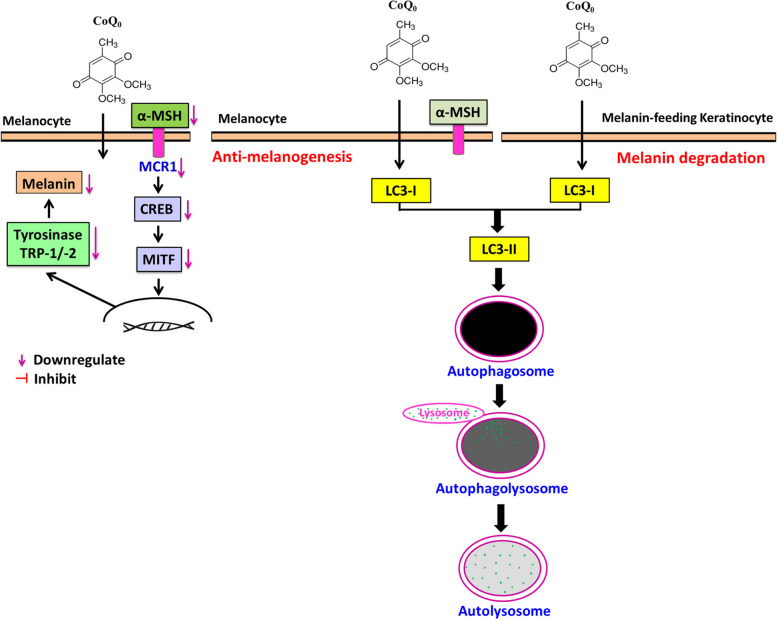
Fig. 14
Depigmentation activity of CoQ 0…
Fig. 14
Depigmentation activity of CoQ 0 through antimelanogenesis and melanin degradation by autophagy induction…
Fig. 14 Depigmentation activity of CoQ0 through antimelanogenesis and melanin degradation by autophagy induction in melanoma (B16F10) and melanin-feeding keratinocyte (HaCaT) cells All figures (14)