Nano Modification of Antrodia Cinnamomea Exhibits Anti-Inflammatory Action and Improves the Migratory Potential of Myogenic Progenitors
Abstract
The skeletal muscle progenitors' proliferation and migration are crucial stages of myogenesis. Identifying drug candidates that contribute to myogenesis can have a positive impact on atrophying muscle. The purpose of the study is to synthesize the Antrodia cinnamomea (AC)-β-cyclodextrin (BCD) inclusion complex (IC) and understand its in vitro pro-regenerative influence in murine skeletal C2C12 myoblasts. The IC was subjected to various nano-characterization studies. Fluorescent IC was synthesized to understand the cellular uptake of IC. Furthermore, 25 µg/mL, 12.5 µg/mL, and 6.25 µg/mL of IC were tested on murine C2C12 skeletal muscle cells for their anti-inflammatory, pro-migratory, and pro-proliferative action. The cellular internalization of IC occurred rapidly via pinocytosis. IC (252.6 ± 3.2 nm size and -37.24 ± 1.55 surface charge) exhibited anti-inflammatory action by suppressing the secretion of interleukin-6 and enhanced cell proliferation with promising cytocompatibility. A 12.5 μg/mL dose of IC promoted cell migration in 24 h, but the same dose of AC significantly reduced cell migration, suggesting modification by BCD. Molecular studies revealed that IC promoted C2C12 myoblasts migration by upregulating long non-coding RNA (lncRNA) NEAT-1, SYISL, and activating the pPKC/β-catenin pathway. Our study is the first report on the pro-proliferative and pro-migratory effects of BCD-modified extracts of AC.
Figures 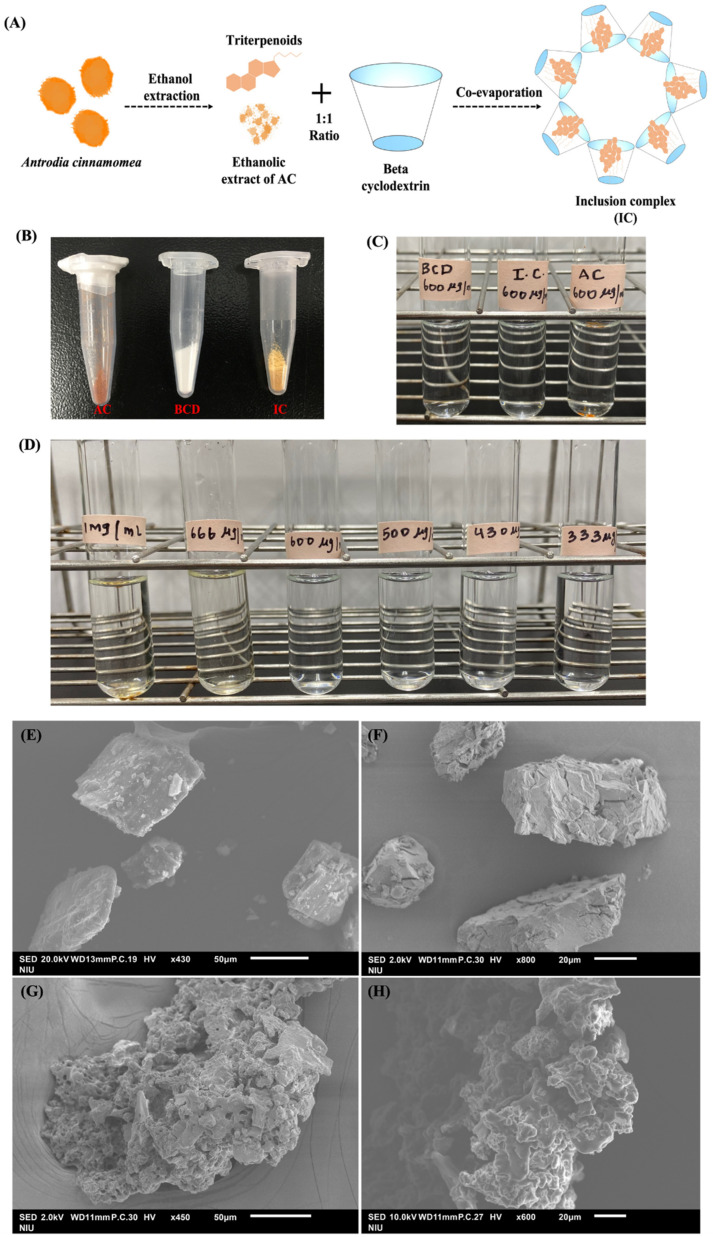
Figure 1
( A ) Schematic diagram…
Figure 1
( A ) Schematic diagram showing the synthesis of IC ( B )…
Figure 1 (A) Schematic diagram showing the synthesis of IC (B) Co-evaporation of ethanolic extract of AC (brown) and BCD (white) resulted in the formation of the IC (yellow). (C) Water solubility analysis of BCD, AC, and IC. (D) Water solubility analysis of different concentrations of IC. Morphological analysis of (E) BCD, (F) AC (G), and (H) IC using SEM.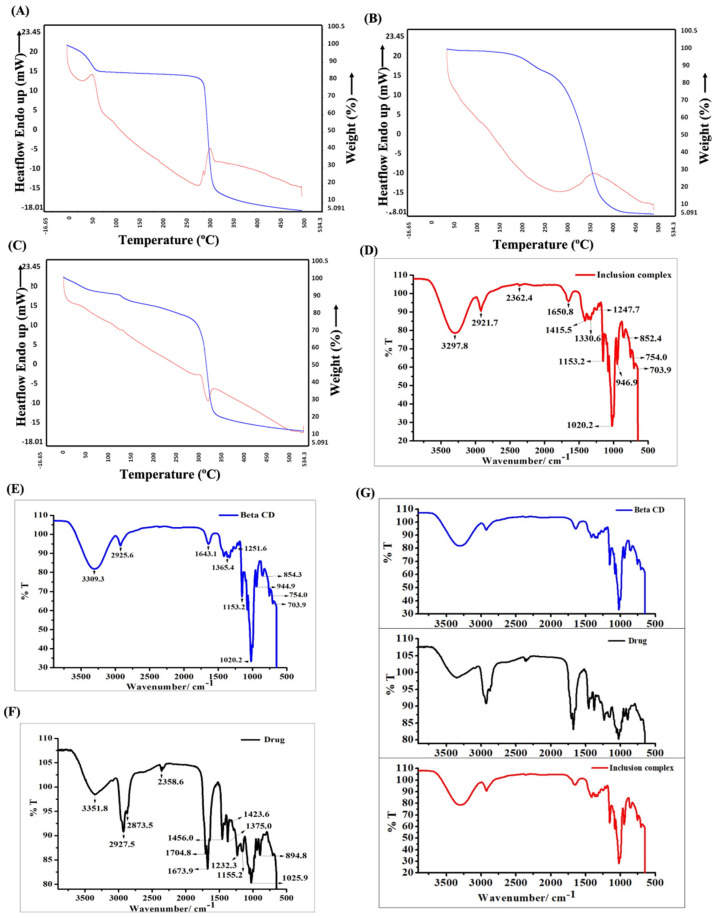
Figure 2
TGA (Blue)/DSC (Red) analysis of…
Figure 2
TGA (Blue)/DSC (Red) analysis of ( A ) BCD, ( B ) AC,…
Figure 2 TGA (Blue)/DSC (Red) analysis of (A) BCD, (B) AC, and (C) IC. FT-IR spectral analysis of (D) IC, (E) BCD, and (F) AC. (G) Merged FT-IR spectra of BCD, AC (drug), and IC.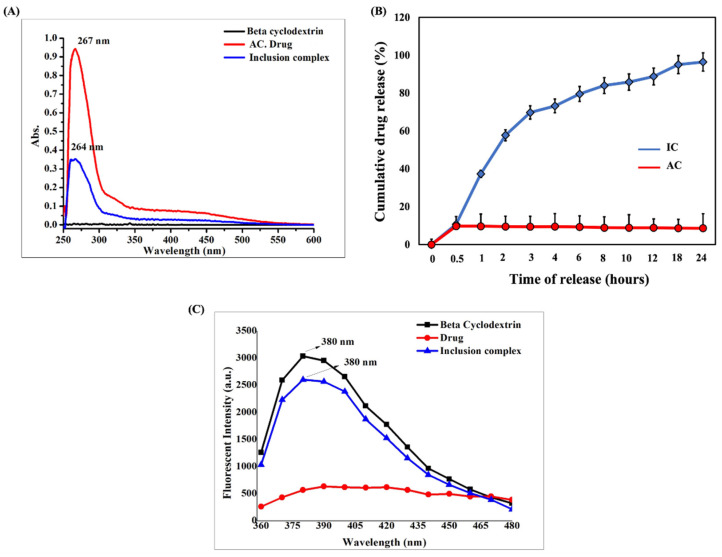
Figure 3
( A ) UV-visible absorption…
Figure 3
( A ) UV-visible absorption spectra of BCD, AC, and IC. ( B…
Figure 3 (A) UV-visible absorption spectra of BCD, AC, and IC. (B) In vitro dissolution profile of AC and IC in PBS (pH 7.4) (C) Fluorescent spectra of BCD, AC, and IC.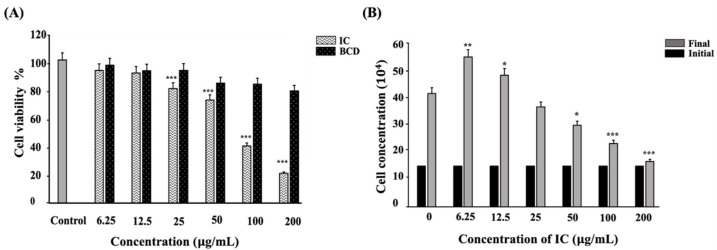
Figure 4
Lower concentrations of IC exhibited…
Figure 4
Lower concentrations of IC exhibited cytocompatibility and improved proliferation ( A ) C2C12…
Figure 4 Lower concentrations of IC exhibited cytocompatibility and improved proliferation (A) C2C12 myoblasts treated with BCD and IC separately for 24 h prior to MTT exposure and measured spectrophotometrically at 570 nm. (B) C2C12 myoblasts were treated with IC, incubated for 24 h, and counted using trypan blue exclusion method to assess the cell proliferation. All the experiments were repeated thrice, and data were shown as mean ± SD; n = 3. *, ** and *** shows a significant difference at p < 0.05, p < 0.01, and p < 0.001, respectively, compared to the control (Two-tailed t-test).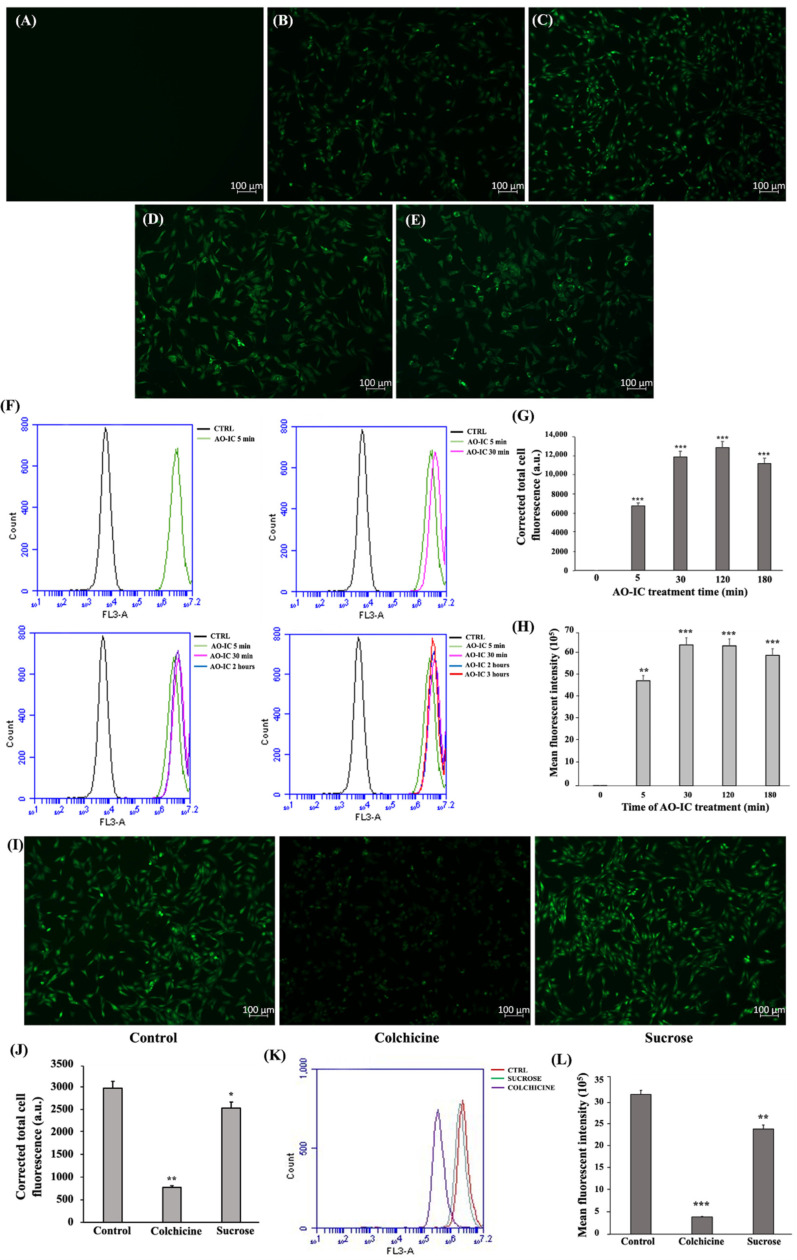
Figure 5
C2C12 myoblasts internalize IC via…
Figure 5
C2C12 myoblasts internalize IC via the pinocytosis pathway. Cell internalization of AO-IC as…
Figure 5 C2C12 myoblasts internalize IC via the pinocytosis pathway. Cell internalization of AO-IC as a function of time analyzed by fluorescence microscopy. (A) 0 min, (B) 5 min, (C) 30 min, (D) 120 min, and (E) 180 min. (F) FACS analysis on cellular uptake of AO-IC. (G) CTCF measured upon the cell internalization of AO-IC with respect to time and (H) mean fluorescent intensity measured. (I) Fluorescent microscopic images of C2C12 myoblast cells treated with or without colchicine and hyperosmotic sucrose, followed by AO-IC incubation for 2 h. (J) CTCF measured upon AO-IC internalization after endocytosis inhibitor treatment. (K) FACS analysis and (L) mean fluorescent intensity measurement post cellular internalization of AO-IC after endocytosis inhibitor treatment. The study was repeated three times, and the results were shown as mean ± SD; n = 3. *, ** and *** show a significant difference at p < 0.05, p < 0.01, and p < 0.001, respectively, compared to the control (Two-tailed t-test).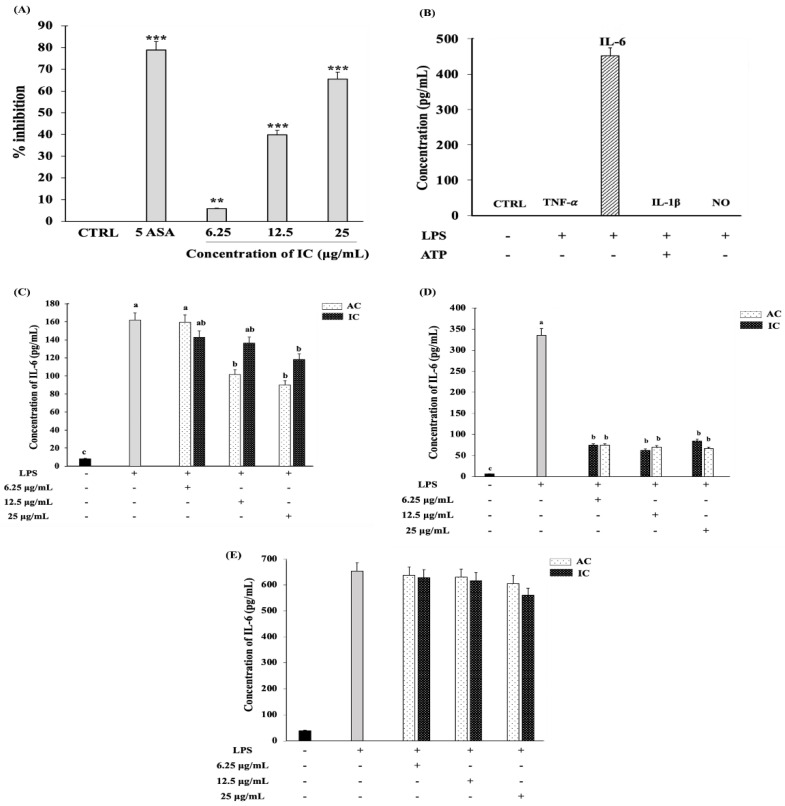
Figure 6
IC exhibited anti-inflammatory activity and…
Figure 6
IC exhibited anti-inflammatory activity and suppressed the IL-6 production in C2C12 myoblasts cells.…
Figure 6 IC exhibited anti-inflammatory activity and suppressed the IL-6 production in C2C12 myoblasts cells. (A) Ability of different concentrations of IC to inhibit protein denaturation. (B) Pro-inflammatory cytokines production in C2C12 myoblast cells stimulated with 100 ng/mL LPS for 24 h. For the production of IL-1β, the LPS-stimulated cells were further activated with ATP. Cells were treated with 25 µg/mL, 12.5 µg/mL and 6.25 µg/mL concentrations of IC and AC for (C) 30 min and (D) 3 h before stimulating with 100 ng/mL LPS for 24 h. (E) IL-6 suppressive effect of IC and AC in C2C12 myotubes. After reaching the required confluency, the C2C12 myoblasts were switched to 2% HS medium to initiate the differentiation. After 8 days of differentiation, the C2C12 myotubes were subjected to IC and AC treatment for 3 h prior to 100 ng/mL LPS stimulation for 24 h. The IL-6 levels in culture supernatant were measured by ELISA. The study was repeated three times, and the results were shown as mean ± SD; n = 3. ** and *** shows a significant difference at p < 0.05, p < 0.01 and p < 0.001, respectively, compared to the control (Two-tailed t-test). The statistical comparison between groups was performed using One-way ANOVA (Dunnett’s multiple comparisons test). abc indicate significant differences between the groups. Statistically different groups are denoted by different letters and different groups of letters. Similar letters and similar groups of letters denote no statistical difference between them.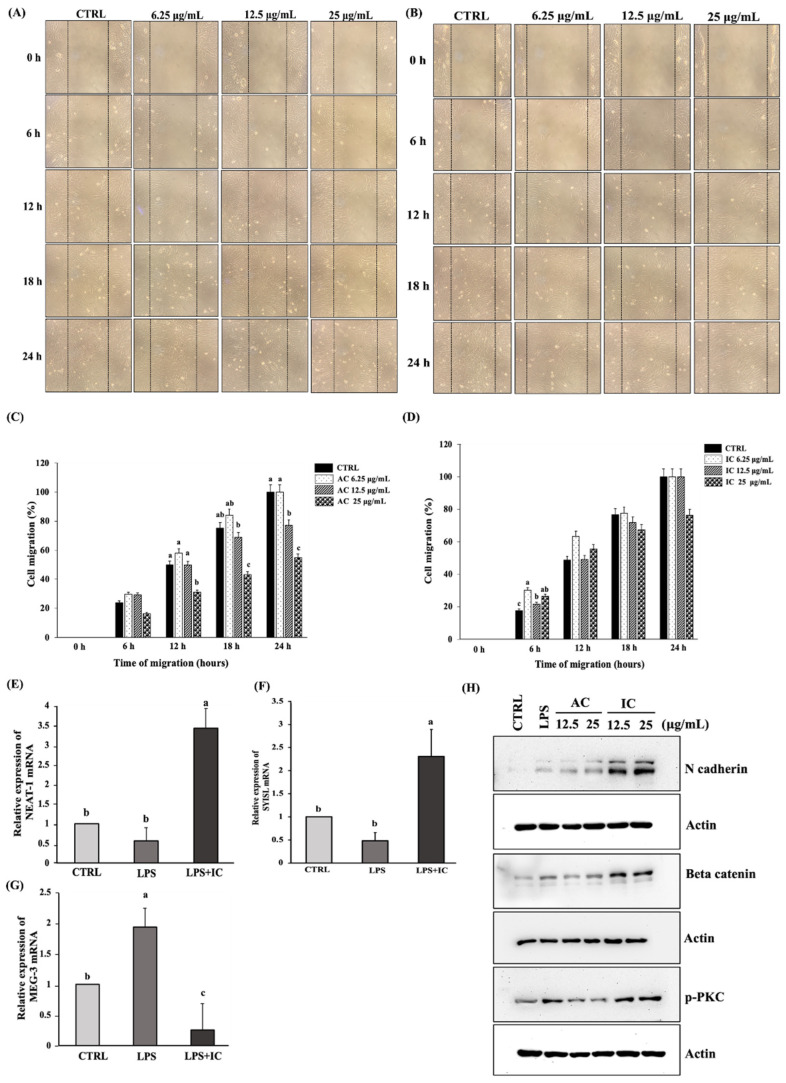
Figure 7
IC influences the lncRNAs expression…
Figure 7
IC influences the lncRNAs expression to promote the migration and proliferation of C2C12…
Figure 7 IC influences the lncRNAs expression to promote the migration and proliferation of C2C12 myoblast cells. Wound healing assay performed on myoblasts treated with 6.25 µg/mL, 12.5 µg/mL, and 25 µg/mL of (A) AC and (B) IC with respect to time (0 h, 6 h, 12 h, 18 h, and 24 h) visualized using a microscope. The percentage cell migration calculated on myoblasts treated with (C) AC and (D) IC with respect to time. The influence of IC on the lncRNA expression in C2C12 myoblasts was analyzed using RT-PCR study. The cells were treated with 25 µg/mL of IC followed by LPS treatment, RNA extraction, and cDNA synthesis. The RT-PCR analysis was carried out to determine the effect of IC on (E) lncRNA NEAT-1, (F) lncRNA SYISL, and (G) lncRNA MEG-3 expression. (H) The effect of IC on the expression of migratory proteins was studied by western blot analysis. The study was repeated three times, and the results were shown as mean ± SD; n = 3. The statistical comparison between groups was performed using One-way ANOVA (Dunnett’s multiple comparisons test).abc indicate significant differences between the groups. Statistically different groups are denoted by different letters and different groups of letters. Similar letters and similar groups of letters denote no statistical difference between them.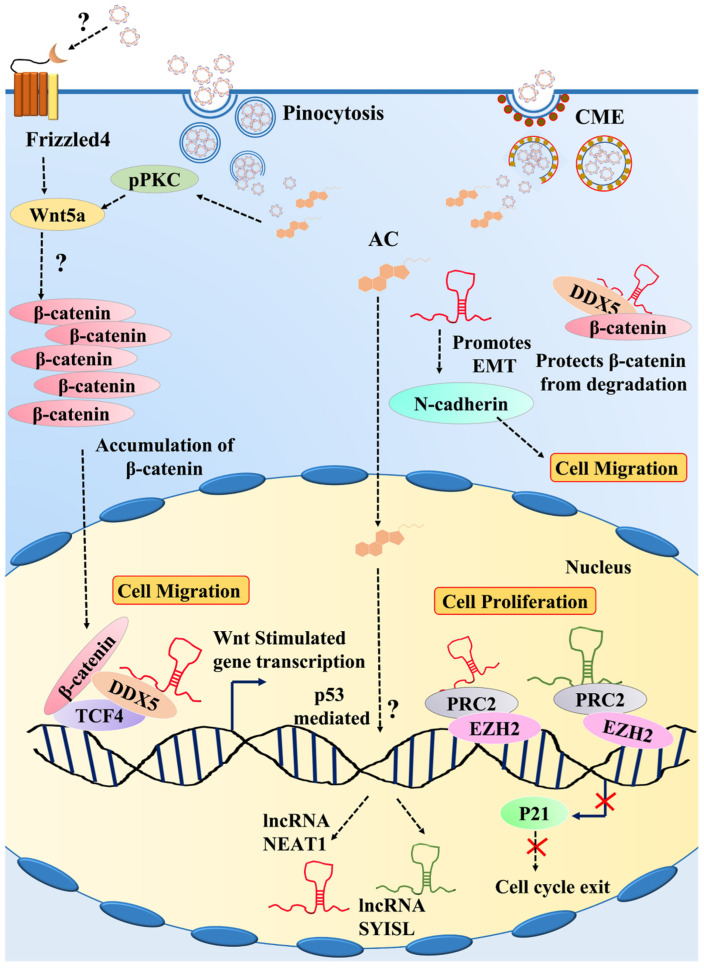
Figure 8
Demonstration of the signaling pathway…
Figure 8
Demonstration of the signaling pathway triggered by IC in C2C12 myoblasts.
Figure 8 Demonstration of the signaling pathway triggered by IC in C2C12 myoblasts. All figures (8)