Hepatoprotective bioactivity of the glycoprotein, antrodan, isolated from Antrodia cinnamomea mycelia
Figures
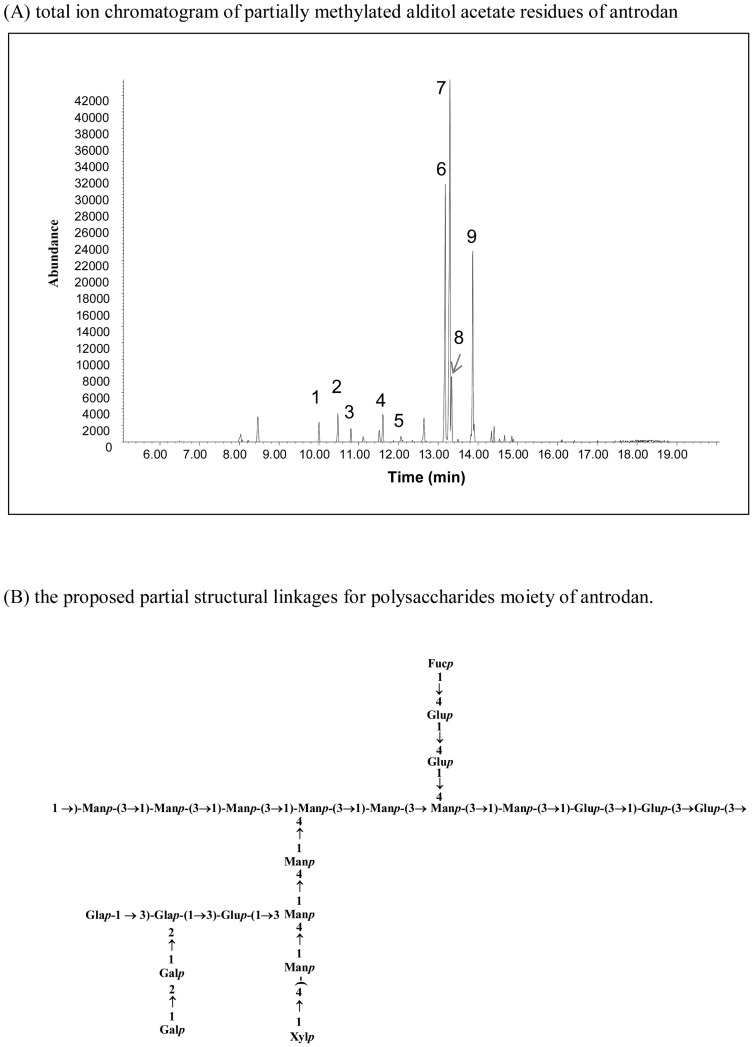
Figure 1. Total ion chromatogram of partially…
Figure 1. Total ion chromatogram of partially methylated alditol acetate residues of antrodan by a…
Figure 1. Total ion chromatogram of partially methylated alditol acetate residues of antrodan by a GC/MS analysis (A) and the proposed partial structural linkages of the polysaccharide moieties of antrodan (B).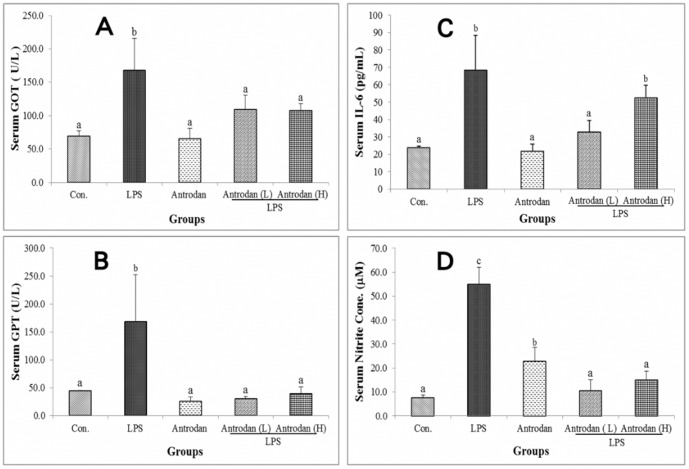
Figure 2. Effect of antrodan on lipopolysaccharide…
Figure 2. Effect of antrodan on lipopolysaccharide (LPS)-induced serum glutamine-oxaloacetic transaminase (GOT) (A), glutamic-pyruvic transaminase…
Figure 2. Effect of antrodan on lipopolysaccharide (LPS)-induced serum glutamine-oxaloacetic transaminase (GOT) (A), glutamic-pyruvic transaminase (GPT) (B), interleukin (IL)-6 (C) and nitric oxide (NO) (D) levels. Con, control; LPS, 5 mg/kg LPS; Antrodan, 40 mg/kg antrodan; Antrodan L+LPS, 40 mg/kg antrodan + LPS; Antrodan H+LPS: 80 mg/kg antrodan + LPS. Values are expressed as the mean ± S.D. (n = 6). One way ANOVA is followed by the post-hoc LSD test. Different letters indicate a significant difference (p<0.05).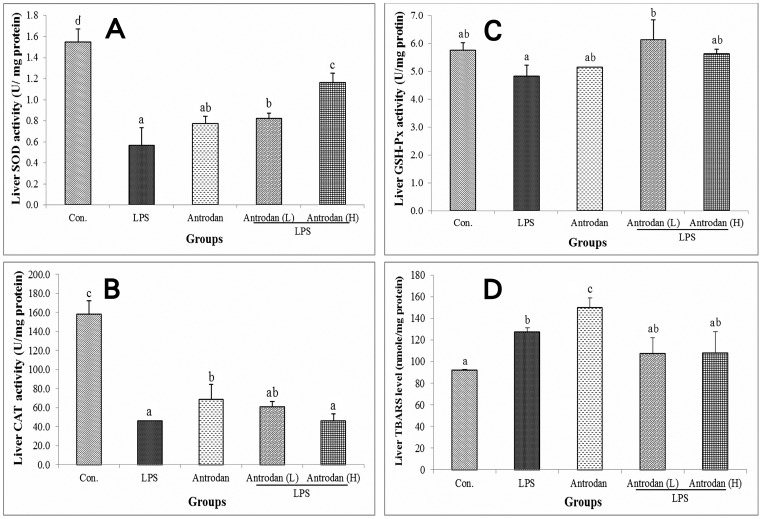
Figure 3. Effect of antrodan on the…
Figure 3. Effect of antrodan on the lipopolysaccharide (LPS)-induced hepatic antioxidative capability.
(A) Superoxide dismutase,…
Figure 3. Effect of antrodan on the lipopolysaccharide (LPS)-induced hepatic antioxidative capability. (A) Superoxide dismutase, (B) catalase, (C) glutathione peroxidase (GSH-Px), and (D) thiobarbituric acid reactive substances (TBARS). Con, control; LPS, 5 mg/kg LPS; Antrodan, 40 mg/kg antrodan; Antrodan L+LPS, 40 mg/kg antrodan + LPS; Antrodan H+LPS, 80 mg/kg antrodan + LPS. Values are expressed as the mean ± S.D. (n = 6). One way ANOVA is followed by the post-hoc LSD test. Different letters indicate a significant difference (p<0.05).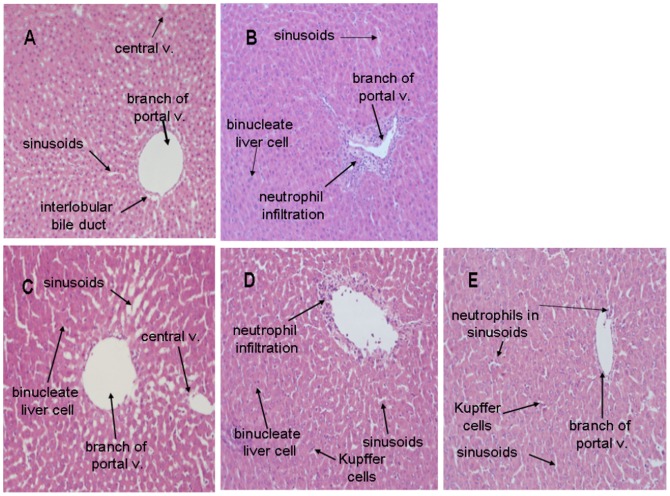
Figure 4. H&E staining of liver tissues.
Figure 4. H&E staining of liver tissues.
(A) Control; (B) tissue treated with 5 mg/kg…
Figure 4. H&E staining of liver tissues. (A) Control; (B) tissue treated with 5 mg/kg (i.p.) lipopolysaccharide (LPS) showing severe inflammatory cell infiltration and markedly diffuse cellular infiltration, and vacuolar degeneration in some hepatocytes; (C) treated with 40 mg/kg antrodan; (D) pretreated with 40 mg/kg antrodan by gavage and then with LPS, showing focal areas of liver parenchyma with neutrophil infiltration and necrosis; (E) animal pretreated with 80 mg/kg antrodan by gavage and then with LPS, showing no pathological changes except for a few neutrophils in the sinusoids. Antrodan at 40 mg/kg was revealed to be hepatoprotective against the inflammatory abuse by LPS. (magnification, all 200×).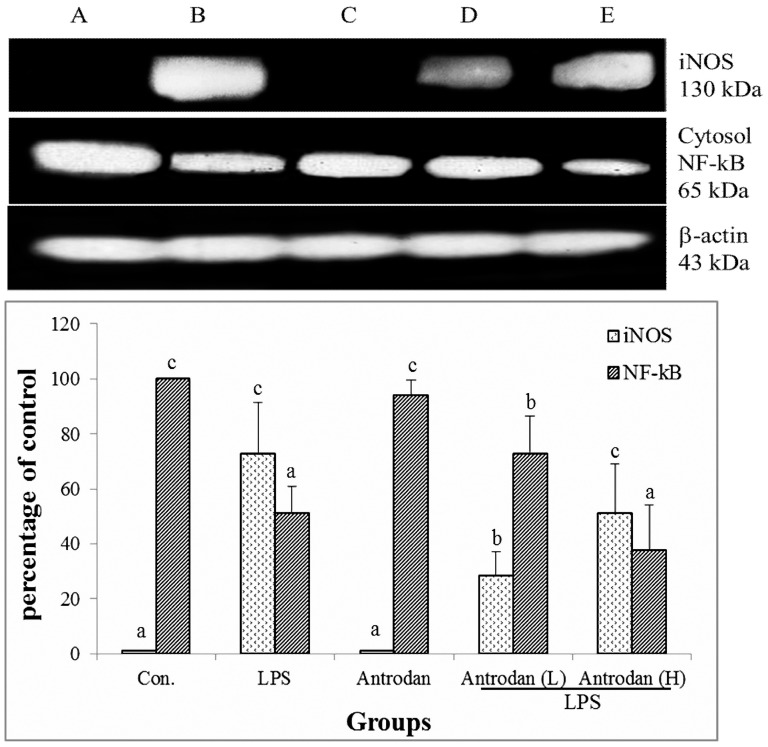
Figure 5. Effect of antrodan on the…
Figure 5. Effect of antrodan on the activation of cytoplasmic NF-κB (p65) protein and the…
Figure 5. Effect of antrodan on the activation of cytoplasmic NF-κB (p65) protein and the expression of iNOS in lipopolysaccharide (LPS)-stimulated rat liver tissue by Western blot analysis. Con, control; LPS, 5 mg/kg LPS; Antrodan, 40 mg/kg antrodan; Antrodan L+LPS, 40 mg/kg antrodan + LPS; Antrodan H+LPS, 80 mg/kg antrodan + LPS. Values are expressed as the mean ± S.D. (n = 6). One way ANOVA is followed by the post-hoc LSD test. Different letters indicate a significant difference (p<0.05).