Global assessment of Antrodia cinnamomea-induced microRNA alterations in hepatocarcinoma cells
Figures
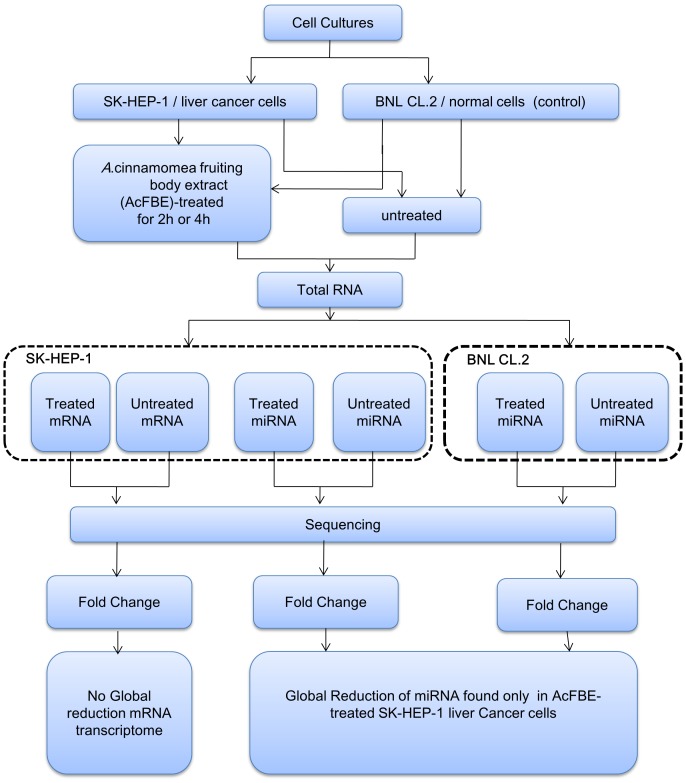
Figure 1. MicroRNA analysis workflow.
Both experimental…
Figure 1. MicroRNA analysis workflow.
Both experimental and control cells were treated, or untreated (control,…
Figure 1. MicroRNA analysis workflow. Both experimental and control cells were treated, or untreated (control, DMSO alone was added), with 500 µg/ml AcFBE (experimental) for 2 or 4 hours. MicroRNAs were extracted, sequenced, and compared. Both cross-time and cross-experiment analyses were performed to test the reliability and AcFBE effect, respectively. The same experiments were repeated once to ensure reliability. Messenger RNA transcriptomes were also prepared for further understanding of the nature of miRNA fluctuation.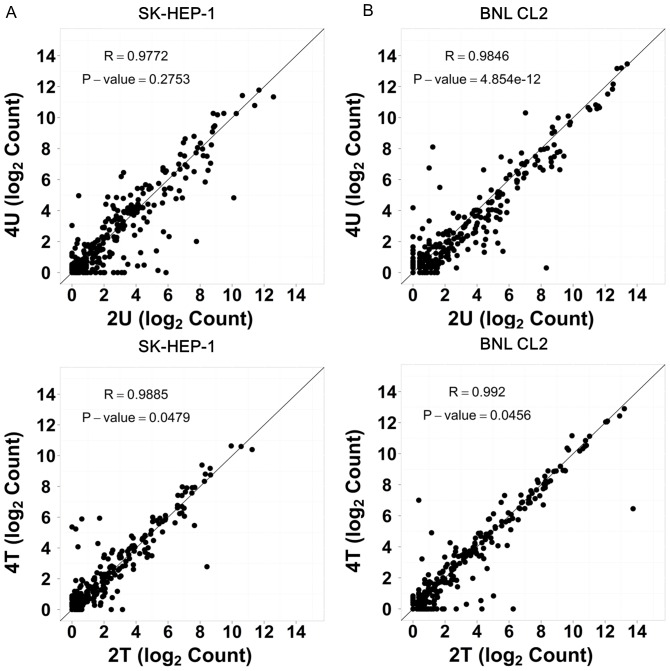
Figure 2. Cross-time point comparison of miRNA…
Figure 2. Cross-time point comparison of miRNA expression by scatter plotting.
SK-HEP-1 miRNAs ( A…
Figure 2. Cross-time point comparison of miRNA expression by scatter plotting. SK-HEP-1 miRNAs (A) and BNL CL.2 (control) miRNAs (B) both sequenced by 5500xl and analyzed with scatter plotting to test the consistency of data extrapolation from 2 hr time point to 4 hr time point. The correlation coefficient (R) and P-value of each library were calculated using Student's t-test. A linear correlation was observed in all cases.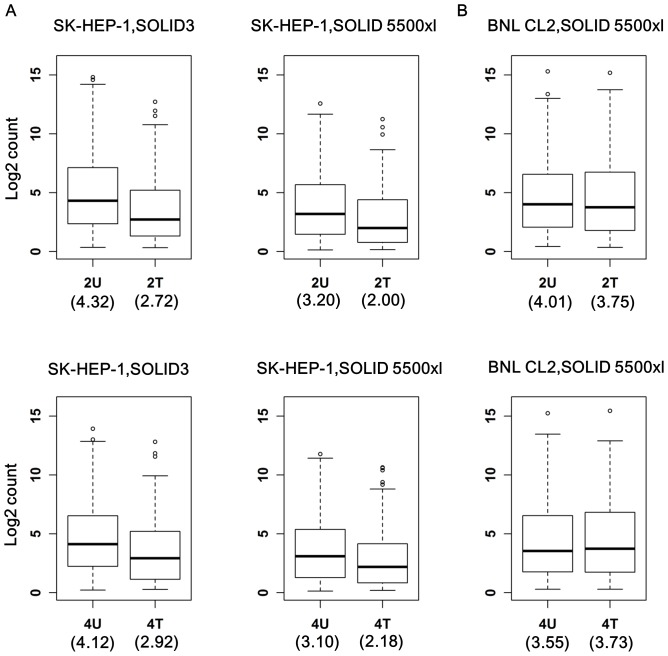
Figure 3. Boxplots showing cross-experiment comparison on…
Figure 3. Boxplots showing cross-experiment comparison on miRNA expression between AcFBE-treated and –untreated samples.
The…
Figure 3. Boxplots showing cross-experiment comparison on miRNA expression between AcFBE-treated and –untreated samples. The distributions of miRNA expression level (inner boxes) and medians (horizontal line in each inner box, value shown in the parentheses right below the outer box) are presented by box plotting for each (untreated vs. treated) pair for each time point (either 2 hr and 4 hr time point and for both SK-HEP-1 and BNL CL.2 normal cells. Experiments of SK-HEP-1 cancer cells were repeated and the duplicates were sequenced separately by two types of sequencers (shown above). (A) SOLiD 3 miRNA dataset produced from SK-HEP-1 and SOLiD 5500 miRNA dataset produced from another batch of SK-HEP-1. (B) miRNA dataset produced from BNL CL.2 normal cells (control).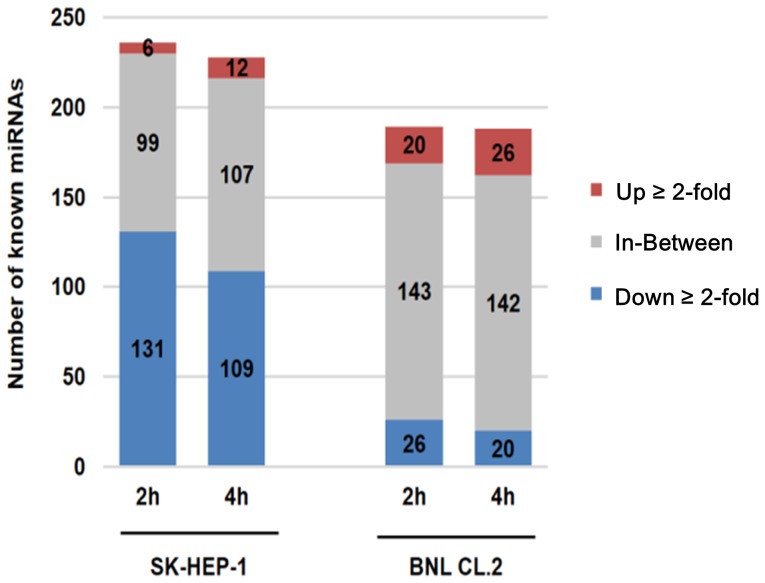
Figure 4. Expression profiles of miRNAs for…
Figure 4. Expression profiles of miRNAs for SK-HEP-1 and BNL CL.2 by treated AcFBE.
To…
Figure 4. Expression profiles of miRNAs for SK-HEP-1 and BNL CL.2 by treated AcFBE. To compared the expression level of known miRNAs affected by treated AcFBE for SK-HEP-1 and BNL CL.2 cells at 2 hr and 4 hr.
Figure 5. Cross-time comparison for the top…
Figure 5. Cross-time comparison for the top 20 most downregulated miRNAs identified from SK-HEP-1 cells…
Figure 5. Cross-time comparison for the top 20 most downregulated miRNAs identified from SK-HEP-1 cells treated with AcFBE for 2 hours. (A) First batch of quality miRNAs (sequenced by SOLiD 3) from 2 hr AcFBE-treated or –untreated SK-HEP-1 cells were normalized and used to calculate log2 fold changes. Values of the untreated were subtracted from the treated. The top 20 most significantly downregulated miRNAs were identified and compared with their levels at 4 hr time point. (B)Same as A, but prepared from another batch of SK-HEP-1 cells (repeated samples sequenced by SOLiD 5500xl).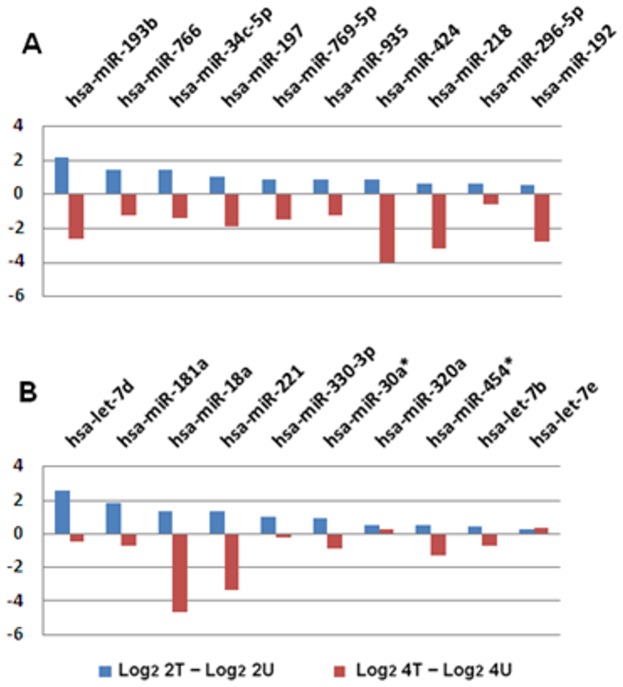
Figure 6. Cross-time Comparison (2 hr vs.…
Figure 6. Cross-time Comparison (2 hr vs. 4 hr) of the top 10 most significantly…
Figure 6. Cross-time Comparison (2 hr vs. 4 hr) of the top 10 most significantly upregulated miRNAs. (A) First batch of quality miRNAs (sequenced with SOLiD 3) from 2 hr AcFBE treated or untreated SK-HEP-1 cells were normalized by (actual reads/quality reads) ×1,000,000 and used to calculate the log2 fold change. Values of the untreated were subtracted from the treated followed by a sorting to identify the top 10 miRNAs with highest positive values which were then compared with their levels at 4-h time point. (B) Same as A, but prepared from another batch of SK-HEP-1 cells (repeated samples sequenced with SOLiD 5500xl).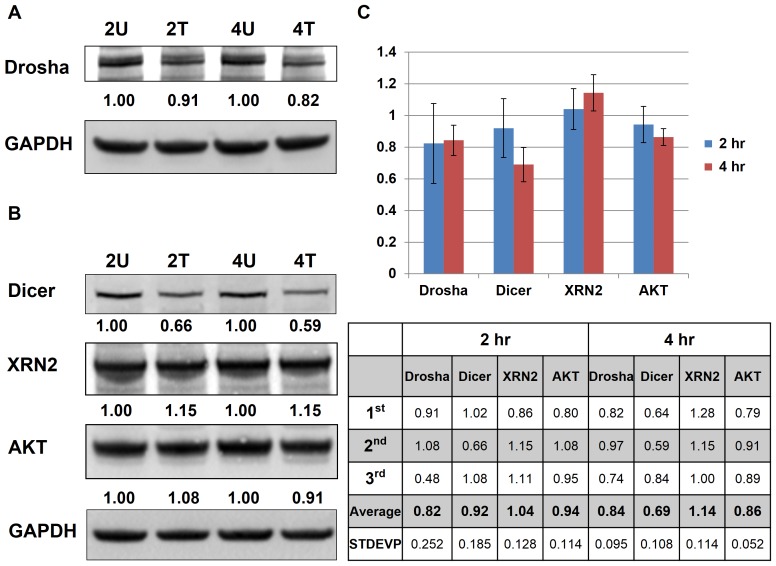
Figure 7. Western blot analysis of SK-HEP-1…
Figure 7. Western blot analysis of SK-HEP-1 samples with or without AcFBE treatment.
Western blots…
Figure 7. Western blot analysis of SK-HEP-1 samples with or without AcFBE treatment. Western blots showed a decrease in Drosha (A) and Dicer (B) proteins which are key enzymes of the miRNA biogenesis pathway. This is accompanied by a minor increase in XRN2 protein, involved in miRNA degradation. A minor decrease of AKT (involved in PI3K pathway) was also observed. Cancer cell line, SK-HEP1 hepatocarcinoma cell; Drug, A. cinnamomea fruiting body extract (AcFBE); 2U, sample treated with DMSO for 2 hr; 2T, sample treated with AcFBE at 0.5 mg/ml for 2 hr; 4U, sample treated with DMSO for 4 hr; 4T, sample treated with AcFBE at 0.5 mg/ml for 4 hr. (C) Summary bar chart of triplicate western blot experiments. 2 hr, samples treated with AcFBE for 2 hours; 4 hr, samples treated with AcFBE for 4 hours. Protein levels relative to untreated controls are shown blow.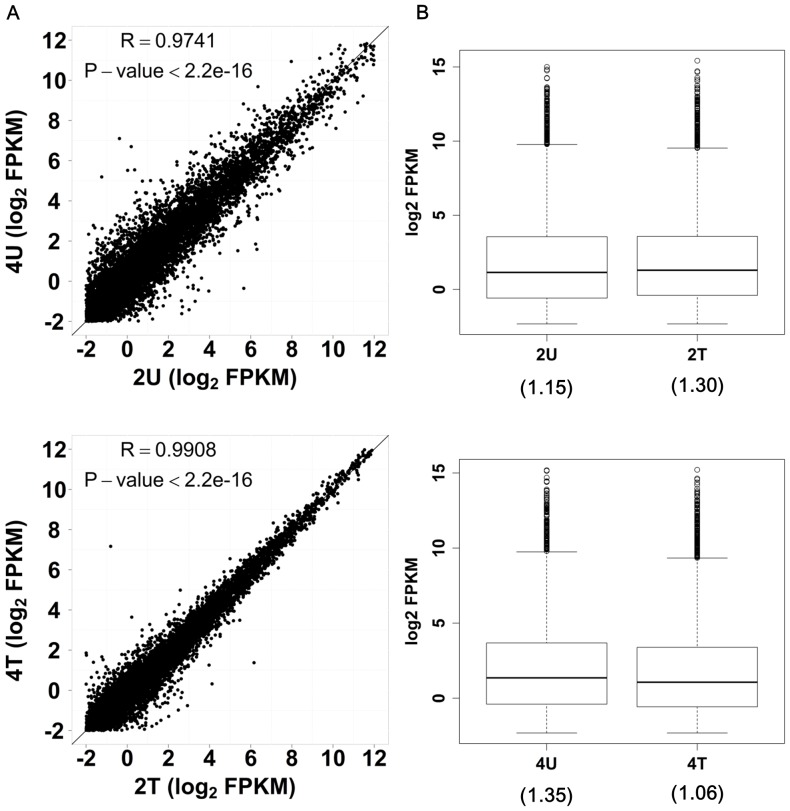
Figure 8. Transcriptome analyses of SK-HEP-1 liver…
Figure 8. Transcriptome analyses of SK-HEP-1 liver cancer cells treated or untreated with AcFBE.
All…
Figure 8. Transcriptome analyses of SK-HEP-1 liver cancer cells treated or untreated with AcFBE. All transcriptomes were analyzed with RNA-Seq approach. The expression level of an mRNA is represented as FPKM (fragments per kilo base of exon per million fragments mapped). (A) Scatter plots reveal a linear correlation in mRNA expression between AcFBE-untreated SK-HEP-1 samples (2U vs. 4U) and also between AcFBE-treated SK-HEP-1 samples (2T vs. 4T). The correlation coefficient (R) and P-value of each library were calculated using Student's t-test. The profile of treated sample seems to be less scattered than the untreated sample.(B) Box plots show the expression distribution and median (inside parenthesis) for each transcriptome library.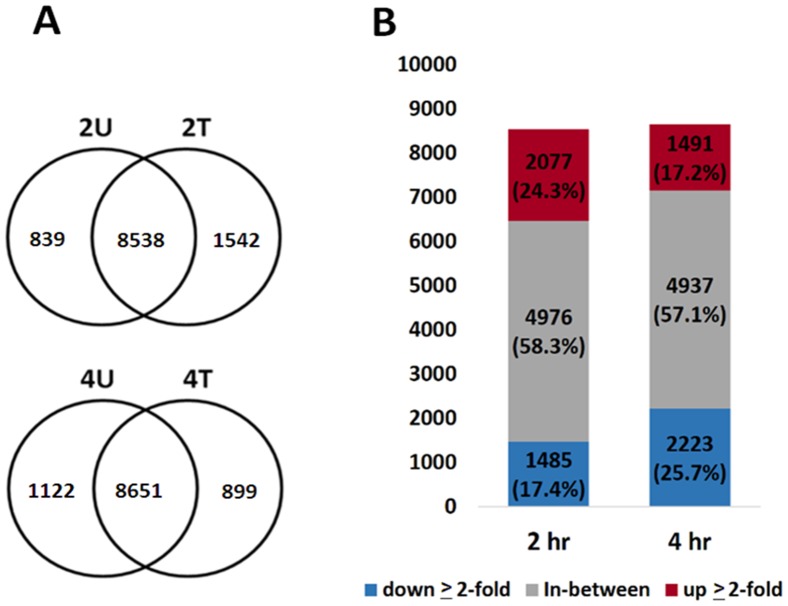
Figure 9. The overlapping genes in transcriptome…
Figure 9. The overlapping genes in transcriptome libraries.
( A ) Overlapping gene expression between…
Figure 9. The overlapping genes in transcriptome libraries. (A) Overlapping gene expression between the AcFBE-treated and –untreated SK-HEP-1 cancer cells in transcriptome libraries. This diagram shows the numbers of overlapped genes between the AcFBE-treated and untreated SK-HEP-1 cells. (B) Bar chart showing the number of responsive genes after treated with 500 µg/ml AcFBE for 2 or 4 hours. 2T, 2 hr treated; 2U, 2 hr untreated; 4T, 4 hr treated; 4U, 4 hr untreated. Up-expressed label red color and down-expressed label blue color.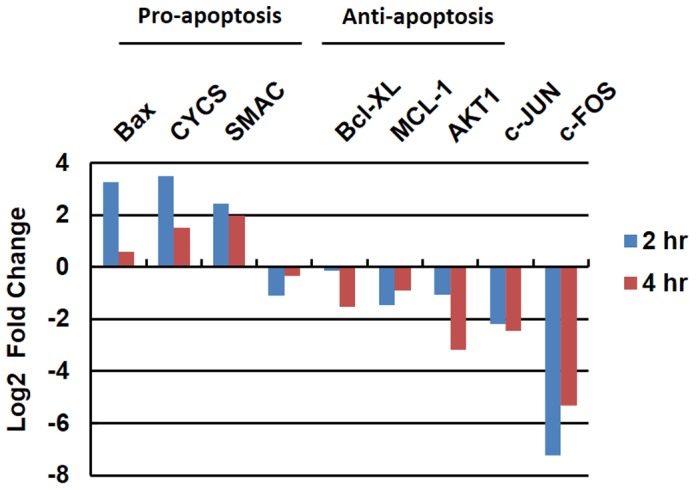
Figure 10. Alterations in the expression of…
Figure 10. Alterations in the expression of pro-apoptotic and anti-apoptotic genes.
SK-HEP-1 liver cancer cells…
Figure 10. Alterations in the expression of pro-apoptotic and anti-apoptotic genes. SK-HEP-1 liver cancer cells were treated (or untreated) with A. cinnamomea fruiting body extract for 2 or 4 hours. Transcriptomes from treated samples were analyzed and compared against the untreated counterparts to reveal the alteration in the expression levels of pro- and anti-apoptotic genes.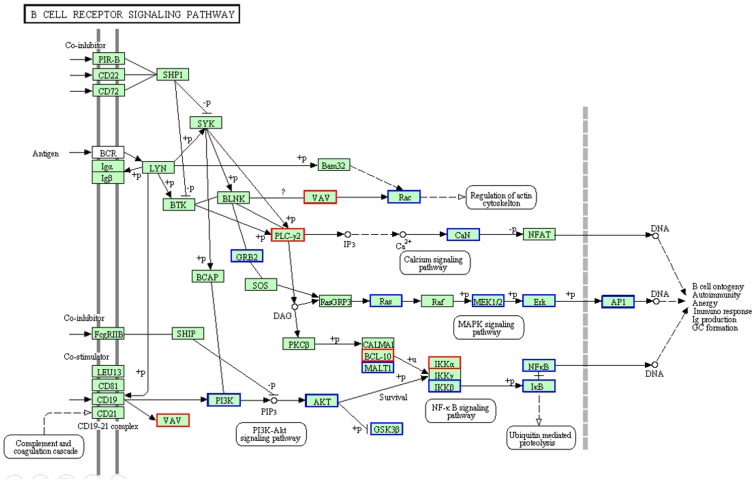
Figure 11. AcFBE-induced downregulation of MAPK and…
Figure 11. AcFBE-induced downregulation of MAPK and PI3K/AKT pathways as demonstrated by B cell signaling…
Figure 11. AcFBE-induced downregulation of MAPK and PI3K/AKT pathways as demonstrated by B cell signaling network using KEGG diagram. Transcriptomes generated from messenger RNAs of SK-HEP-1 liver cancer cells with or without AcFBE treatment for 2 hours were analyzed and plugged into KEGG database for pathway analysis. Through the process, PI3K/AKT/IKKβ/NFκB and MAPK were identified among the most significantly affected pathways. Upregulated pathway genes are highlighted in red boxes, while downregulated pathway genes highlighted in blue boxes.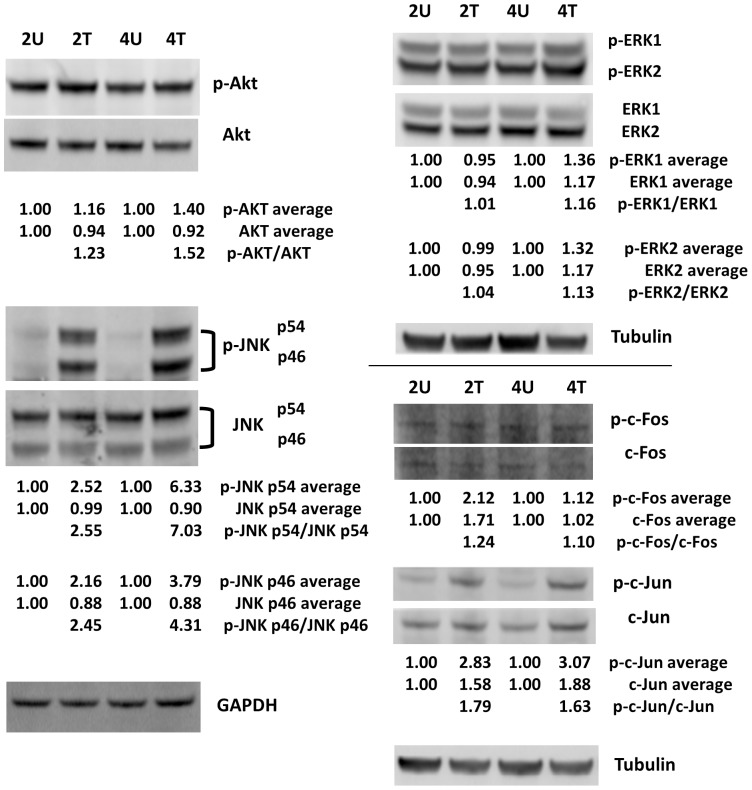
Figure 12. Western blot analysis of the…
Figure 12. Western blot analysis of the phosphorylated and unphosphorylated forms of AKT, ERK, JNK,…
Figure 12. Western blot analysis of the phosphorylated and unphosphorylated forms of AKT, ERK, JNK, c-Fos, and c-Jun. SK-HEP1 liver cancer cells were treated with (at 0.5 mg/ml) or without AcFBE for 2 or 4 hrs. Immunoblotting experiments were repeated twice using GAPDH or Tubulin as controls. The duplicates were averaged and shown below each protein band, and the phosphorylated-to-unphosphorylated ratios were then calculated and shown below the treated samples. Protein bands were from the first set of immunoblotting experiment. The normalized protein level of untreated samples was set as 1.00 for comparing to their corresponding AcFBE-treated samples. 2U, untreated for 2 hrs; 2T, treated for 2 hrs; 4U, untreated for 4 hrs; 4T, treated for 4 hrs. All figures (12)