Eburicoic Acid, an Active Triterpenoid from the Fruiting Bodies of Basswood Cultivated Antrodia cinnamomea, Induces ER Stress-Mediated Autophagy in Human Hepatoma Cells
Abstract
Antrodia cinnamomea, a Taiwan-specific medicinal mushroom, can manipulate biological activities, including hepatoprotection, anti-inflammation, anti-hepatitis B virus activity, anticancer activity, etc. In this study, the anti-liver cancer activity and molecular mechanisms of eburicoic acid, the second most abundant triterpenoid from the fruiting bodies of basswood cultivated Antrodia cinnamomea was investigated using the human hepatoma Hep 3B cells. The results show that eburicoic acid effectively reduced Hep 3B cell viability within 24 hours, and the IC50 was 18.4 μM, which was equivalent to 8.7 μg/mL. Besides, eburicoic acid induced conversion of LC3-I to LC3-II and a large number of autophagosomes/autolysosomes formation. In depth investigation for the molecular mechanisms, revealed that eburicoic acid firstly promoted reactive oxygen species generation and ATP depletion, leading to endoplasmic reticulum stress, followed by elevated cytosolic calcium ion concentration and BiP expression, downregulated phosphorylation of DAPK, upregulated phosphorylation of Beclin-1, JNK, and Bcl-2, and finally induced autophagy in Hep 3B cells. These results indicate that eburicoic acid has significant anti-liver cancer effects and more distinctive mechanisms.
Figures 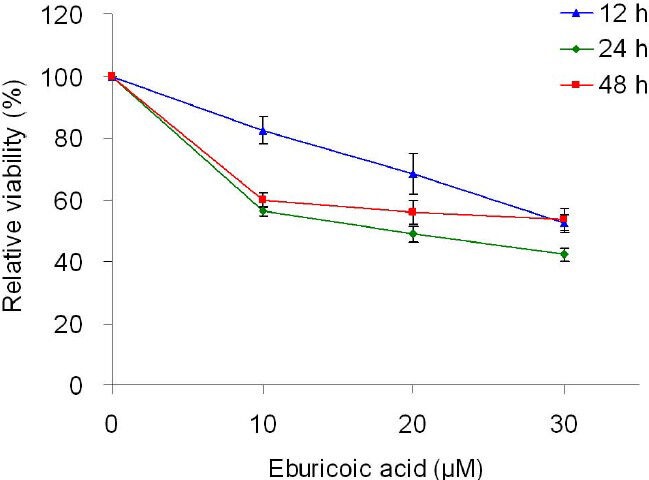
Figure 1
Effect of eburicoic acid on…
Figure 1
Effect of eburicoic acid on cell viability in Hep 3B cells After incubation…
Figure 1 Effect of eburicoic acid on cell viability in Hep 3B cells After incubation of the cells with 0, 10, 20, and 30 μM eburicoic acid for 12, 24, and 48 h, cell viability was determined by MTT assay. Data are expressed as percentage of negative control (0.3% DMSO).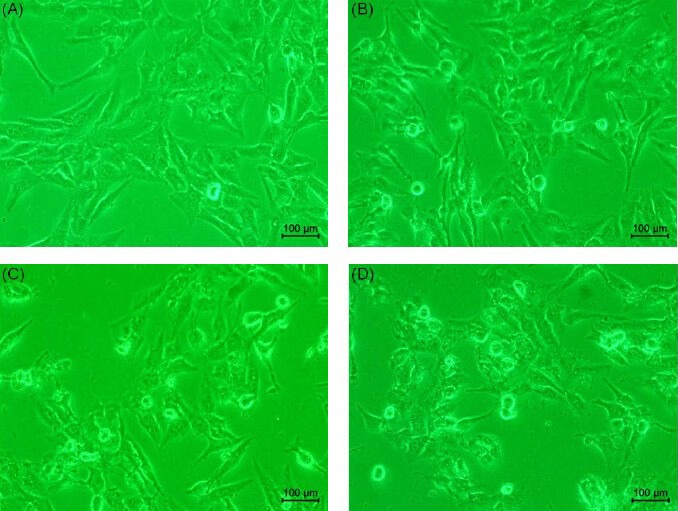
Figure 2
Effect of eburicoic acid on…
Figure 2
Effect of eburicoic acid on cell morphology in Hep 3B cells After incubation…
Figure 2 Effect of eburicoic acid on cell morphology in Hep 3B cells After incubation of the cells with (A) 0, (B) 10, (C) 20, and (D) 30 μM eburicoic acid for 24 h, cell morphology was observed by inverted phase-contrast microscope.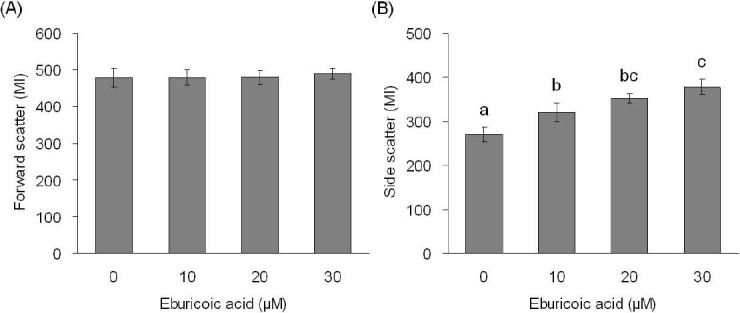
Figure 3
Effect of eburicoic acid on…
Figure 3
Effect of eburicoic acid on cell size and granularity in Hep 3B cells…
Figure 3 Effect of eburicoic acid on cell size and granularity in Hep 3B cells After incubation of the cells with 0, 10, 20, and 30 μM eburicoic acid for 24 h, cell (A) size and (B) granularity were analyzed by flow cytometry. Different letters (a-c) represent statistically significant differences among treatments (p < 0.05).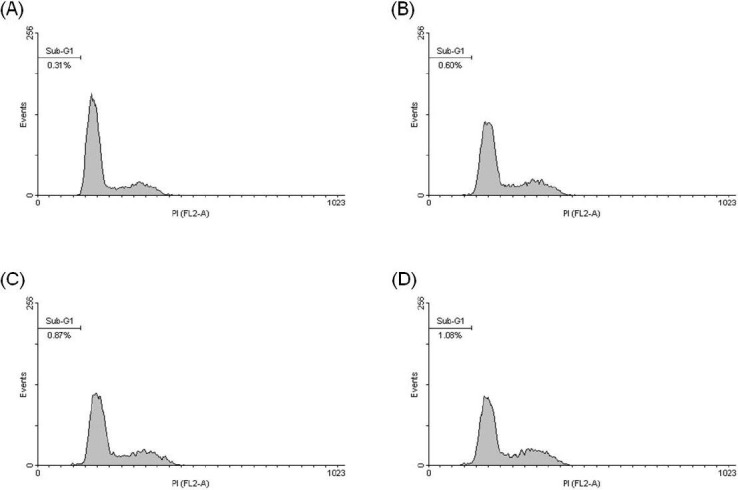
Figure 4
Effect of eburicoic acid on…
Figure 4
Effect of eburicoic acid on percentage of hypodiploid phase in Hep 3B cells…
Figure 4 Effect of eburicoic acid on percentage of hypodiploid phase in Hep 3B cells After incubation of the cells with (A) 0, (B) 10, (C) 20, and (D) 30 μM eburicoic acid for 48 h, percentage of hypodiploid phase (sub-G1 phase) was analyzed by flow cytometry.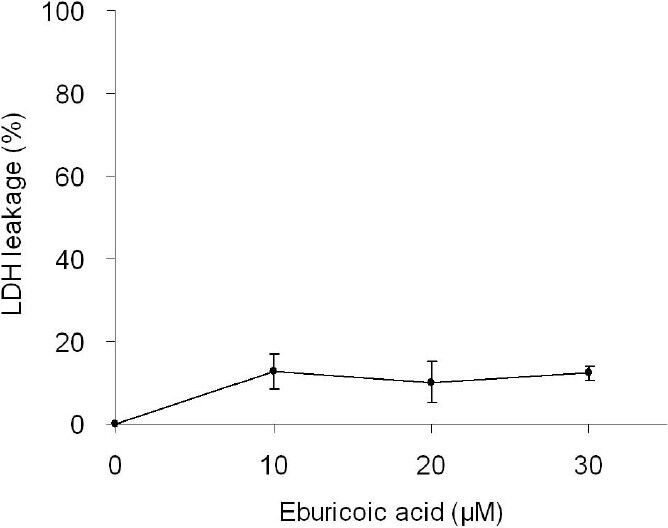
Figure 5
Effect of eburicoic acid on…
Figure 5
Effect of eburicoic acid on degree of cell disruption in Hep 3B cells…
Figure 5 Effect of eburicoic acid on degree of cell disruption in Hep 3B cells After incubation of the cells with 0, 10, 20, and 30 μM eburicoic acid and lysis solution for 24 h, degree of cell disruption was determined by LDH leakage assay. Data are expressed as percentage between positive control (lysis solution) and negative control (0.3% DMSO).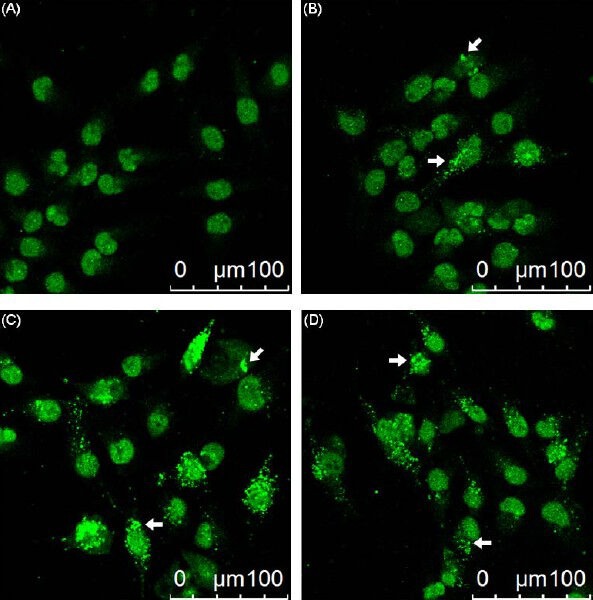
Figure 6
Effect of eburicoic acid on…
Figure 6
Effect of eburicoic acid on LC3 distribution in Hep 3B cells After incubation…
Figure 6 Effect of eburicoic acid on LC3 distribution in Hep 3B cells After incubation of the cells with (A) 0, (B) 10, (C) 20, and (D) 30 μM eburicoic acid for 24 h, LC3 distribution was observed by immunofluorescence. Arrows indicated the autophagosomes/autolysosomes.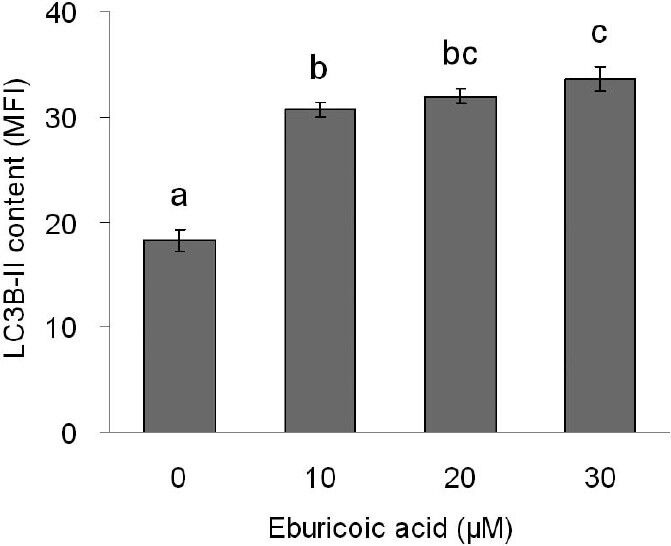
Figure 7
Effect of eburicoic acid on…
Figure 7
Effect of eburicoic acid on amount of autophagosome formation in Hep 3B cells…
Figure 7 Effect of eburicoic acid on amount of autophagosome formation in Hep 3B cells After incubation of the cells with 0, 10, 20, and 30 μM eburicoic acid for 24 h, amount of autophagosome formation was analyzed by flow cytometry. Different letters (a-c) represent statistically significant differences among treatments (p < 0.05).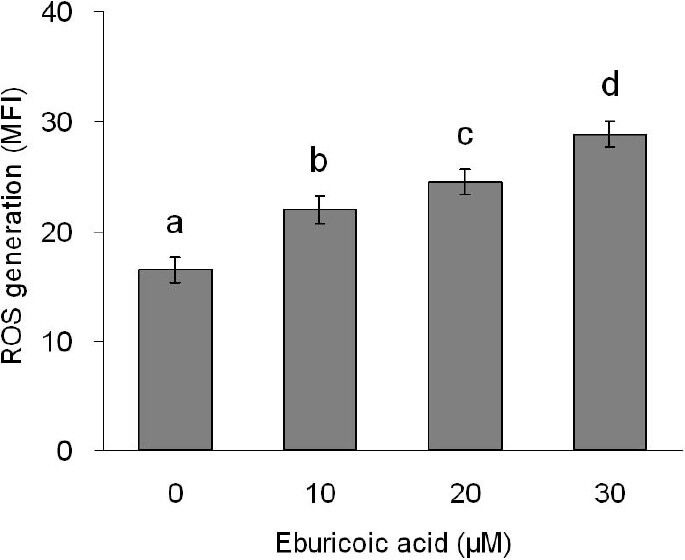
Figure 8
Effect of eburicoic acid on…
Figure 8
Effect of eburicoic acid on ROS generation in Hep 3B cells After incubation…
Figure 8 Effect of eburicoic acid on ROS generation in Hep 3B cells After incubation of the cells with 0, 10, 20, and 30 μM eburicoic acid for 2 h, ROS generation was analyzed by flow cytometry. Different letters (a-d) represent statistically significant differences among treatments (p < 0.05).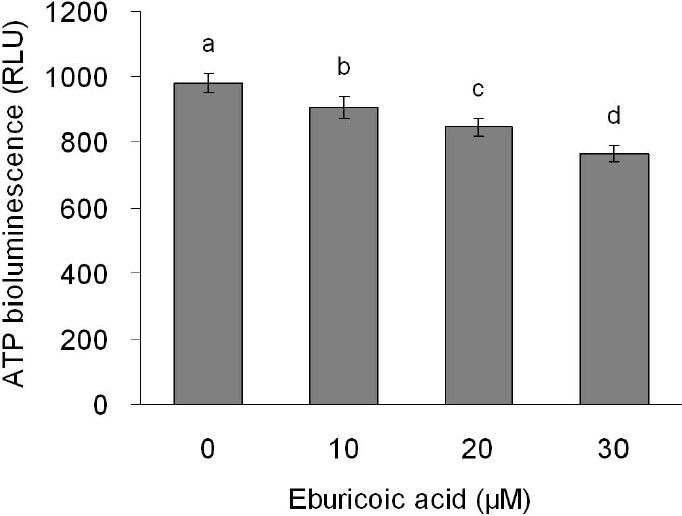
Figure 9
Effect of eburicoic acid on…
Figure 9
Effect of eburicoic acid on ATP level in Hep 3B cells After incubation…
Figure 9 Effect of eburicoic acid on ATP level in Hep 3B cells After incubation of the cells with 0, 10, 20, and 30 μM eburicoic acid for 24 h, ATP level was determined by bioluminescence. Different letters (a-d) represent statistically significant differences among treatments (p < 0.05).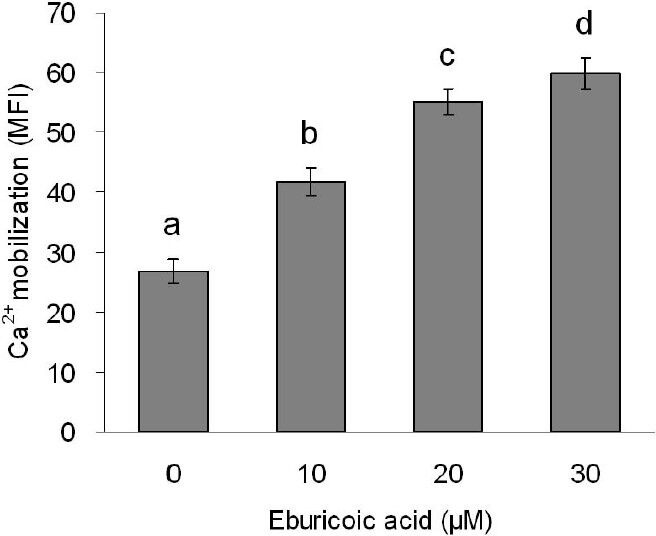
Figure 10
Effect of eburicoic acid on…
Figure 10
Effect of eburicoic acid on Ca 2+ mobilization in Hep 3B cells After…
Figure 10 Effect of eburicoic acid on Ca2+ mobilization in Hep 3B cells After incubation of the cells with 0, 10, 20, and 30 μM eburicoic acid for 30 min, Ca2+ mobilization was analyzed by flow cytometry. Different letters (a-d) represent statistically significant differences among treatments (p < 0.05).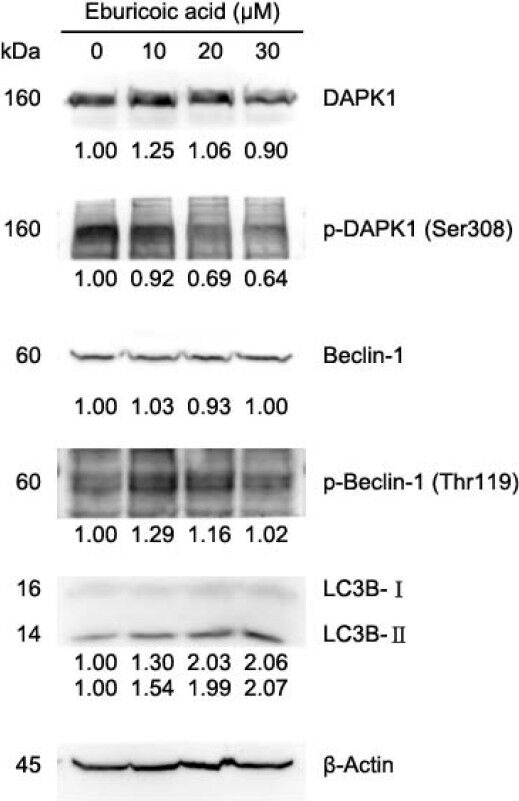
Figure 11
Effect of eburicoic acid on…
Figure 11
Effect of eburicoic acid on expression of Ca 2+ signaling-related proteins and LC3…
Figure 11 Effect of eburicoic acid on expression of Ca2+ signaling-related proteins and LC3 in Hep 3B cells After incubation of the cells with 0, 10, 20, and 30 μM eburicoic acid for 24 h, expression of Ca2+ signaling-related proteins and LC3 were assessed by Western blotting. Protein levels are expressed as multiple of negative control (0.3% DMSO) by β-Actin-normalized densitometry and shown on bottom of each band.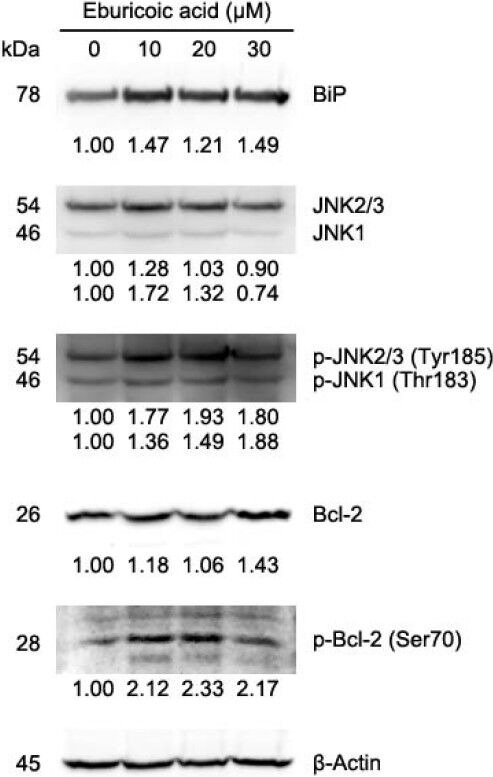
Figure 12
Effect of eburicoic acid on…
Figure 12
Effect of eburicoic acid on expression of unfolded protein response-related proteins in Hep…
Figure 12 Effect of eburicoic acid on expression of unfolded protein response-related proteins in Hep 3B cells After incubation of the cells with 0, 10, 20, and 30 μM eburicoic acid for 24 h, expression of unfolded protein response-related proteins were assessed by Western blotting. Protein levels are expressed as multiple of negative control (0.3% DMSO) by β-Actin-normalized densitometry and shown on bottom of each band.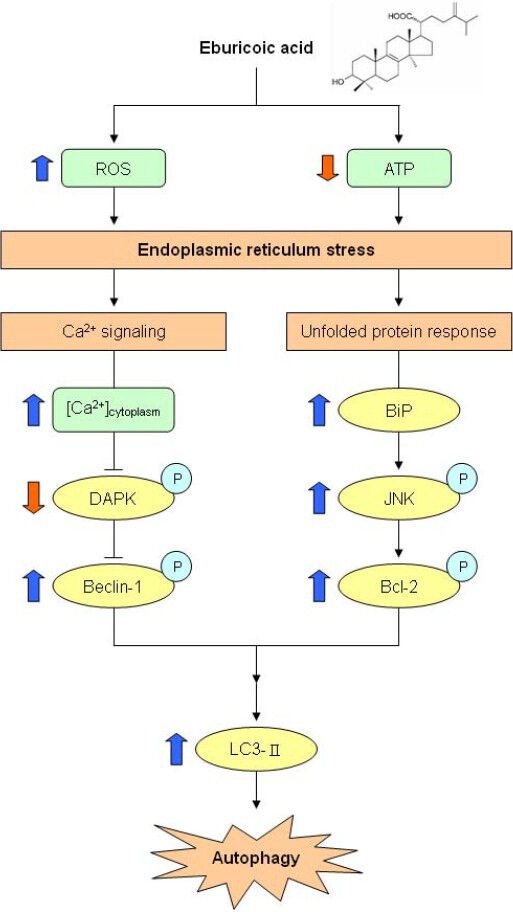
Figure 13
Proposed model of eburicoic acid…
Figure 13
Proposed model of eburicoic acid induced apoptosis in human hepatoma Hep 3B cells…
Figure 13 Proposed model of eburicoic acid induced apoptosis in human hepatoma Hep 3B cells The thick arrows indicated the expression changes in our results. All figures (13)