Coenzyme Q0 from Antrodia cinnamomea in Submerged Cultures Induces Reactive Oxygen Species-Mediated Apoptosis in A549 Human Lung Cancer Cells
Figures
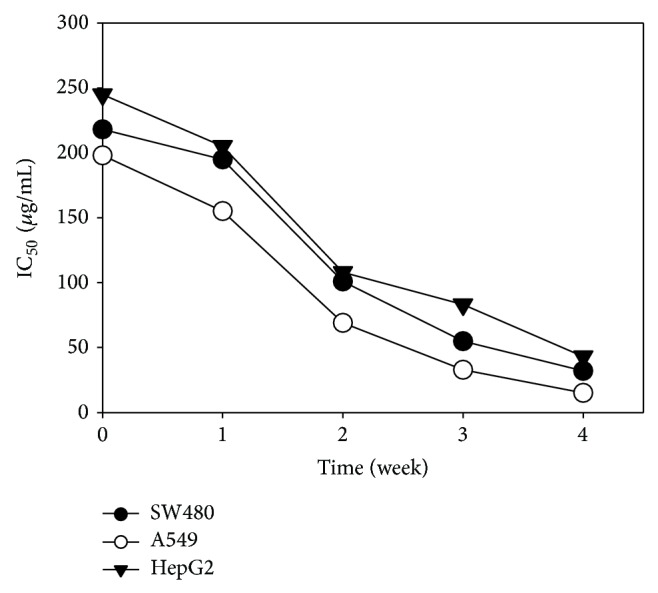
Figure 1
The IC 50 of ACFE…
Figure 1
The IC 50 of ACFE was prepared at different culture times on SW480,…
Figure 1 The IC50 of ACFE was prepared at different culture times on SW480, A549, and HepG2. The IC50 values were measured by the MTT assay as described in the Section 2.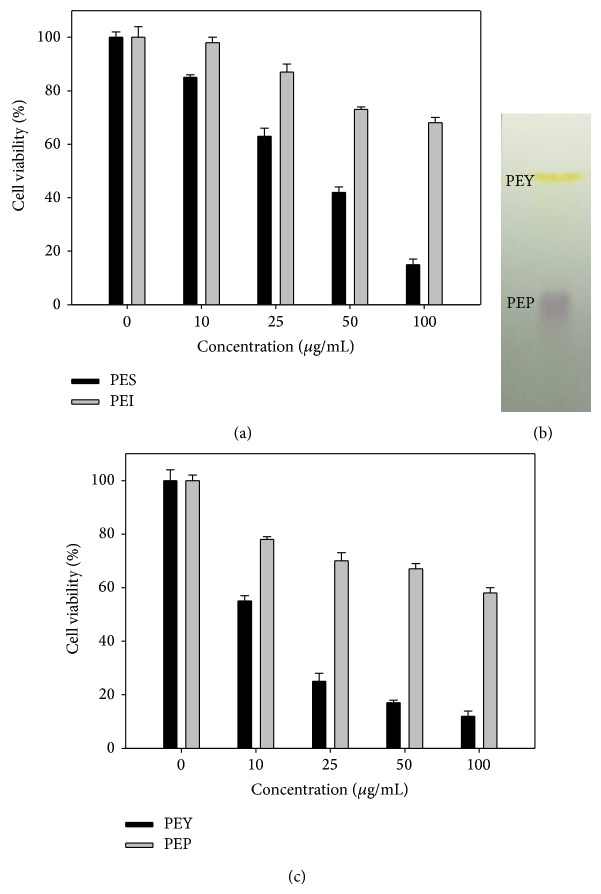
Figure 2
Isolation of anticancer compounds from…
Figure 2
Isolation of anticancer compounds from ACFE prepared at 4-week cultures. (a) Effects of…
Figure 2 Isolation of anticancer compounds from ACFE prepared at 4-week cultures. (a) Effects of PES and PEI fractions on the viability of A549 cells were measured by the MTT assay. (b) PES fraction was separated by TLC using silica gel G-coated plates and chloroform : ethyl acetate (8 : 2) as mobile phase. (c) Effects of PEP and PEY fractions on the viability of A549 cells were measured by the MTT assay. Data shown are representative of three independent experiments with similar results.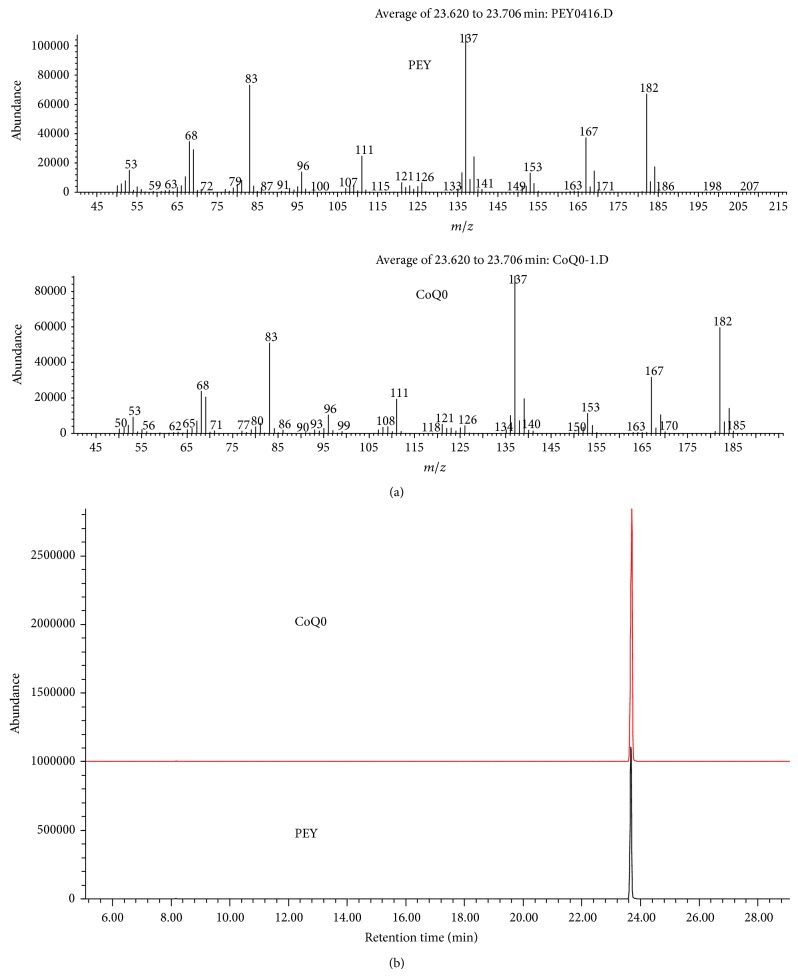
Figure 3
Identification of CoQ0 in PEY…
Figure 3
Identification of CoQ0 in PEY by GC-MS. (a) PEY and the CoQ0 standard…
Figure 3 Identification of CoQ0 in PEY by GC-MS. (a) PEY and the CoQ0 standard were analyzed by GC-MS. (b) Mass spectra (MS-EI) of PEY and the CoQ0 standard.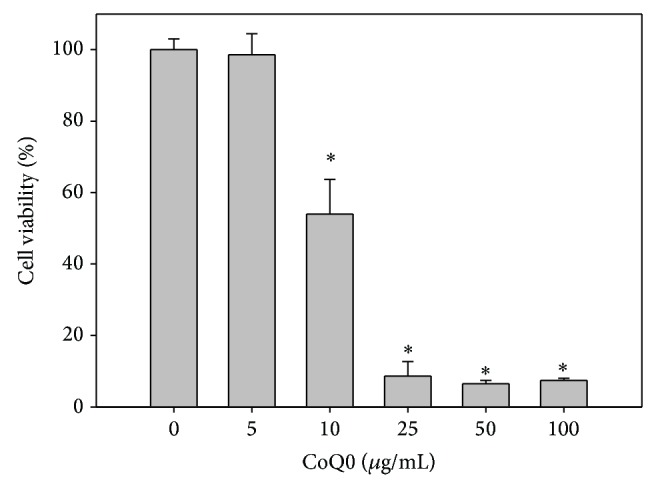
Figure 4
Effect of CoQ0 on the…
Figure 4
Effect of CoQ0 on the viability of A549 cells. A549 cells were treated…
Figure 4 Effect of CoQ0 on the viability of A549 cells. A549 cells were treated with various concentrations of CoQ0 (0 to 100 μg/mL), and cell viability was measured by the MTT assay. Data shown are representative of three independent experiments with similar results. *P < 0.05 versus the control group.
Figure 5
CoQ0 induces apoptosis in A549…
Figure 5
CoQ0 induces apoptosis in A549 cells. A549 cells were treated with CoQ0 (15…
Figure 5 CoQ0 induces apoptosis in A549 cells. A549 cells were treated with CoQ0 (15 μg/mL) for 6 h, and apoptosis was measured by Annexin V/PI staining and flow cytometry. Data shown are representative of three independent experiments with similar results.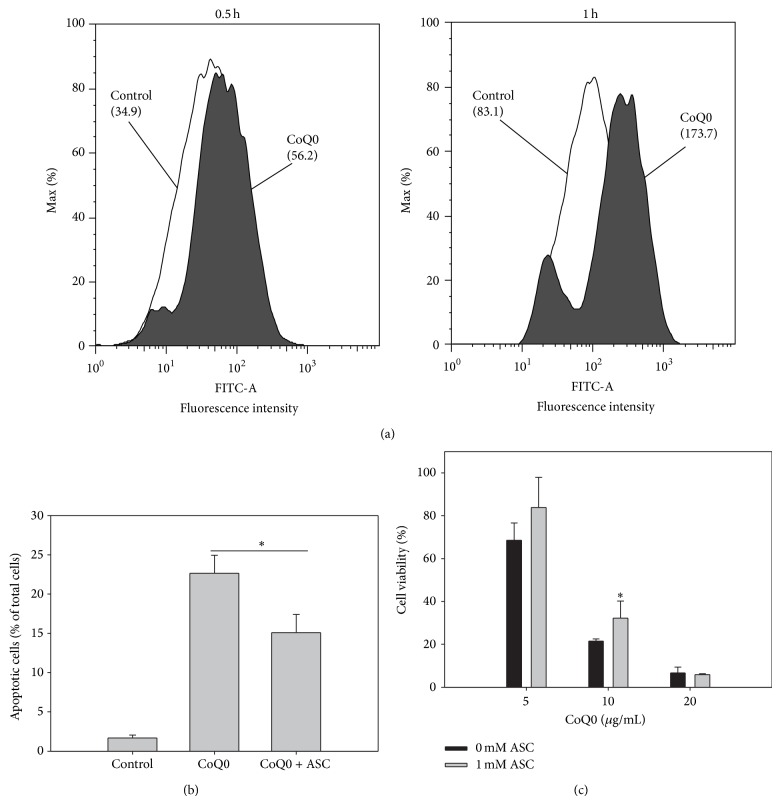
Figure 6
CoQ0 provokes ROS-mediated apoptosis. (a)…
Figure 6
CoQ0 provokes ROS-mediated apoptosis. (a) A549 cells were treated with 15 μ g/mL…
Figure 6 CoQ0 provokes ROS-mediated apoptosis. (a) A549 cells were treated with 15 μg/mL of CoQ0 for 0.5 and 1 h, and the ROS levels were measured by DCF-DA staining and flow cytometry. Numbers in parentheses indicate mean fluorescence intensities. (b) A549 cells were pretreated without or with ASC (1 mM) for 1 h and then incubated with CoQ0 (15 μg/mL) for 6 h. Apoptotic cells were measured by the Annexin V/PI assay. (c) A549 cells were pretreated without or with ASC (1 mM) for 1 h and then incubated with different concentrations of CoQ0 for 24 h. Cell viability was measured by the MTT assay. Data shown are representative of three independent experiments with similar results. *P < 0.05.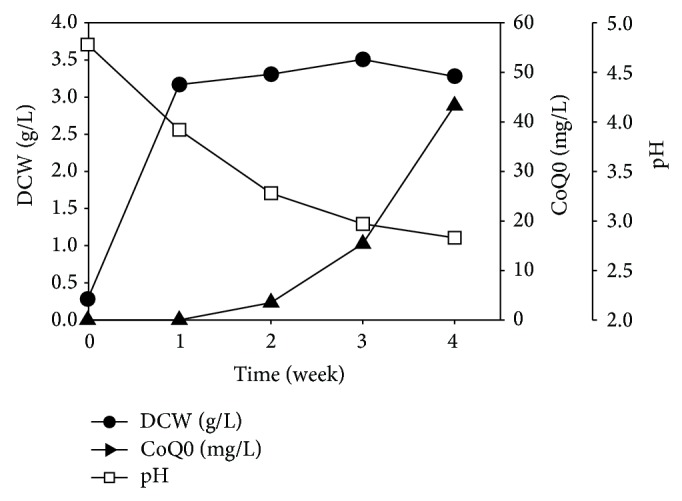
Figure 7
Time course of mycelial growth…
Figure 7
Time course of mycelial growth and CoQ0 production during submerged culture of A.…
Figure 7 Time course of mycelial growth and CoQ0 production during submerged culture of A. cinnamomea in a 5-L fermentor. DCW: dry cell weight. All figures (7)