Coenzyme Q0 From Antrodia cinnamomea Exhibits Drug-Resistant Bacteria Eradication and Keratinocyte Inflammation Mitigation to Ameliorate Infected Atopic Dermatitis in Mouse
Abstract
Atopic dermatitis (AD) is an inflammatory skin disease that is usually accompanied by Staphylococcus aureus infection due to cutaneous barrier-function damage. Benzenoid compounds from Antrodia cinnamomea are known to exhibit antibacterial and anti-inflammatory activities. This study sought to investigate the potential of benzenoids for treating bacteria-infected AD. The compounds were screened against methicillin-resistant S. aureus (MRSA). Coenzyme Q0 (CoQ0), a key ingredient in A. cinnamomea, showed the strongest MRSA growth inhibition. We further tested the inhibitory effect of CoQ0 on planktonic and biofilm MRSA. The work was also performed to explore the potential effectiveness of CoQ0 on AD using activated keratinocytes and in vivo experimental AD mice as the models. The minimum inhibitory concentration (MIC) and minimum bactericidal concentration (MBC) of CoQ0 against MRSA were 7.81 μg/ml. CoQ0 was found to eradicate biofilm MRSA efficiently and reduce the biofilm thickness. CoQ0 killed MRSA by inhibiting DNA polymerase and topoisomerases. A proteomic assay showed that CoQ0 also reduced the ribosomal proteins. In the anti-inflammation study, CoQ0 was found to downregulate the expression of interleukin (IL)-6, chemokine (C-C motif) ligand (CCL)5, and CCL17 in HaCaT cells. CoQ0 at 0.5 μg/ml could recover the filaggrin decreased by HaCaT activation to the normal control. We established a bacteria-infected AD-like model in mice using ovalbumin (OVA) and topically applied MRSA. Topical CoQ0 delivery lessened the MRSA presence in the AD-like lesions by >90%. The erythema, barrier function, and epidermal thickness of the AD-like wounds were improved by CoQ0 through the reduction of IL-1β, IL-4, IL-6, IL-10, interferon (IFN)-γ, and by neutrophil infiltration in the lesional skin. CoQ0 is therefore regarded as effective in mitigating AD symptoms associated with bacterial load.
Figures 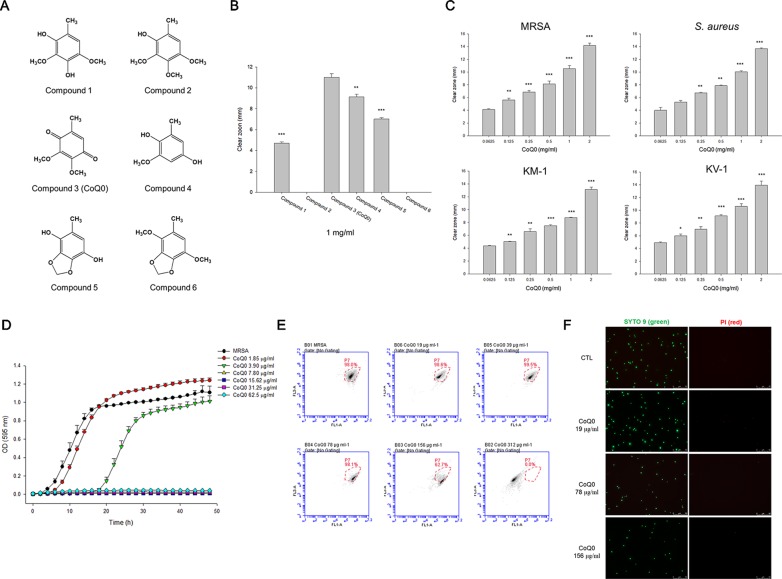
Figure 1
Determination of the antibacterial activity…
Figure 1
Determination of the antibacterial activity of A. cinnamomea extracted benzenoids. (A) The chemical…
Figure 1 Determination of the antibacterial activity of A. cinnamomea extracted benzenoids. (A) The chemical structures of the benzenoids. (B) Zone of inhibition of MRSA treated by benzenoids measured from agar diffusion assay. (C) Zone of inhibition of MRSA, S. aureus, and VISA treated by CoQ0 measured from agar diffusion assay. (D) The growth curves of MRSA treated by CoQ0 at different concentrations within 48 h. (E) The planktonic live/dead MRSA strain determined by flow cytometry. (F) The planktonic live/dead MRSA strain viewed under fluorescence microscopy. Each value represents the mean ± SEM (n = 4). ***p < 0.001; **p < 0.01; *p < 0.05.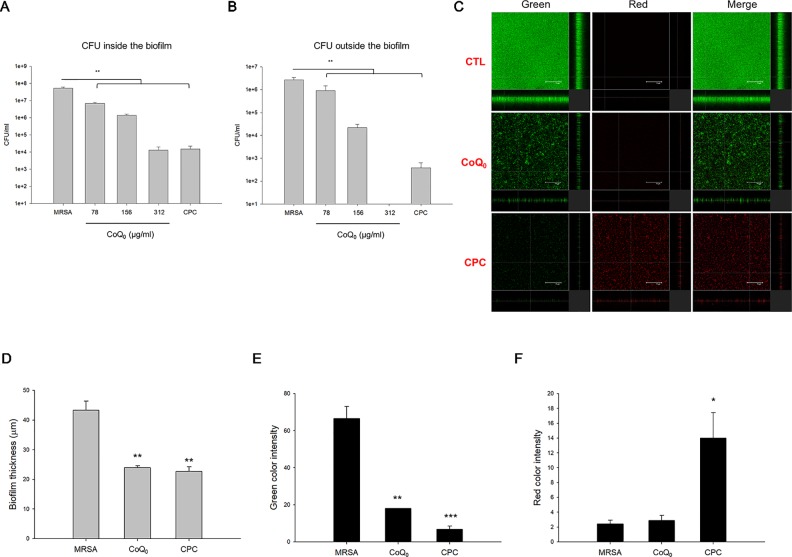
Figure 2
Determination of the biofilm MRSA…
Figure 2
Determination of the biofilm MRSA inhibition by CoQ 0 . (A) MRSA CFU…
Figure 2 Determination of the biofilm MRSA inhibition by CoQ0. (A) MRSA CFU inside the biofilm. (B) MRSA CFU outside the biofilm. (C) The three-dimensional images of biofilm analyzed by CLSM. (D) The corresponding biofilm thickness analyzed by CLSM. (E) Quantification of green fluorescence intensity (live bacteria) of MRSA biofilm. (F) Quantification of red fluorescence intensity (dead bacteria) of MRSA biofilm. Each value represents the mean ± SEM (n = 4). ***p < 0.001; **p < 0.01; *p < 0.05.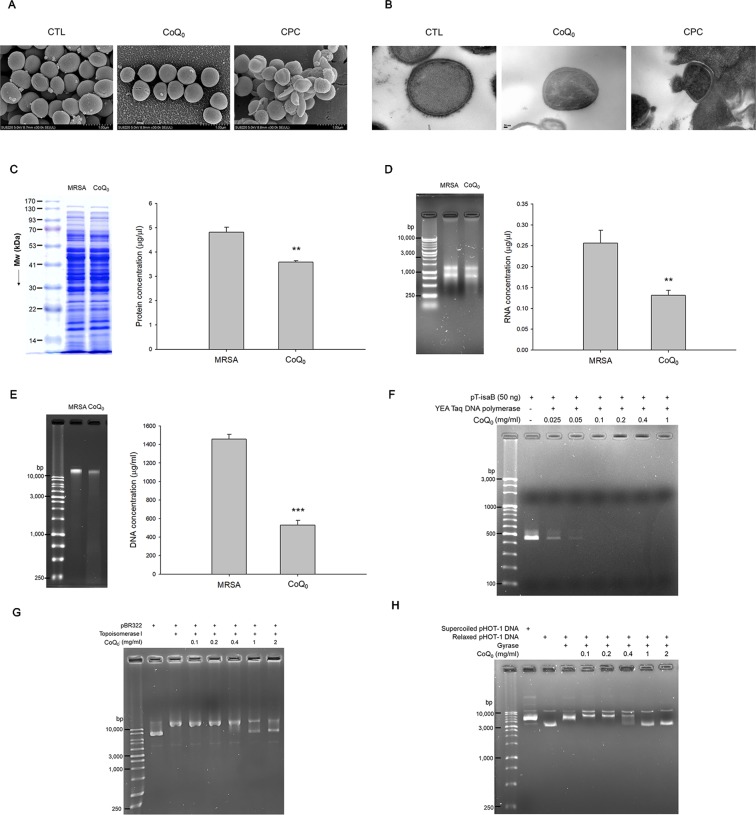
Figure 3
Anti-MRSA mechanisms of CoQ 0…
Figure 3
Anti-MRSA mechanisms of CoQ 0 . (A) Morphological changes of MRSA viewed under…
Figure 3 Anti-MRSA mechanisms of CoQ0. (A) Morphological changes of MRSA viewed under SEM. (B) Morphological changes of MRSA viewed under TEM. (C) Total protein amount in MRSA. (D) Total RNA amount in MRSA. (E) Total DNA amount in MRSA. (F) Taq DNA polymerase in PCR. (G) Topoisomerase I in wrapping assay; (H) DNA gyrase in wrapping assay. Each value represents the mean ± SEM (n = 4). ***p < 0.001; **p < 0.01.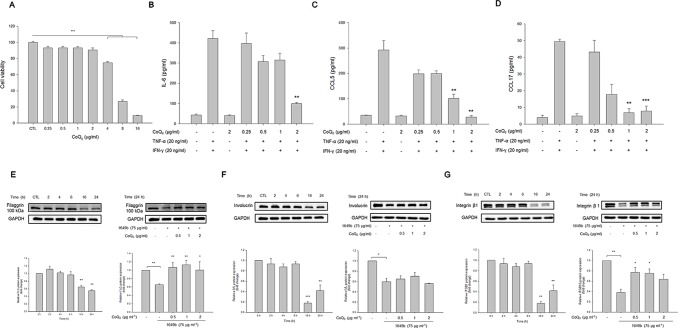
Figure 4
CoQ 0 suppresses TNF-α- and…
Figure 4
CoQ 0 suppresses TNF-α- and IFN-γ-stimulated cytokines/chemokines and recovers TJ-protein deficiency in HaCaT…
Figure 4 CoQ0 suppresses TNF-α- and IFN-γ-stimulated cytokines/chemokines and recovers TJ-protein deficiency in HaCaT cells. (A) The cell viability measured by MTT assay. (B) IL-6 in stimulated HaCaT measured by ELISA. (C) CCL5 in stimulated HaCaT measured by ELISA. (D) CCL17 in stimulated HaCaT measured by ELISA. (E) Filaggrin in stimulated HaCaT measured by immunoblotting. (F) Involucrin in stimulated HaCaT measured by immunoblotting. (G) Integrin β1 in stimulated HaCaT measured by immunoblotting. Each value represents the mean ± SEM (n = 4). ***p < 0.001; **p < 0.01; *p < 0.05.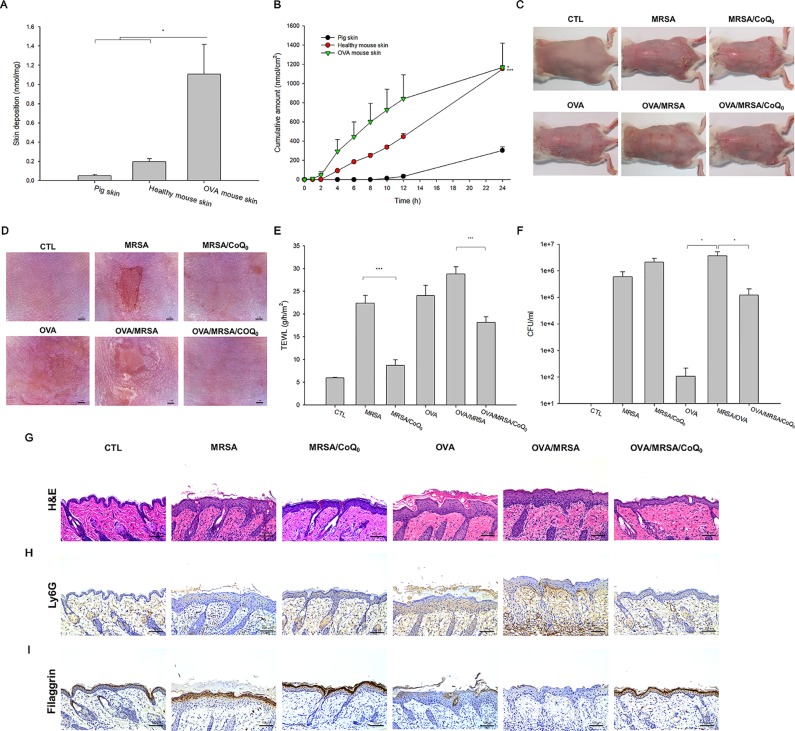
Figure 5
In vitro skin absorption of…
Figure 5
In vitro skin absorption of CoQ 0 and in vivo topical application of…
Figure 5 In vitro skin absorption of CoQ0 and in vivo topical application of CoQ0 against MRSA-infected AD-like lesion. (A) In vitro skin deposition of CoQ0 in Franz cell using pig, healthy mouse, and OVA-treated mouse skins. (B) In vitro skin permeation to receptor of CoQ0 in Franz cell using pig, healthy mouse, and OVA-treated mouse skins. (C) The gross images of mouse back skin. (D) The close-up imaging by handheld digital microscopy. (E) TEWL of mice skin. (F) MRSA CFU of mice skin. (G) Skin sections represented by H&E staining. (H) Skin sections represented by Ly6G staining for observing neutrophils. (I) Skin sections represented by filaggrin staining for observing TJ distribution. Each value represents the mean ± SEM (n = 6). ***p < 0.001; *p < 0.05.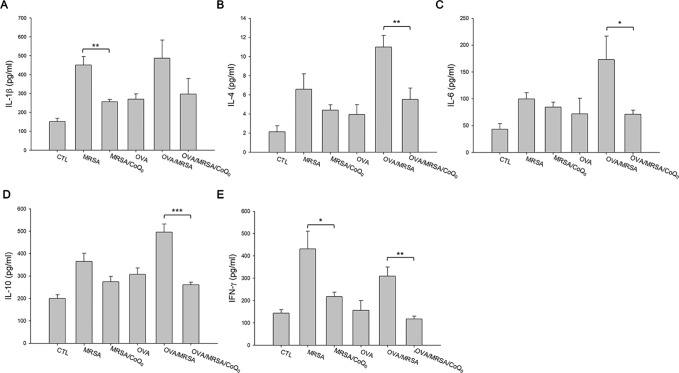
Figure 6
CoQ 0 inhibits AD-like mouse…
Figure 6
CoQ 0 inhibits AD-like mouse skin inflammation based on cytokine assay. (A) IL-1β.…
Figure 6 CoQ0 inhibits AD-like mouse skin inflammation based on cytokine assay. (A) IL-1β. (B) IL-4. (C) IL-6. (D) IL-10. (E) IFN-γ. Each value represents the mean ± SEM (n = 6). ***p < 0.001; **p < 0.01; *p < 0.05.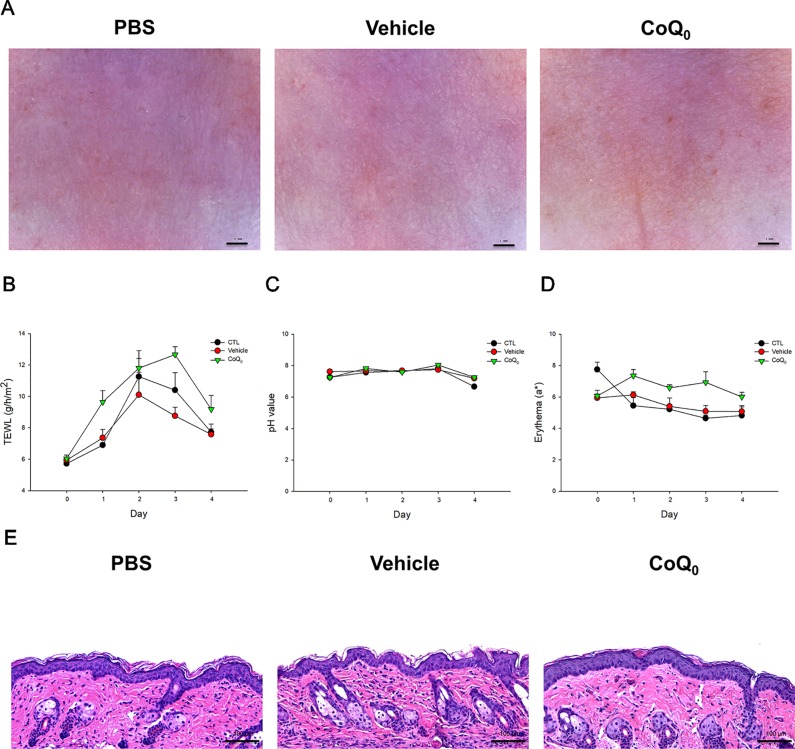
Figure 7
In vivo skin tolerance examination…Figure 7
In vivo skin tolerance examination after a 4-day application of topically applied CoQ… Figure 7 In vivo skin tolerance examination after a 4-day application of topically applied CoQ0 on mice. (A) The close-up imaging by handheld digital microscopy. (B) TEWL measurement. (C) Skin surface pH value. (D) Erythema measurement. (E) Skin sections represented by H&E staining. Each value represents the mean ± SEM (n = 6). All figures (7)