4-Acetylantroquinonol B Suppresses Prostate Cancer Growth and Angiogenesis via a VEGF/PI3K/ERK/mTOR-Dependent Signaling Pathway in Subcutaneous Xenograft and In Vivo Angiogenesis Models
Abstract
Prostate cancer is a major cause of cancer-related mortality in men in developed countries. The compound, 4-acetylantroquinonol B (4AAQB), is isolated from Antrodia cinnamomea (commonly known as Niu-Chang-Chih), which has been shown to inhibit cancer growth. However, the anticancer activity of 4AAQB has not previously been examined in prostate cancer. This study aimed to investigate the effect of 4AAQB on cancer and angiogenesis, as well as to explore its mechanism of action. Human prostate cancer cells (PC3) and human umbilical vein endothelial cells (HUVEC) were used in cell viability, cell migration, and cell cycle functional assays to evaluate the anticancer and antiangiogenic efficacy of 4AAQB in vitro. The effects of 4AAQB in vivo were determined using xenograft and angiogenesis models. The signaling events downstream of 4AAQB were also examined. The 4AAQB compound inhibited PC3 cell growth and migration, and reduced in vivo cancer growth, as shown in a subcutaneous xenograft model. Furthermore, 4AAQB inhibited HUVEC migration, tube formation, and aortic ring sprouting; it also reduced neovascularization in a Matrigel implant angiogenesis assay in vivo. The 4AAQB compound also decreased metastasis in the PC3 prostate cancer model in vivo. Serum or vascular endothelial growth factor (VEGF)-induced VEGF receptor 2 (VEGFR2), phosphoinositide 3-kinase (PI3K)/Ak strain transforming (Akt), and extracellular signal-regulated kinase ½ (ERK ½) phosphorylation were attenuated by 4AAQB in both PC3 and HUVEC. In conclusion, 4AAQB is a potential candidate for prostate cancer therapy.
Figures 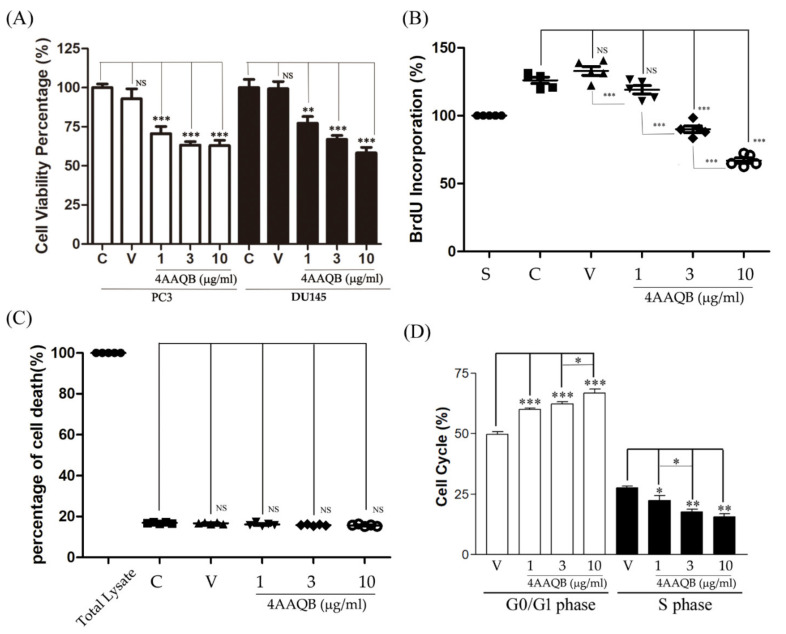
Figure 1
The effects of 4AAQB on…
Figure 1
The effects of 4AAQB on prostate cancer cell viability, cytotoxicity, and cell cycle:…
Figure 1 The effects of 4AAQB on prostate cancer cell viability, cytotoxicity, and cell cycle: (A) PC3 cell viability was detected via an MTT assay and DU145 cell viability was detected via an SRB assay; (B) the antiproliferation effect of 4AAQB in PC3 cell was detected via a BrdU assay. Data are represented as means ± SEM (n = 5); (C) LDH release was detected according to the manufacturer’s protocol. Data are represented as means ± SEM (n = 6); (D) PC3 cells were treated with a vehicle (V) or 4AAQB and analyzed by flow cytometry. The cell cycle distribution is shown as percentages in the cell cycle phases. Data are represented as means ± SEM (n = 6). * p < 0.05, ** p < 0.01, and *** p < 0.001 compared to the control (C) or vehicle (V) groups. S indicates the starvation group. NS: non-significance.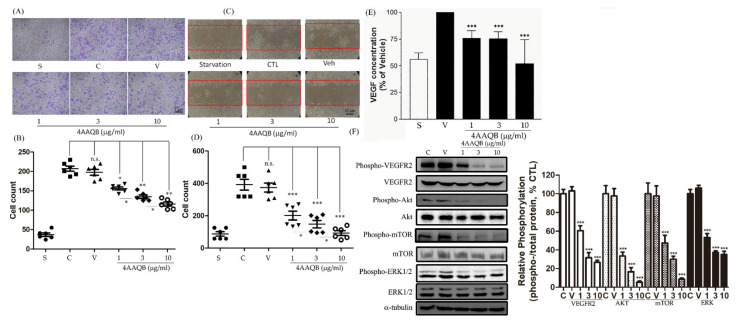
Figure 2
The compound, 4AAQB, inhibits PC3…
Figure 2
The compound, 4AAQB, inhibits PC3 cell migration, VEGF production, and signaling pathway proteins…
Figure 2 The compound, 4AAQB, inhibits PC3 cell migration, VEGF production, and signaling pathway proteins phosphorylation. (A) Migrated PC3 cells in the underside filter membrane were quantified (three fields per filter) by phase-contrast light microscopy. Data are represented as means ± SEM (n = 6). The cell number were calculated and are shown in (B); (C) wound-healing migration of PC3 cell monolayers treated with the vehicle or various doses of 4AAQB for 24 h. Data are represented as means ±SEM (n = 6). The cell numbers were calculated and are shown in (D); (E) VEGF protein expression was evaluated by ELISA and data are represented as means ± SEM (n = 6); (F) the PC3 cells’ protein phosphorylation was detected by Western blotting. Relative phosphorylation of protein is presented as mean density for the ratio between phosphorylated protein and total protein as determined by ImageJ. Data are represented as means ± SEM (n = 3). * p < 0.05, ** p < 0.01, and *** p < 0.001 compared to the control (C) or vehicle (V) groups. S indicates the starvation group. NS: non-significance.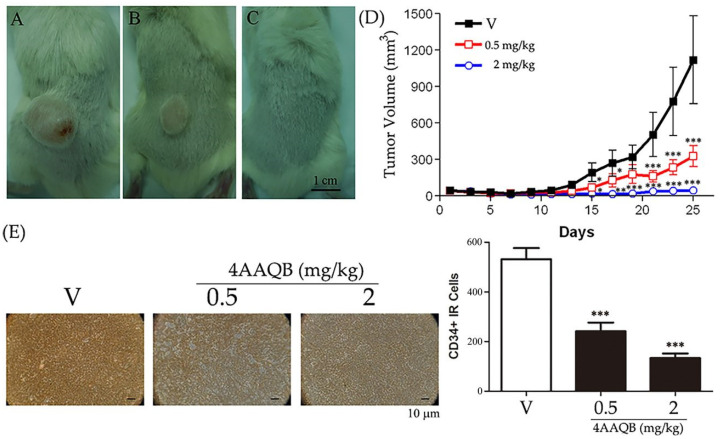
Figure 3
Anticancer effects of 4AAQB in…
Figure 3
Anticancer effects of 4AAQB in in vivo models: SCID mice administered with the…
Figure 3 Anticancer effects of 4AAQB in in vivo models: SCID mice administered with the vehicle or indicated dosage of 4AAQB are displayed in (A–C) (vehicle (V), 0.5 mg/kg, and 2 mg/kg, respectively); the tumor volumes of the xenograft models are shown in (D); data are represented as means ± SEM (n = 8); (E) expression of CD34 in the cancer xenograft was revealed by staining, and the CD34-immunoreactive (IR) cells were counted. Data are represented as means ± SEM (n = 6). Scale bar = 1 cm (A–C) or 10 μm (E). * p < 0.05, ** p < 0.01, and *** p < 0.001 compared to the vehicle (V).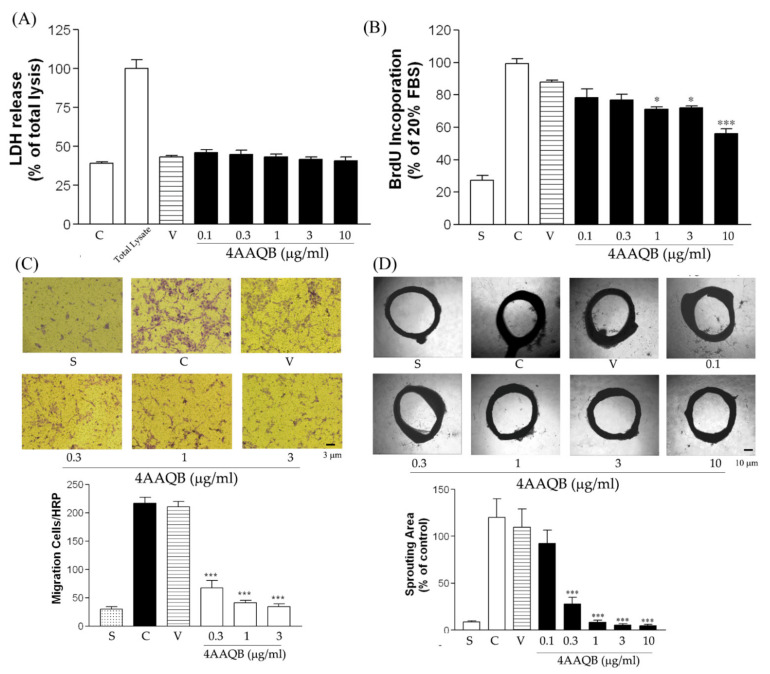
Figure 4
The effects of 4AAQB on…
Figure 4
The effects of 4AAQB on HUVEC proliferation and in vitro and ex vivo…
Figure 4 The effects of 4AAQB on HUVEC proliferation and in vitro and ex vivo migration: (A) LDH release was detected according to the manufacturer’s protocol. Data are represented as means ± SEM (n = 6); (B) HUVEC cell viability was detected by the BrdU assay. Data are represented as means ± SEM (n = 4); (C) migrated HUVEC in the underside filter membrane were quantified (three fields per filter) by phase-contrast light microscopy. Data are represented as means ± SEM (n = 6). The cell numbers were calculated; (D) rat aortic rings were photographed and the sprouting area was calculated and represented as mean ±SEM (n = 6). * p < 0.05 and *** p < 0.001 as compared to the control (C) groups. S indicates the starvation group.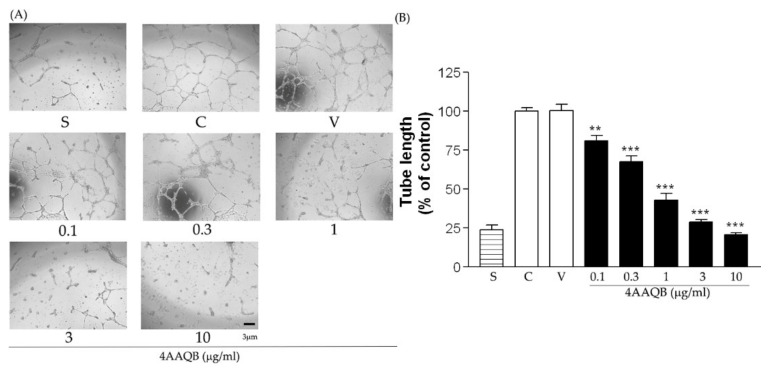
Figure 5
The effects of 4AAQB on…
Figure 5
The effects of 4AAQB on HUVEC Matrigel tube formation. HUVEC treated with VEGF,…
Figure 5 The effects of 4AAQB on HUVEC Matrigel tube formation. HUVEC treated with VEGF, with the vehicle (V), or various concentrations of 4AAQB were photographed (A), and the tube length were quantitatively analyzed as the fold change relative to the control group (B). Data are represented as means ± SEM (n = 6). ** p < 0.01 and *** p < 0.001 compared with the control (C) group.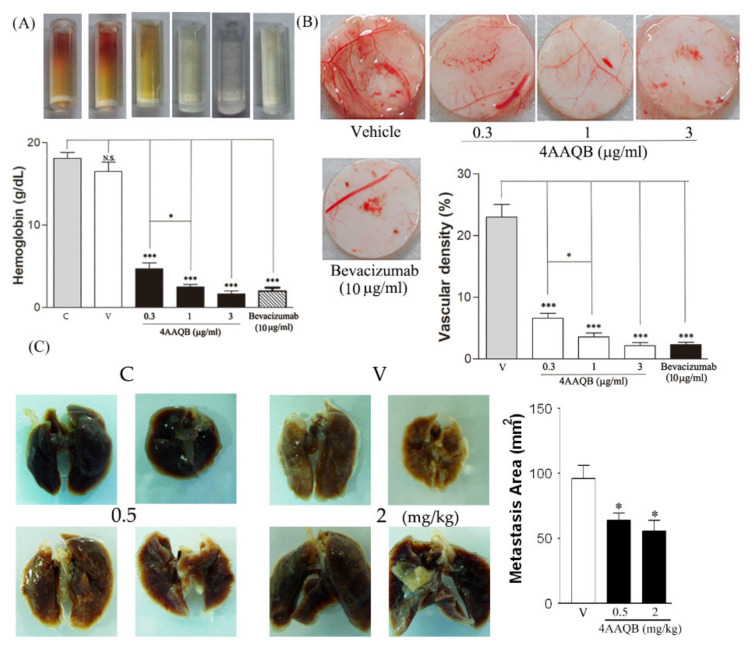
Figure 6
The effect of 4AAQB on…
Figure 6
The effect of 4AAQB on the in vivo angiogenesis model. ( A )…
Figure 6 The effect of 4AAQB on the in vivo angiogenesis model. (A) DIVAA tubes were photographed and the hemoglobin level was measured. Data are represented as means ± SEM (n = 6); (B) the blood vascular densities of CAMs were calculated and is represented as mean ±SEM (n = 5); (C) the PC3 cells’ metastasis area of the lung surface is shown in white, and the background, in dark red. The white area was quantified using the ImageJ software. Data are represented as means ± SEM (n = 8). * p < 0.05 and *** p < 0.001 compared to the control (C) or vehicle (V) groups.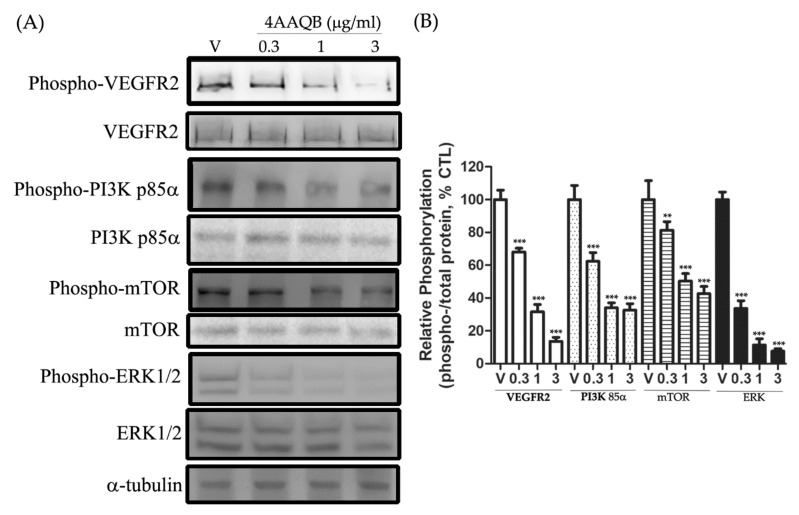
Figure 7
The effect of 4AAQB on…
Figure 7
The effect of 4AAQB on VEGF-R2/PI3 p85α/mTOR/ERK pathways: ( A ) The inhibition…
Figure 7 The effect of 4AAQB on VEGF-R2/PI3 p85α/mTOR/ERK pathways: (A) The inhibition effect of various concentrations of 4AAQB on the VEGFR2, PI3K, mTOR, and ERK pathways in HUVEC were detected by Western blotting; (B) relative phosphorylation of protein is presented as mean density for the ratio between phosphorylated protein and total protein as determined by ImageJ and the data are represented as means ± SEM (n = 5). ** p < 0.01 and *** p < 0.001 compared to the vehicle (V) group.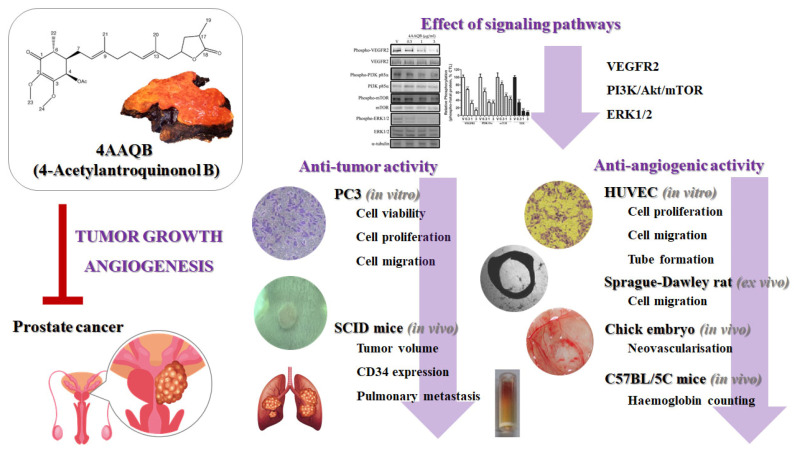
Figure 8
4AAQB inhibits cancer growth and…
Figure 8
4AAQB inhibits cancer growth and angiogenesis via a VEGF/PI3K/mTOR/ERK-dependent signaling pathway.
Figure 8 4AAQB inhibits cancer growth and angiogenesis via a VEGF/PI3K/mTOR/ERK-dependent signaling pathway. All figures (8)