4-Acetylantroquinonol B Inhibits Osteoclastogenesis by Inhibiting the Autophagy Pathway in a Simulated Microgravity Model
Abstract
Astronauts suffer from 1-2% bone loss per month during space missions. Targeting osteoclast differentiation has been regarded as a promising strategy to prevent osteoporosis in microgravity (μXg). 4-acetylantroquinonol B (4-AAQB), a ubiquinone from Antrodia cinnamomea, has shown anti-inflammatory and anti-hepatoma activities. However, the effect of 4-AAQB on μXg-induced osteoclastogenesis remains unclear. In this study, we aimed to explore the mechanistic impact of 4-AAQB on osteoclast formation under μXg conditions. The monocyte/macrophage-like cell line RAW264.7 was exposed to simulated μXg (Rotary Cell Culture System; Synthecon, Houston, TX, USA) for 24 h and then treated with 4-AAQB or alendronate (ALN) and osteoclast differentiation factor receptor activator of nuclear factor kappa-B ligand (RANKL). Osteoclastogenesis, bone resorption activity, and osteoclast differentiation-related signaling pathways were analyzed using tartrate-resistant acid phosphatase (TRAP) staining, actin ring fluorescent staining, bone resorption, and western blotting assays. Based on the results of TRAP staining, actin ring staining, and bone resorption assays, we found that 4-AAQB significantly inhibited μXg-induced osteoclast differentiation. The critical regulators of osteoclast differentiation, including nuclear factor of activated T-cells cytoplasmic 1 (NFATc1), c-Fos, and dendritic cell-specific transmembrane protein (DC-STAMP), were consistently decreased. Meanwhile, osteoclast apoptosis and cell cycle arrest were also observed along with autophagy suppression. Interestingly, the autophagy inhibitors 3-methyladenine (3-MA) and chloroquine (CQ) showed similar effects to 4-AAQB. In conclusion, we suggest that 4-AAQB may serve as a potential agent against μXg-induced osteoclast formation.
Figures 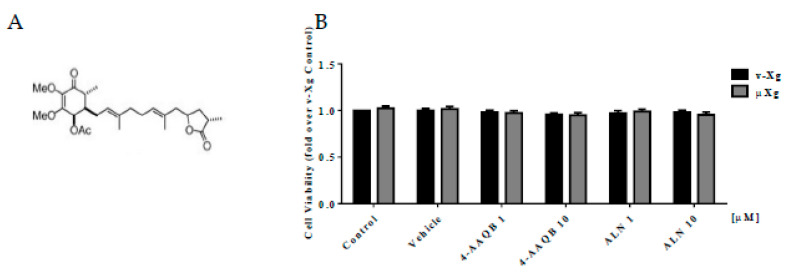
Figure 1
Effects of 4-AAQB on RAW264.7…
Figure 1
Effects of 4-AAQB on RAW264.7 cell viability. Chemical structure of 4-AAQB ( A…
Figure 1 Effects of 4-AAQB on RAW264.7 cell viability. Chemical structure of 4-AAQB (A). Cell viability was assayed by alamarBlue for 2 h after cell stimulation with v-Xg or µXg for 24 h (B). The quantitative results are presented as the mean ± SEM (n = 3).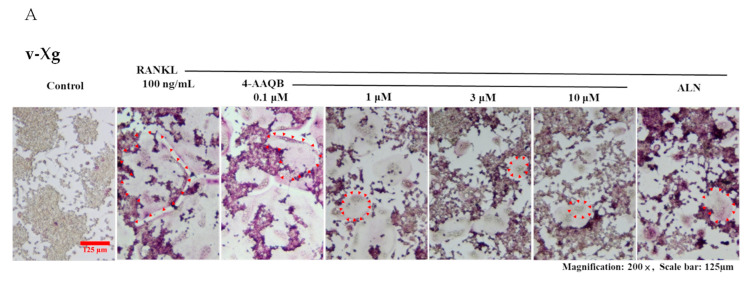
Figure 2
4-AAQB attenuation of osteoclast formation…
Figure 2
4-AAQB attenuation of osteoclast formation after v-Xg and µXg stimulation. After exposure in…
Figure 2 4-AAQB attenuation of osteoclast formation after v-Xg and µXg stimulation. After exposure in v-Xg (A) or µXg (B) for 24 h, and the cells were treated with 4-AAQB (0.1, 1, 3, or 10 µM) or ALN (10 µM) combined with RANKL for 72 h. The quantitative results of the number of TRAP (+) osteoclasts/well (C) and area of TRAP (+) osteoclasts (%) (D) represent the mean ± SEM (n = 6). In addition, fluorescent staining (actin ring and DAPI; (E,F)) and quantitative results (number of actin rings/well; (G)) were conducted. Osteoclasts or actin rings are indicated by red arrows. Orange rectangles represent the areas magnified 200 times. *** p < 0.001 versus control; # p < 0.05, ## p < 0.01, and ### p < 0.001 versus RANKL; ++ p < 0.01 and +++ p < 0.001 versus v-Xg.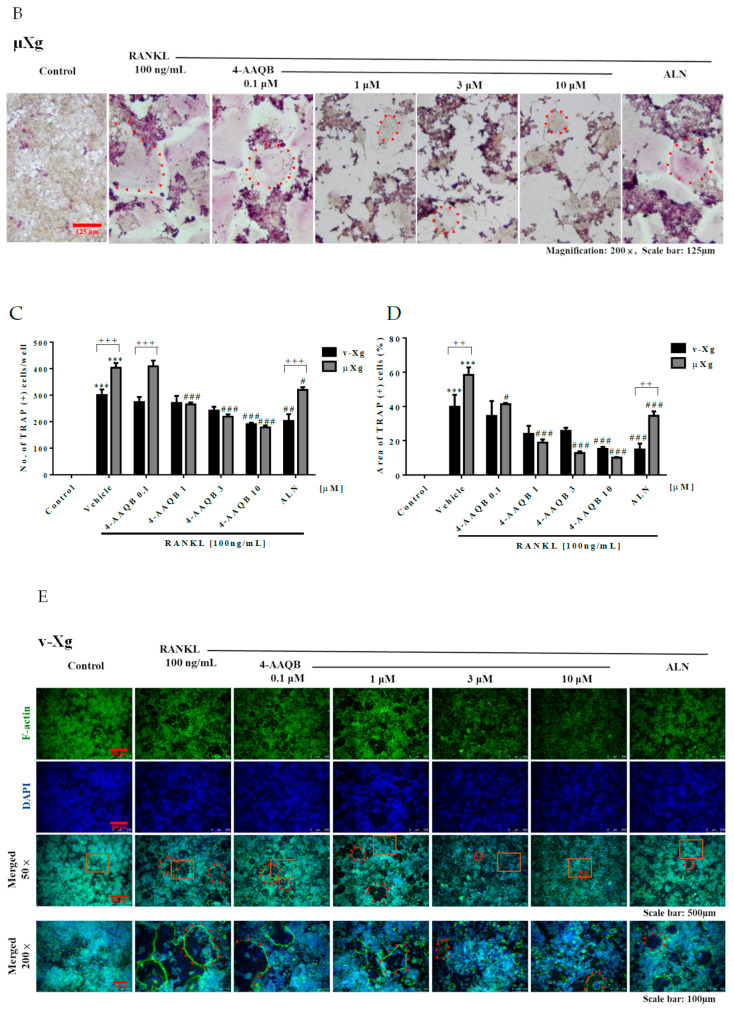
Figure 2
4-AAQB attenuation of osteoclast formation…
Figure 2
4-AAQB attenuation of osteoclast formation after v-Xg and µXg stimulation. After exposure in…
Figure 2 4-AAQB attenuation of osteoclast formation after v-Xg and µXg stimulation. After exposure in v-Xg (A) or µXg (B) for 24 h, and the cells were treated with 4-AAQB (0.1, 1, 3, or 10 µM) or ALN (10 µM) combined with RANKL for 72 h. The quantitative results of the number of TRAP (+) osteoclasts/well (C) and area of TRAP (+) osteoclasts (%) (D) represent the mean ± SEM (n = 6). In addition, fluorescent staining (actin ring and DAPI; (E,F)) and quantitative results (number of actin rings/well; (G)) were conducted. Osteoclasts or actin rings are indicated by red arrows. Orange rectangles represent the areas magnified 200 times. *** p < 0.001 versus control; # p < 0.05, ## p < 0.01, and ### p < 0.001 versus RANKL; ++ p < 0.01 and +++ p < 0.001 versus v-Xg.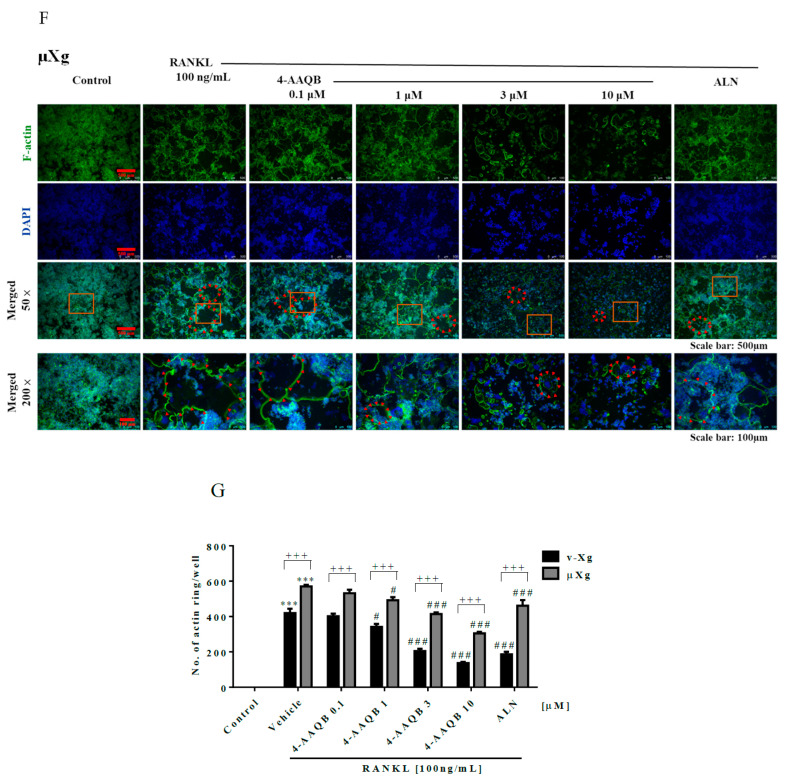
Figure 2
4-AAQB attenuation of osteoclast formation…
Figure 2
4-AAQB attenuation of osteoclast formation after v-Xg and µXg stimulation. After exposure in…
Figure 2 4-AAQB attenuation of osteoclast formation after v-Xg and µXg stimulation. After exposure in v-Xg (A) or µXg (B) for 24 h, and the cells were treated with 4-AAQB (0.1, 1, 3, or 10 µM) or ALN (10 µM) combined with RANKL for 72 h. The quantitative results of the number of TRAP (+) osteoclasts/well (C) and area of TRAP (+) osteoclasts (%) (D) represent the mean ± SEM (n = 6). In addition, fluorescent staining (actin ring and DAPI; (E,F)) and quantitative results (number of actin rings/well; (G)) were conducted. Osteoclasts or actin rings are indicated by red arrows. Orange rectangles represent the areas magnified 200 times. *** p < 0.001 versus control; # p < 0.05, ## p < 0.01, and ### p < 0.001 versus RANKL; ++ p < 0.01 and +++ p < 0.001 versus v-Xg.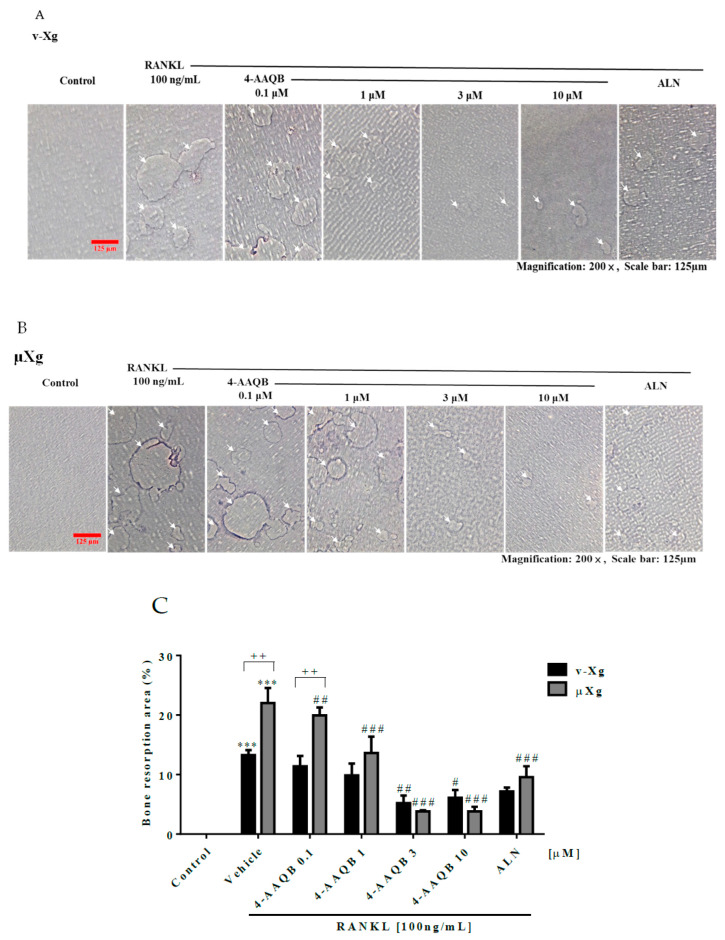
Figure 3
4-AAQB attenuation of osteoclast resorption…
Figure 3
4-AAQB attenuation of osteoclast resorption ability after v-Xg and µXg stimulation. After exposure…
Figure 3 4-AAQB attenuation of osteoclast resorption ability after v-Xg and µXg stimulation. After exposure in v-Xg (A) or µXg (B) for 24 h, and the cells were cultured in osteo assay 96-well plates and treated with 4-AAQB (0.1, 1, 3, or 10 µM) or ALN (10 µM) combined with RANKL for 120 h. The bone resorption area (%) (C) quantitative results represent the mean ± SEM (n = 4). White arrows indicate the resorption pits. *** p < 0.001 versus control; # p < 0.05, ## p < 0.01, and ### p < 0.001 versus RANKL; ++ p < 0.01 versus v-Xg.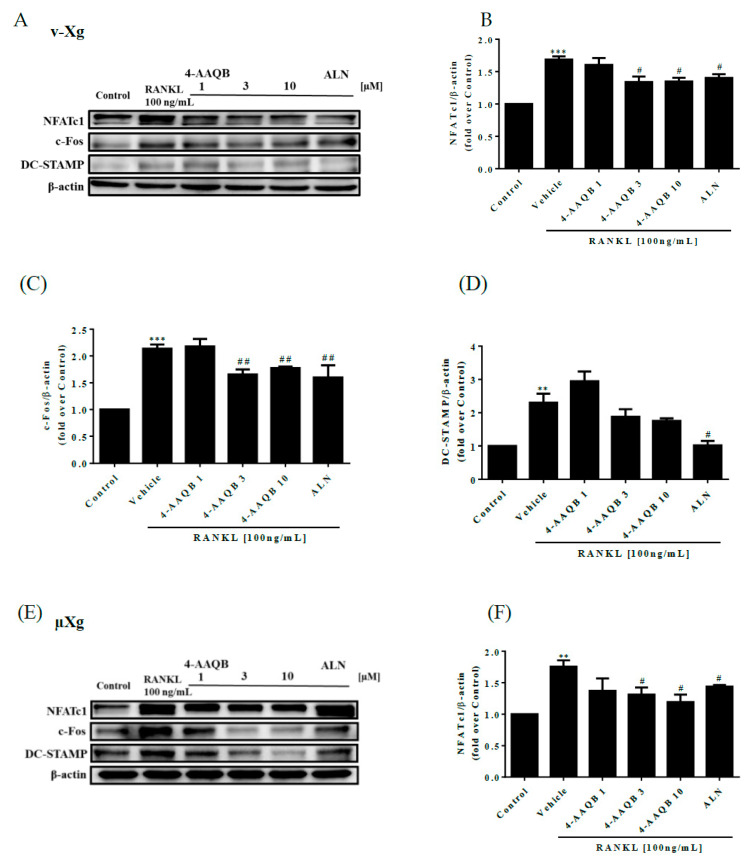
Figure 4
Effects of 4-AAQB on the…
Figure 4
Effects of 4-AAQB on the osteoclastogenesis signaling pathway. Osteoclastogenesis proteins were assayed by…
Figure 4 Effects of 4-AAQB on the osteoclastogenesis signaling pathway. Osteoclastogenesis proteins were assayed by western blotting after exposure to v-Xg (A) conditions for 24 h. The cells were treated with 4-AAQB (1, 3, or 10 µM) or ALN (10 µM) combined with RANKL for 54 h. The quantitative results of NFATc1 (B), c-Fos (C), and DC-STAMP (D) represent the mean ± SEM (n = 3). In addition, after exposure to μXg (E) conditions for 24 h, the cells were treated under the same stimulation conditions as the v-Xg group for 48 h. The quantitative results (F–H) represent the mean ± SEM (n = 3). * p < 0.05, **p < 0.01 and *** p < 0.001 versus control; # p < 0.05, ## p < 0.01, and ### p < 0.001 versus RANKL.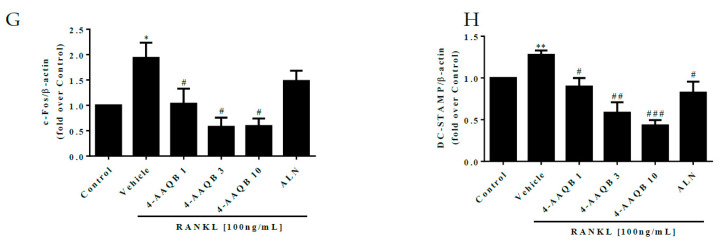
Figure 4
Effects of 4-AAQB on the…
Figure 4
Effects of 4-AAQB on the osteoclastogenesis signaling pathway. Osteoclastogenesis proteins were assayed by…
Figure 4 Effects of 4-AAQB on the osteoclastogenesis signaling pathway. Osteoclastogenesis proteins were assayed by western blotting after exposure to v-Xg (A) conditions for 24 h. The cells were treated with 4-AAQB (1, 3, or 10 µM) or ALN (10 µM) combined with RANKL for 54 h. The quantitative results of NFATc1 (B), c-Fos (C), and DC-STAMP (D) represent the mean ± SEM (n = 3). In addition, after exposure to μXg (E) conditions for 24 h, the cells were treated under the same stimulation conditions as the v-Xg group for 48 h. The quantitative results (F–H) represent the mean ± SEM (n = 3). * p < 0.05, **p < 0.01 and *** p < 0.001 versus control; # p < 0.05, ## p < 0.01, and ### p < 0.001 versus RANKL.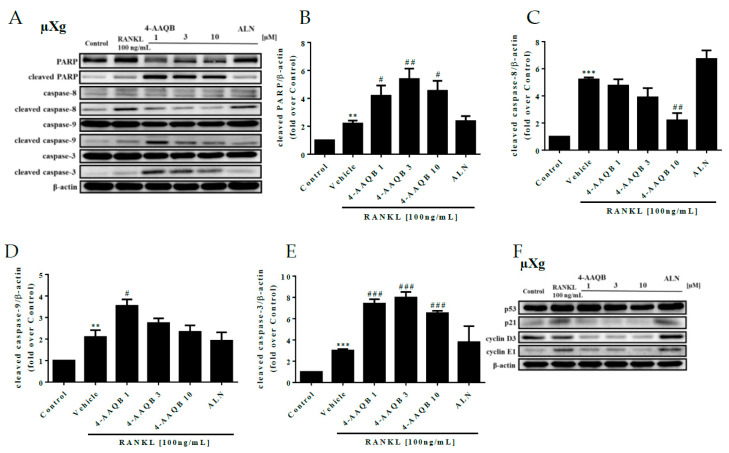
Figure 5
Effects of 4-AAQB on osteoclast…
Figure 5
Effects of 4-AAQB on osteoclast apoptosis and the cell cycle after μXg stimulation.…
Figure 5 Effects of 4-AAQB on osteoclast apoptosis and the cell cycle after μXg stimulation. After exposure to μXg (A) conditions for 24 h, the cells were treated with 4-AAQB or ALN combined with RANKL for 48 h. Apoptotic proteins were assayed by western blotting. The quantitative results of cleaved PARP (B), cleaved caspase-8 (C), cleaved caspase-9 (D), and cleaved caspase-3 (E) represent the mean ± SEM (n = 3). In addition, the cell cycle proteins were also assayed by western blotting (F). The quantitative results of p53 (G), p21 (H), cyclin D3 (I), and cyclin E1 (J) represent the mean ± SEM (n = 3). * p < 0.05, ** p < 0.01, and *** p < 0.001 versus control; # p < 0.05, ## p < 0.01, and ### p < 0.001 versus RANKL.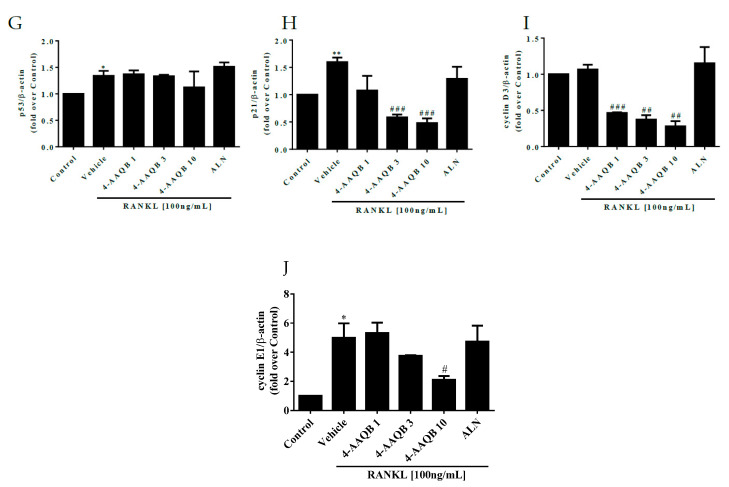
Figure 5
Effects of 4-AAQB on osteoclast…
Figure 5
Effects of 4-AAQB on osteoclast apoptosis and the cell cycle after μXg stimulation.…
Figure 5 Effects of 4-AAQB on osteoclast apoptosis and the cell cycle after μXg stimulation. After exposure to μXg (A) conditions for 24 h, the cells were treated with 4-AAQB or ALN combined with RANKL for 48 h. Apoptotic proteins were assayed by western blotting. The quantitative results of cleaved PARP (B), cleaved caspase-8 (C), cleaved caspase-9 (D), and cleaved caspase-3 (E) represent the mean ± SEM (n = 3). In addition, the cell cycle proteins were also assayed by western blotting (F). The quantitative results of p53 (G), p21 (H), cyclin D3 (I), and cyclin E1 (J) represent the mean ± SEM (n = 3). * p < 0.05, ** p < 0.01, and *** p < 0.001 versus control; # p < 0.05, ## p < 0.01, and ### p < 0.001 versus RANKL.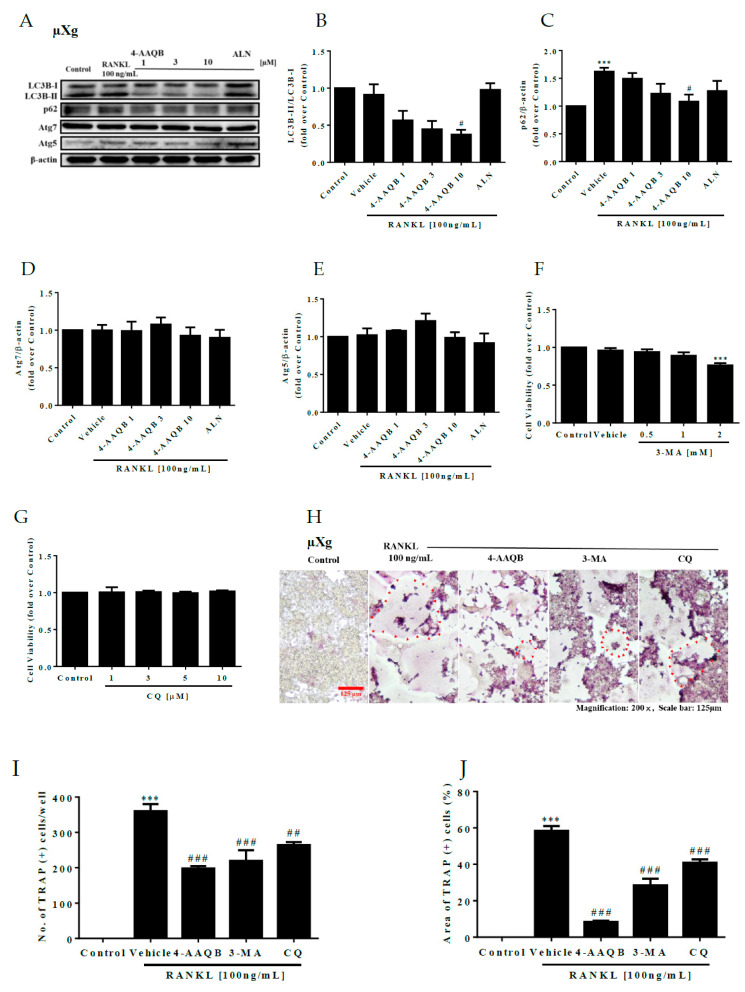
Figure 6
Autophagy inhibitor attenuation of osteoclast…
Figure 6
Autophagy inhibitor attenuation of osteoclast formation after µXg stimulation. Autophagy proteins were assayed…
Figure 6 Autophagy inhibitor attenuation of osteoclast formation after µXg stimulation. Autophagy proteins were assayed by western blotting (A). The quantitative results of LC3B-II/LC3B-I (B), p62 (C), Atg 7 (D), and Atg 5 (E) represent the mean ± SEM (n = 3). Cell viability was assayed by alamarBlue for 2 h after cell stimulation under µXg conditions for 24 h; stimulation by 3-MA (F) or CQ (G) continued for 72 h. The quantitative results represent the mean ± SEM (n = 3). TRAP staining was performed after cell stimulation under µXg (H) conditions for 24 h. and the cells treated with 4-AAQB (10 µM), 3-MA (1 mM), or CQ (10 µM) combined with RANKL for 72 h. The quantitative results of the number of TRAP (+) osteoclasts/well (I) and area of TRAP (+) osteoclasts (%) (J) represent the mean ± SEM (n = 6). Fluorescent staining was performed after stimulation under µXg (K) conditions for 24 h, and the cells treated with 4-AAQB, 3-MA, or CQ combined with RANKL for 72 h. The quantitative results of the number of actin rings/well (L) represent the mean ± SEM (n = 4). After exposure to μXg (M) conditions for 24 h, the cells were treated with 4-AAQB, 3-MA, or CQ combined with RANKL for 48 h. Osteoclastogenesis proteins were assayed by western blotting. The quantitative results of NFATc1 (N), c-Fos (O), and DC-STAMP (P) represent the mean ± SEM (n = 3). Osteoclasts or actin rings are indicated by red arrows. Orange rectangles represent the areas magnified 200 times. * p < 0.05, ** p < 0.01, and *** p < 0.001 versus control; # p < 0.05, ## p < 0.01, and ### p < 0.001 versus RANKL.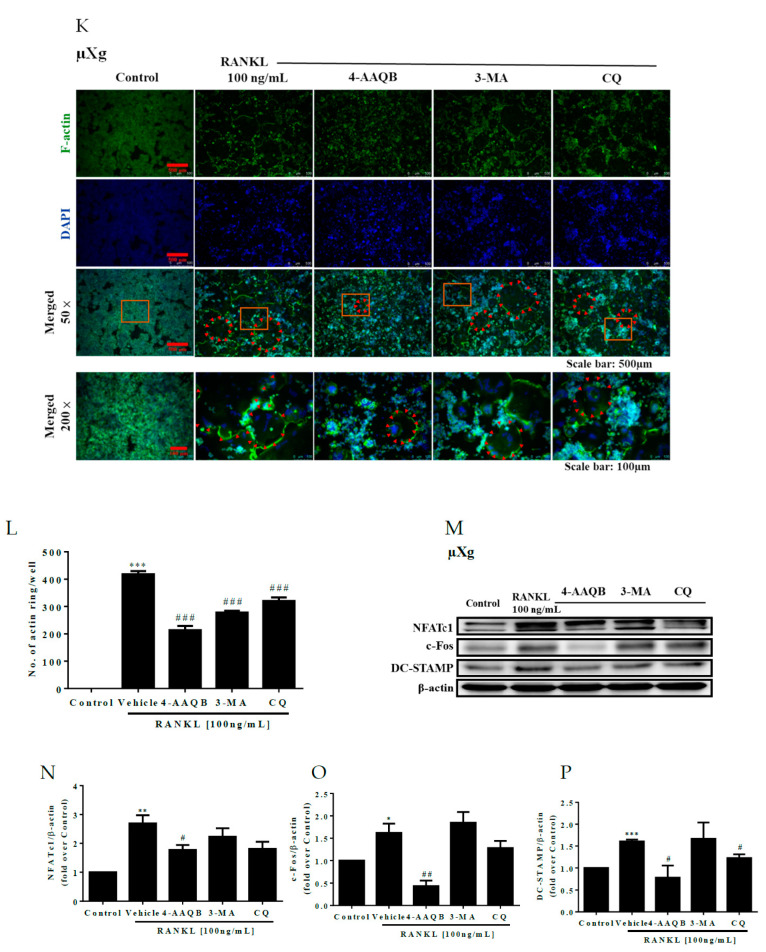
Figure 6
Autophagy inhibitor attenuation of osteoclast…
Figure 6
Autophagy inhibitor attenuation of osteoclast formation after µXg stimulation. Autophagy proteins were assayed…
Figure 6 Autophagy inhibitor attenuation of osteoclast formation after µXg stimulation. Autophagy proteins were assayed by western blotting (A). The quantitative results of LC3B-II/LC3B-I (B), p62 (C), Atg 7 (D), and Atg 5 (E) represent the mean ± SEM (n = 3). Cell viability was assayed by alamarBlue for 2 h after cell stimulation under µXg conditions for 24 h; stimulation by 3-MA (F) or CQ (G) continued for 72 h. The quantitative results represent the mean ± SEM (n = 3). TRAP staining was performed after cell stimulation under µXg (H) conditions for 24 h. and the cells treated with 4-AAQB (10 µM), 3-MA (1 mM), or CQ (10 µM) combined with RANKL for 72 h. The quantitative results of the number of TRAP (+) osteoclasts/well (I) and area of TRAP (+) osteoclasts (%) (J) represent the mean ± SEM (n = 6). Fluorescent staining was performed after stimulation under µXg (K) conditions for 24 h, and the cells treated with 4-AAQB, 3-MA, or CQ combined with RANKL for 72 h. The quantitative results of the number of actin rings/well (L) represent the mean ± SEM (n = 4). After exposure to μXg (M) conditions for 24 h, the cells were treated with 4-AAQB, 3-MA, or CQ combined with RANKL for 48 h. Osteoclastogenesis proteins were assayed by western blotting. The quantitative results of NFATc1 (N), c-Fos (O), and DC-STAMP (P) represent the mean ± SEM (n = 3). Osteoclasts or actin rings are indicated by red arrows. Orange rectangles represent the areas magnified 200 times. * p < 0.05, ** p < 0.01, and *** p < 0.001 versus control; # p < 0.05, ## p < 0.01, and ### p < 0.001 versus RANKL.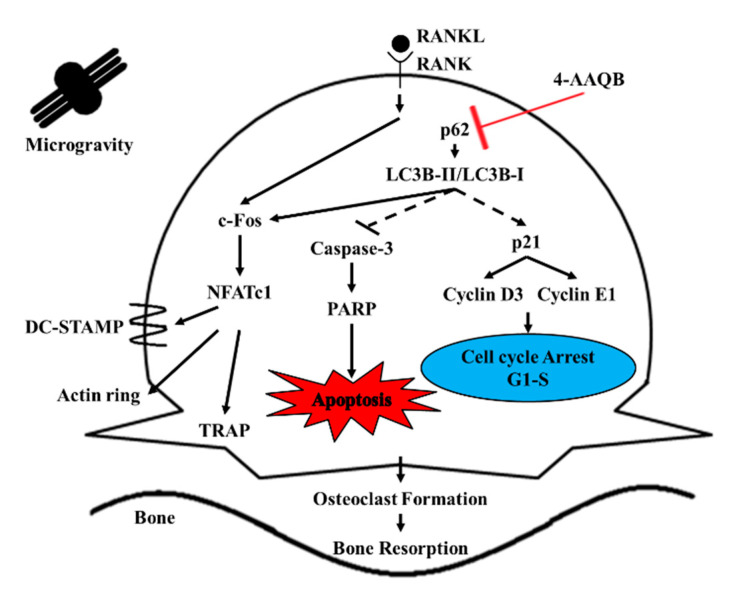
Figure 7
Proposed mechanisms of 4-AAQB in…
Figure 7
Proposed mechanisms of 4-AAQB in osteoclastogenesis.
Figure 7 Proposed mechanisms of 4-AAQB in osteoclastogenesis. All figures (12)