CCM111, the water extract of Antrodia cinnamomea, regulates immune-related activity through STAT3 and NF-κB pathways
Figures

Figure 1
Toxicity of CCM111 and chemical…
Figure 1
Toxicity of CCM111 and chemical fingerprint analysis of CCM111 by HPLC-UV. ( a…
Figure 1 Toxicity of CCM111 and chemical fingerprint analysis of CCM111 by HPLC-UV. (a) and (b) HEK293 or RAW264.7 cells were treated separately with different concentrations of CCM111 (0, 20, 40, 80, 120, 160, 240, and 360 μg/ml) for 24 hours. The survival of cells was detected by the Alamar blue assay. Results were obtained from three independent replicates. (c) The HPLC-UV method was performed to establish the quality control of CCM111. The absorption of UV wavelengths was measured at 210 nm and 254 nm.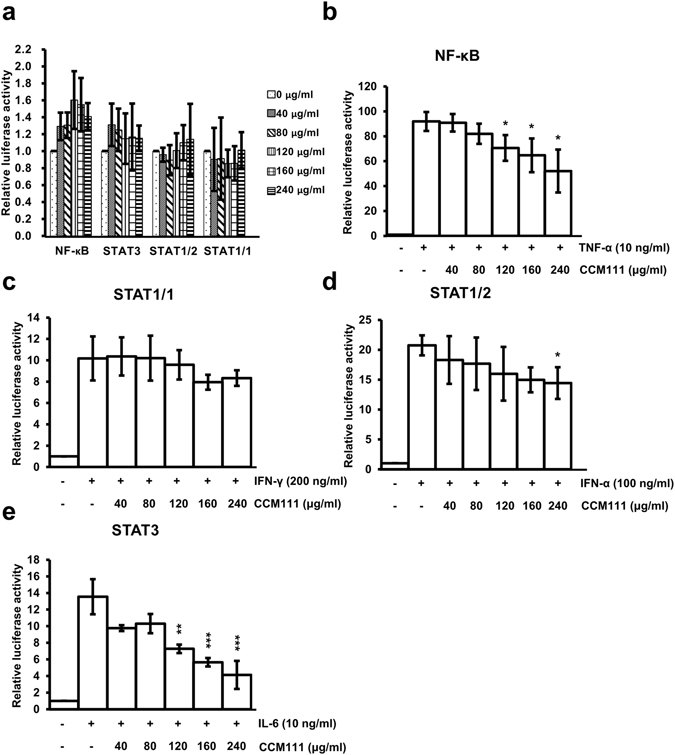
Figure 2
The effects of CCM111 on…
Figure 2
The effects of CCM111 on immune signaling pathways. Four stable cell lines expressing…
Figure 2 The effects of CCM111 on immune signaling pathways. Four stable cell lines expressing STAT1/1-, STAT1/2-, STAT3- or NF-κB-dependent luciferase reporters were treated with different concentrations of CCM111 (0, 40, 80, 120, 160 and 240 μg/ml) as shown in (a). The STAT1/2, STAT3 and NF-κB reporters were constructed in the HEK293 cell line. The STAT1/1 was constructed in the HeLa cell line. Cells were treated with individual ligands alone or in combination with different doses of CCM111 as shown in (b–e). The luciferase activity of the NF-κB was detected at 4 hours, and the luciferase activities of STAT1/1, STAT1/2 and STAT3 were measured at 17 hours. The S.D. was performed by Student’s t-test compared to the individual ligand group. *p-value < 0.05, **p-value < 0.01 and ***p-value < 0.001. Results were obtained from three independent replicates.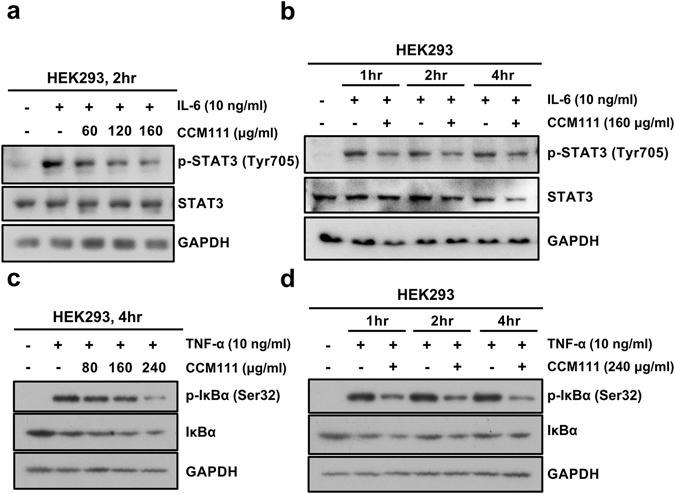
Figure 3
The effects of CCM111 on…
Figure 3
The effects of CCM111 on the STAT3 signaling transduction pathway in HEK293 cells.…
Figure 3 The effects of CCM111 on the STAT3 signaling transduction pathway in HEK293 cells. (a–d) Total cell lysates were prepared for Western blot analysis to detect the protein levels. (a) The cells were treated with h-IL-6 (10 ng/ml) and CCM111 (0, 60, 120 or 160 μg/ml) for 2 hours. (b) The cells were treated with h-IL-6 (10 ng/ml) alone or in combination with CCM111 (160 μg/ml) for 1, 2 and 4 hours. (c) The cells were treated with TNF-α (10 ng/ml) and CCM111 (0, 80, 160 or 240 μg/ml) for 2 hours. (d) The cells were treated with TNF-α (10 ng/ml) alone and/or in combination with CCM111 (240 μg/ml) for 1, 2 and 4 hours. (a,b) The protein levels of STAT3 and phospho-STAT3 were detected. (c,d) The protein levels of IκBα and phospho-IκBα were detected. GAPDH served as an internal control. The full length blots images are presented in Supplementary Fig. 2. Results were obtained from three independent replicates.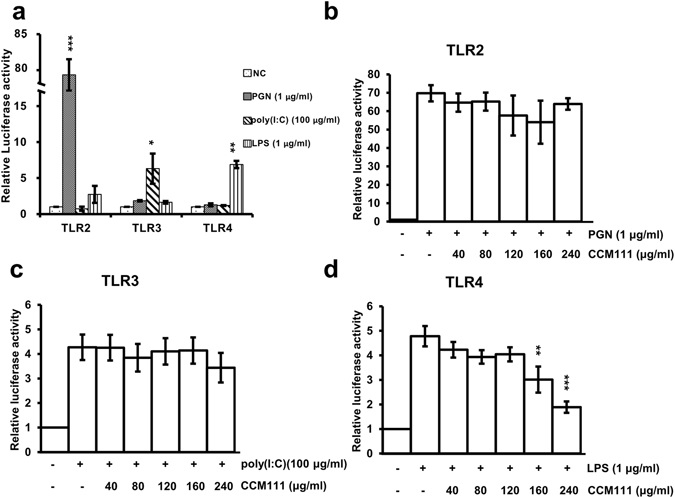
Figure 4
The effects of CCM111 on…
Figure 4
The effects of CCM111 on TLR signaling pathways. Three stable cell lines separately…
Figure 4 The effects of CCM111 on TLR signaling pathways. Three stable cell lines separately expressing TLR2-, TLR3- or TLR4-dependent luciferase reporters were separately treated with LPS (1 μg/ml), PGN (1 μg/ml), and poly(I:C) (100 μg/ml) for 17 hours as shown in (a). TLR2, TLR3 and TLR4 were constructed in the HEK293 cell line. Cells were treated with individual ligands and different doses of CCM111 as shown in (b–d). After 17 hours, the luciferase activity was measured. The S.D. was performed by Student’s t-test compared to the individual ligand group. **p-value < 0.01 and ***p-value < 0.001. Results were obtained from three independent replicates.
Figure 5
The effects of CCM111 on…
Figure 5
The effects of CCM111 on NF-κB and STAT3 pathway activities in murine RAW264.7…
Figure 5 The effects of CCM111 on NF-κB and STAT3 pathway activities in murine RAW264.7 macrophages. (a) The cells were treated with LPS (100 ng/ml) and CCM111 (0, 80, 160 or 240 μg/ml) for 4 hours. (b) The cells were treated with 100 ng/mL LPS alone or with different concentrations of CCM111 (0, 160 and 240 μg/ml) for 4 h. (c) The cells were treated with IL-6 (10 ng/ml) and CCM111 (0, 60, 120 or 160 μg/ml) for 1 hour. (d) The cells were treated with IL-6 (10 ng/ml) alone or in combination with CCM111 (160 μg/ml) for 0.5, 1, and 2 hours. (e) The cells were treated with LPS (500 ng/ml) and CCM111 (0, 80, 160 or 160 μg/ml) for 4 hours. (f) The cells were treated with LPS (500 ng/ml) alone or in combination with CCM111 (160 μg/ml) for 2, 4, and 6 hours. (g) The cells were treated with IL-6 (10 ng/ml) alone or in combination with CCM111 (0, 60, 120, 160 μg/ml) for 0.5 hours. (a–g) After treatment, the cell lysates were analyzed by immunoblotting. (a) The protein levels of IκBα and phospho-IκBα were detected, and GAPDH was used as the internal control. (b) The protein levels of p65, IκBα expression were detected. β-actin was used as the cytosol internal control, and Histone H3 was used as the nuclear internal control. (c–f) The protein levels of STAT3 and phospho-STAT3 were detected, and β-actin was used as the internal control. (g) The protein level of phospho-Tyk2 was detected, and GAPDH was used as the internal control. The full length blots images are presented in Supplementary Fig. 3. The results were obtained from three independent replicates.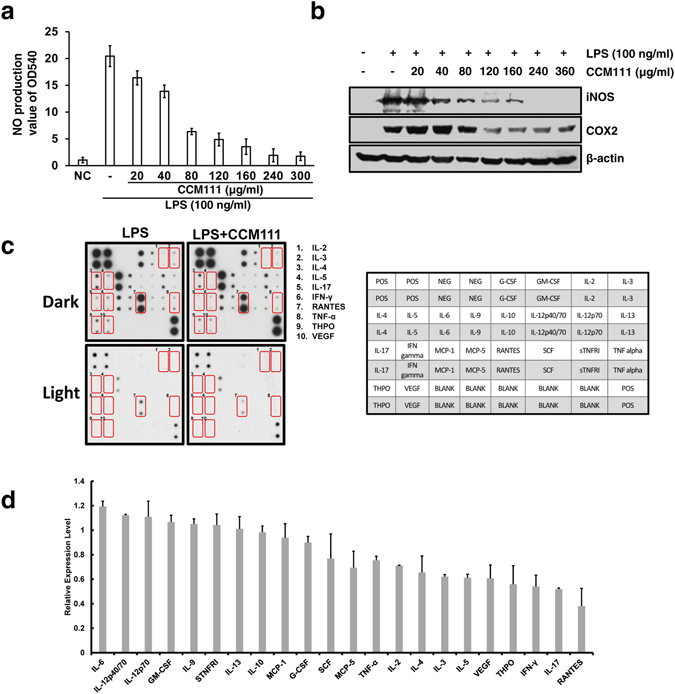
Figure 6
The effects of CCM111 on…
Figure 6
The effects of CCM111 on NO production and the protein expression of iNOS,…
Figure 6 The effects of CCM111 on NO production and the protein expression of iNOS, COX-2, and inflammatory cytokines in murine RAW264.7 macrophages. The cells were treated with LPS (100 ng/ml) alone or in combination with different concentrations of CCM111. After incubation for 24 hours, the culture media was collected for nitrate assay analysis as shown in (a), and the protein lysates were analyzed by immunoblotting for iNOS, COX2 and β-actin as shown in (b) The full length blots images are presented in Supplementary Fig. 5a. Results in (a) and (b) were obtained from three independent replicates. The cells were treated with LPS (100 ng/ml) alone or in combination with LPS and CCM111 (160 μg/ml) for 24 h. The cell lysates were analyzed by the RayBio C-series mouse cytokine antibody array C1. (c) The left panel shows an image of the signal spots on the membrane for each cytokine. Each spot represents one cytokine, and each cytokine is in duplicate. Spots that show significant change are marked. The right panel shows the identities of all spots on the array with coordinates. The full length blots images are presented in Supplementary Fig. 5b. The left image of spots was scanned and measured by NIH Image-J software. (d) The relative expression level of each protein was calculated from densitometry data from (c) and normalized to the LPS treatment alone array. The blue dotted line represents a 0.8-fold difference, and the red dotted line represents a 1.2-fold difference. Error bars indicate S.D. (n = 2).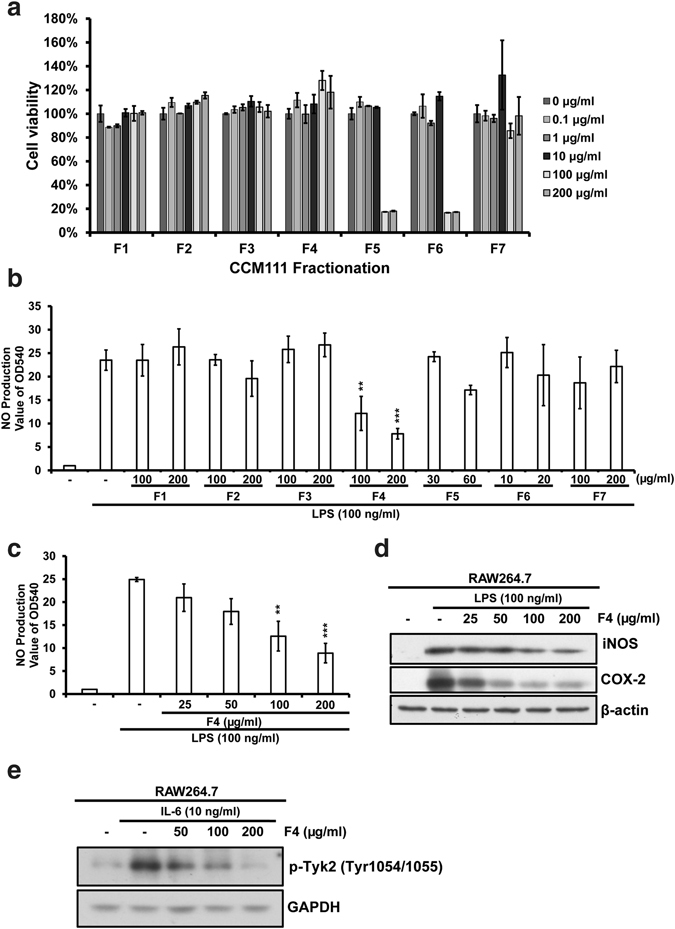
Figure 7
The effects of CCM111 fractions…
Figure 7
The effects of CCM111 fractions on NO production and the protein expressions of…
Figure 7 The effects of CCM111 fractions on NO production and the protein expressions of iNOS, COX-2 in murine RAW264.7 macrophages. (a) RAW264.7 cells were treated separately with different concentrations of CCM111 fractions for 24 hours. (b) The cells were treated with LPS (100 ng/ml) alone or in combination with different concentrations of CCM111 fractions. (c,d) The cells were treated with LPS (100 ng/ml) alone or in combination with different concentrations of fraction 4 for 24 hours. (e) The cells were treated with IL-6 (10ng/ml) alone or in combination with F4 for 0.5 hours. (a) After treatment, the survival of cells was detected by the Alamar Blue assay. (b,c) After incubation, the culture media were collected for nitrate assay analysis. (d,e) After treatment, the cell lysates were analyzed by immunoblotting. (d) The protein levels of iNOS and COX-2 were detected, and β-actin was used as the internal control. (e) The protein level of phospho-Tyk2 was detected, and GAPDH was used as the internal control. The full length blots images are presented in Supplementary Fig. 6. The S.D. was performed by Student’s t-test compared to the control or LPS only group. **p-value < 0.01 and ***p-value < 0.001. Results were obtained from three independent replicates.
Figure 8
The model of effects of…
Figure 8
The model of effects of CCM111 in macrophage cells. ( a ) LPS…
Figure 8 The model of effects of CCM111 in macrophage cells. (a) LPS induces the activation of the TLR4/NF-κB pathway and up-regulates IL-6 to activate the STAT3 pathway. The activation of the STAT3 and NF-κB pathways results in the enhancement of inflammatory responses. (b) CCM111 significantly suppresses the STAT3 pathway through inhibiting the phosphorylation of STAT3 and Tyk2, and it suppresses the NF-κB pathway by inhibiting the nuclear translocation of p65 to repress LPS-induced inflammatory responses. All figures (8)