Antrodin C Isolated from Antrodia Cinnamomea Induced Apoptosis through ROS/AKT/ERK/P38 Signaling Pathway and Epigenetic Histone Acetylation of TNFα in Colorectal Cancer Cells
Abstract
Figures 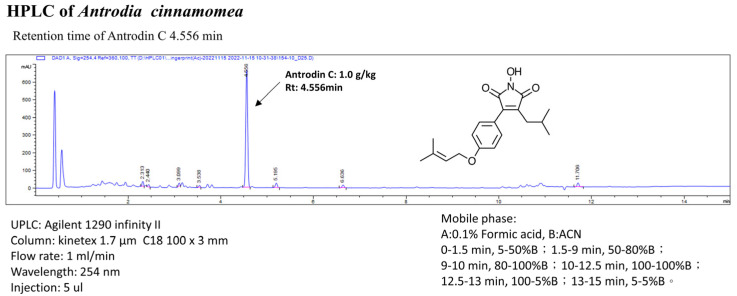
Figure 1
High-performance liquid chromatography analysis of…
Figure 1
High-performance liquid chromatography analysis of the ethanol Antrodea cinnamomea mycelial extract. The retention…
Figure 1 High-performance liquid chromatography analysis of the ethanol Antrodea cinnamomea mycelial extract. The retention time peak of antrodin C from the bioreactor is at 4.556 min (UV detection at 254 nm).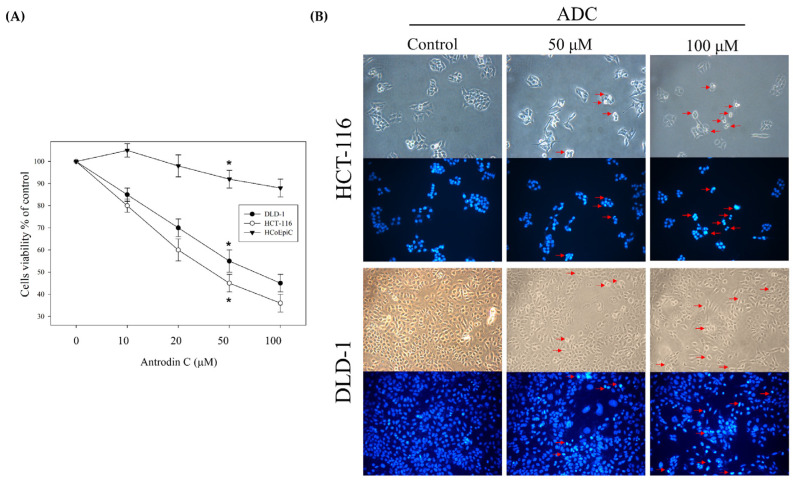
Figure 2
Antrodin C (ADC) decreases cell…
Figure 2
Antrodin C (ADC) decreases cell viability in DLD-1 and HCT-116 cells. ( A…
Figure 2 Antrodin C (ADC) decreases cell viability in DLD-1 and HCT-116 cells. (A) Cells were treated with either 0.1% DMSO (as control) or ADC for 24 h and subjected to MTT assay for analysis of their cell viability. (B) DAPI staining of treated CRC cells was performed to analyze apoptotic cells (red arrowheads) under fluorescence microscopy. The data are expressed as the mean ± SD of three repeats in three independent experiments. * p < 0.05, versus the control group.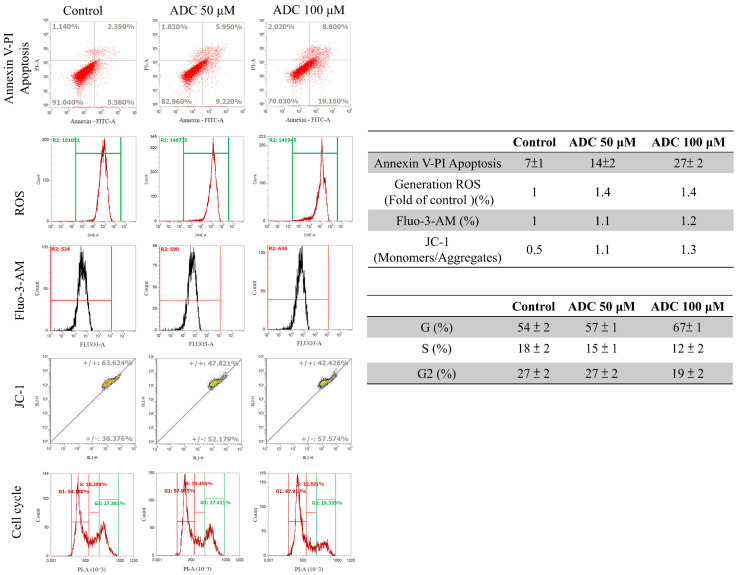
Figure 3
Antrodin C (ADC) induces cell…
Figure 3
Antrodin C (ADC) induces cell apoptosis and reactive oxygen species (ROS)/Ca2 + production…
Figure 3 Antrodin C (ADC) induces cell apoptosis and reactive oxygen species (ROS)/Ca2+ production as well as decreasing mitochondria potential and cell-cycle G1 arrest in HCT-116 cells. After ADC treatment, the HCT-116 cells were stained with FITC-conjugated annexin-V and propidium iodide (PI) analysis. After individual treatment, the percentage of apoptotic cells was indicated. Measurement of the intracellular ROS/Ca2+ of ADC-treated cells was performed by FACS analysis. ROS/Ca2+ production is expressed as the fold change of the control group. The ADC-treated cells were stained with JC-1 stain for flow cytometry analysis. A decrease in the green/red fluorescence intensity ratio detected by ADC revealed the membrane-permeant ADC exhibits potential-dependent accumulation in mitochondria. Flow cytometry results show the percentage of cell numbers involved in each cell-cycle phase (G1, S, and G2/M). Data are presented from a list of three independent experiments as mean ± SD.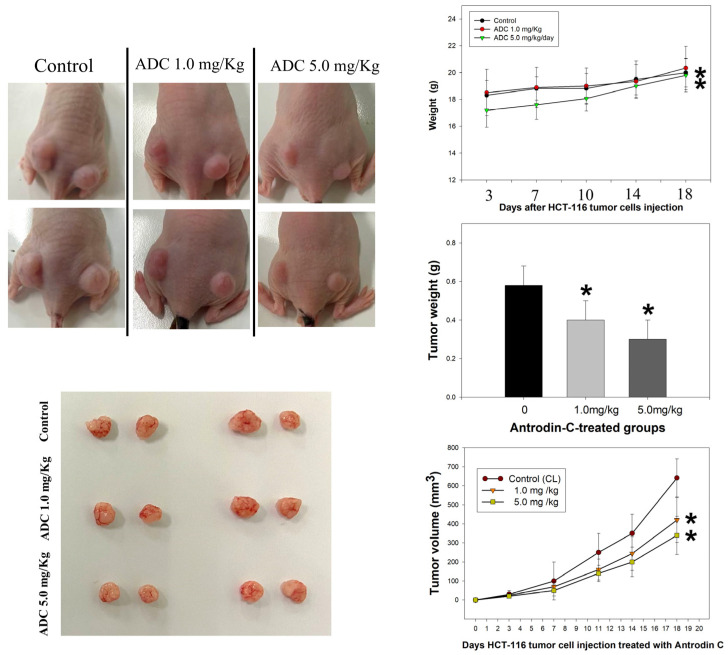
Figure 4
Antrodin C (ADC) repressed the…
Figure 4
Antrodin C (ADC) repressed the proliferation of CRC cells in an in vivo…
Figure 4 Antrodin C (ADC) repressed the proliferation of CRC cells in an in vivo xenograft mouse model. Subcutaneous injections with 106 cells/mouse for each of the indicated HCT-116 cell lines into nude mice were performed. Representative images of nude mice implanted with colorectal cancer cells, with or without ADC treatment, are shown in left panels. Right panels: after the cancer cells were implanted, the body weight, tumor volume, and tumor weight were measured at intervals of 0, 7, 10, 14, and 18 days with or without ADC treatment. The quantitative data are assayed as mean ± SD. (n = 6/group). * p < 0.05.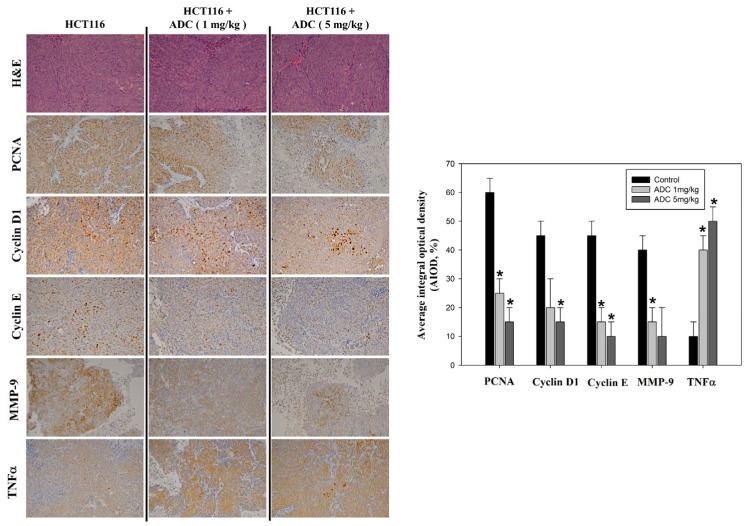
Figure 5
Antrodin C (ADC) varies proliferative…
Figure 5
Antrodin C (ADC) varies proliferative and apoptotic protein expression in CRC cells in…
Figure 5 Antrodin C (ADC) varies proliferative and apoptotic protein expression in CRC cells in an in vivo xenograft mouse model. Hematoxylin and eosin staining of the tumors of the nude mice was performed (1st row, upper panel). Protein levels of PCNA (2nd row, upper panel), cyclin D1 (3rd row, upper panel), cyclin E (5th row, upper panel), MMP-9 (6th row, upper panel), and TNFα (7th row, upper panel) were detected by using immunohistochemical analysis. Right panel: By calculating the average of integrated optical density (AIOD), quantitative assay of PCNA, cyclin D1, cyclin E, MMP-9, and TNFα proteins was evaluated. Multiple tumor fields and their positively stained area were evaluated and then evaluated by randomly selecting three observational fields of each section (n = 6/group). The data are expressed as mean ± SD. * p < 0.05, magnification × 200.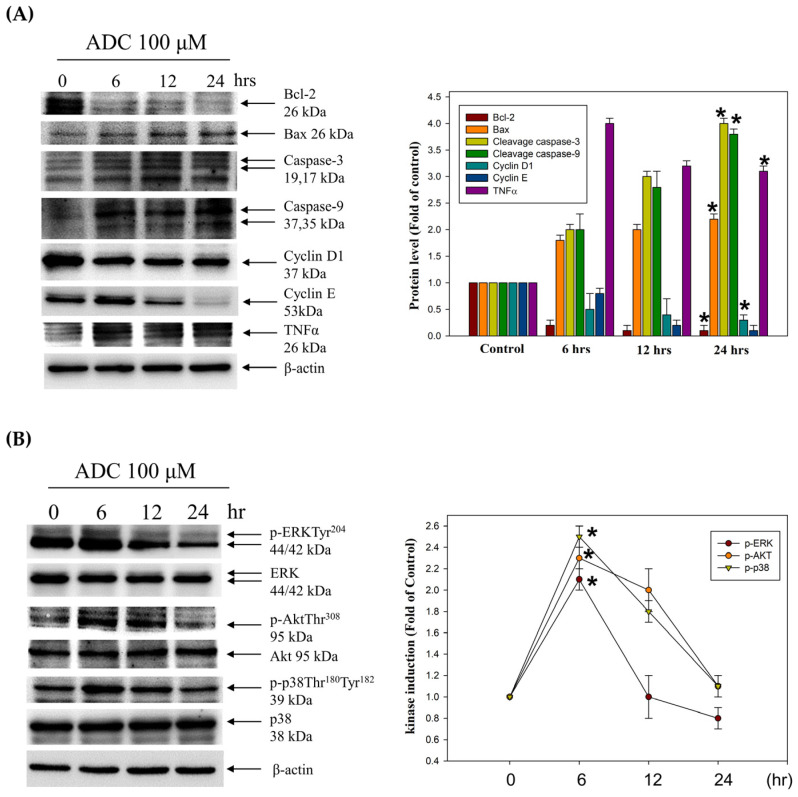
Figure 6
The effect of antrodin C…
Figure 6
The effect of antrodin C (ADC) on cell death and cell-cycle-related proteins, and…
Figure 6 The effect of antrodin C (ADC) on cell death and cell-cycle-related proteins, and ERK/AKT/p38 MAPK pathways in HCT-116 cells. (A,B) The protein levels of Bcl-2, Bax, caspase-3, caspase-9, cyclin D1, CDK2, cyclin E, TNFα, ERK, AKT, and p38 were determined using Western blotting in ADC-treated HCT-116 cells. While β-actin served as an internal control, densitometric analysis was used to quantify protein levels with the control at 100%. Data are expressed as the mean ± SD of three independent experiments. * p < 0.05, compared with the control group.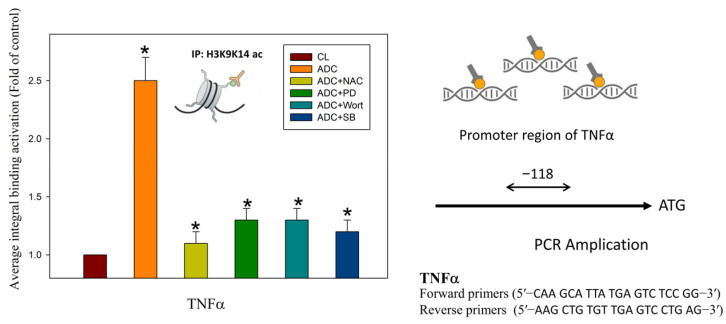
Figure 7
The kinase inhibitors block the…
Figure 7
The kinase inhibitors block the binding activities of tumor necrosis factor (TNF) promoter…
Figure 7 The kinase inhibitors block the binding activities of tumor necrosis factor (TNF) promoter regions, as induced by antrodin C treatment. The chromatin immunoprecipitation assay was performed using antibodies against histone H3K9K14ac (Acetyl Lys9/Lys14) and TNFα promoters (the −118 target sites, as described in the Materials and Methods) in the precipitated DNA, which was amplified by quantitative real-time polymerase chain reaction using specific primer sets. HCT-116 cells were incubated with or without reactive oxygen species (ROS) scavengers, specific ERK1/2 MAPK inhibitor PD98059, PI3K/AKT inhibitor wortmannin, or the p38 MAPK inhibitor SB203580 for 24 h at various concentrations. The data are presented as the mean ± SD of three independent experiments. * p < 0.05, as compared to the control group.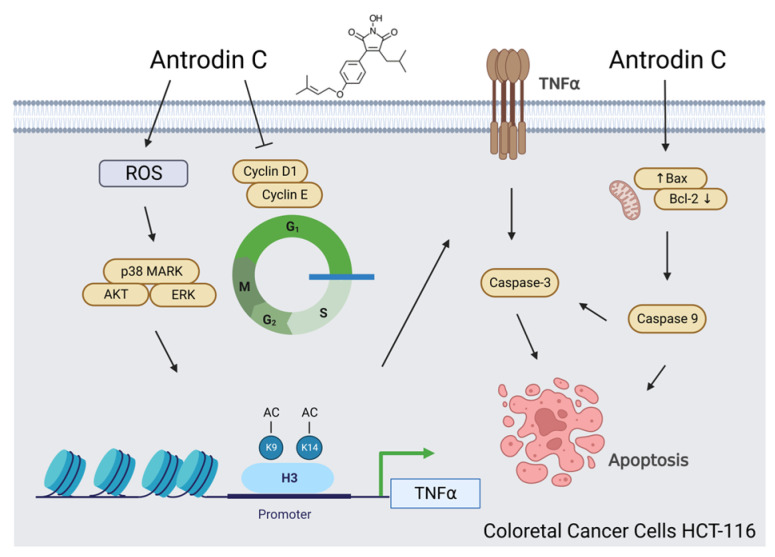
Figure 8
Schematic presentation of the molecular…
Figure 8
Schematic presentation of the molecular mechanism of antrodin-C-mediated apoptotic induction of colorectal cancer…
Figure 8 Schematic presentation of the molecular mechanism of antrodin-C-mediated apoptotic induction of colorectal cancer (CRC) cells. Antrodin C treatment increases the expression of death receptor tumor necrosis factor (TNF)α through ROS-derived and ERK/AKT/p38 MAPK-signaling-pathway-mediated histone H3K9K14ac (Acetyl Lys9/Lys14). Activation of TNFα by antrodin C triggers cell apoptosis through the inhibition of Bcl-2 and activation of Bax, caspase-3, and -9. On the other hand, antrodin C treatment also causes cell-cycle arrest at the G1 phase through the downregulation of cyclin D1/cyclin E in HCT-116 cells. All figures (8)