Antrodin C inhibits epithelial-to-mesenchymal transition and metastasis of breast cancer cells via suppression of Smad2/3 and β-catenin signaling pathways
Figures
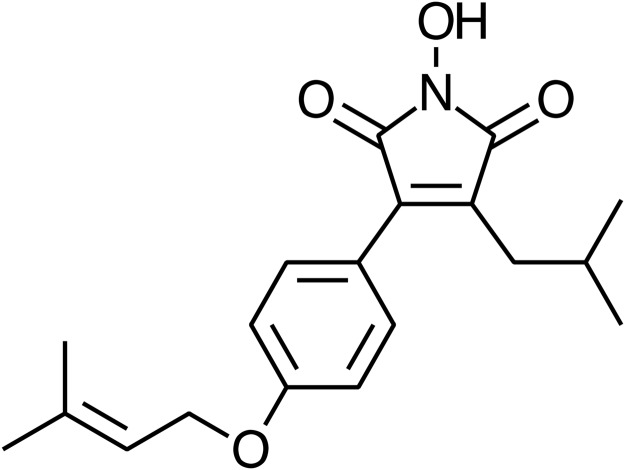
Fig 1. Chemical structure of Antrodin C…
Fig 1. Chemical structure of Antrodin C (ADC).
Synonym: 3-Isobutyl-4-[4-(methyl-2-butenyloxy)phenyl]-1 H -pyrrole-2,5-dione; Molecular formula: C…
Fig 1. Chemical structure of Antrodin C (ADC). Synonym: 3-Isobutyl-4-[4-(methyl-2-butenyloxy)phenyl]-1H-pyrrole-2,5-dione; Molecular formula: C19H23NO4; Molecular weight: 329.39.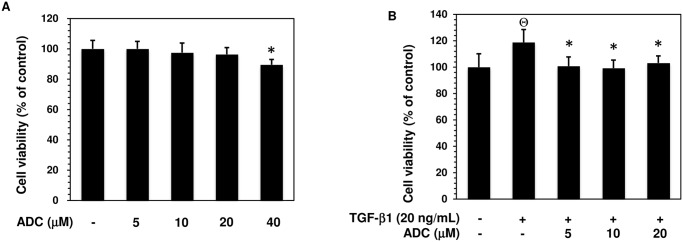
Fig 2. Effect of ADC on MCF-7…
Fig 2. Effect of ADC on MCF-7 cell viability.
( A ) MCF-7 cells were…
Fig 2. Effect of ADC on MCF-7 cell viability. (A) MCF-7 cells were incubated with increasing concentrations of ADC (5–40 μM) for 48 h. (B) Cells were pre-treated with ADC (5–20 μM) for 2 h, and then incubated with TGF-β1 for 48 h. Cell viability was determined by MTT colorimetric assay. The percentage of cell viability was cauculated by the absorption of control cells (0.1% DMSO) as 100%. The data reported as mean ± SD of three independent experiments. ΘP< 0.001, significant difference from control and TGF-β1 treated group. *P< 0.05 significant difference from TGF-β alone and ADC treated groups.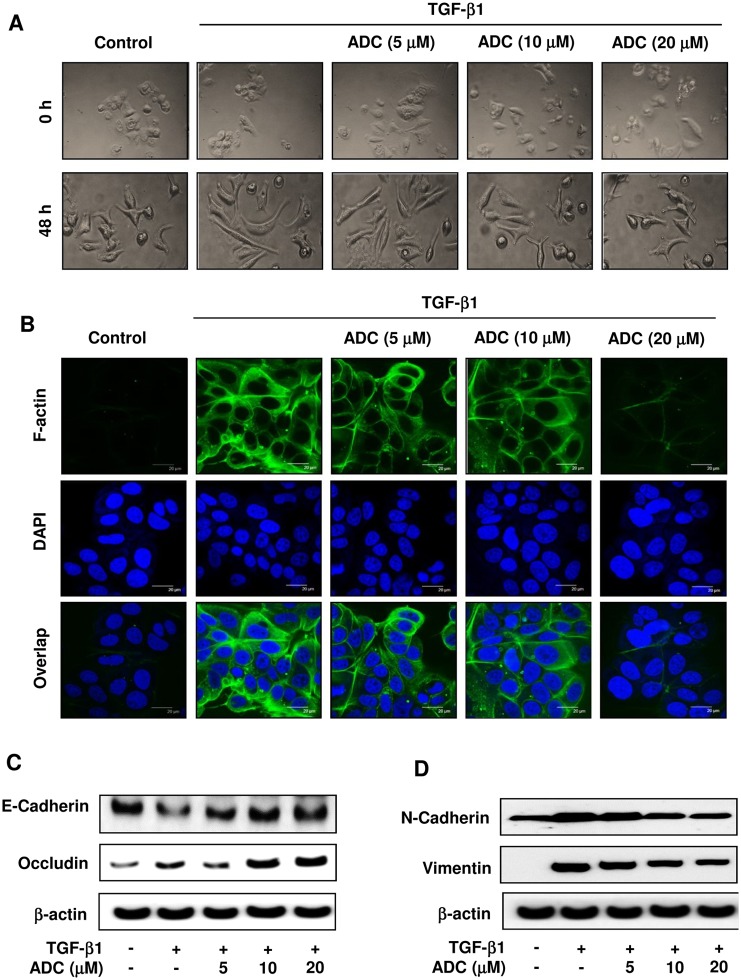
Fig 3. ADC blocks TGF-β1-induced EMT in…
Fig 3. ADC blocks TGF-β1-induced EMT in breast cancer cells.
MCF-7 cells were pre-treated with…
Fig 3. ADC blocks TGF-β1-induced EMT in breast cancer cells. MCF-7 cells were pre-treated with ADC (5–20 μM) for 2 h prior to stimulation with TGF-β1 (20 ng/mL) for 48 h. (A) Morphological changes especially cell scattering was examined by phase-contrast microscope. Photomicrography shown here are from one of the three independent experiments. (B) ADC inhibits TGF-β1-induced actin cytoskeleton reorganization in MCF-7 cells. ADC and TGF-β1 treated cells were fixed, permiabilized, and stained with FITC-phalloidin to visuvalize the F-actin cytoskeleton reorganization. The images are representative of three independent experiments. Bars, 20 μm. (C) Protein samples were isolated from control, ADC, and TGF-β treated cells for the detection of E-cadherin, occluding, vimentin, N-cadherin, and β-actin proteins. β-actin was used as an internal control. Western blot data presented are representative of those obtained in at least three independent experiments.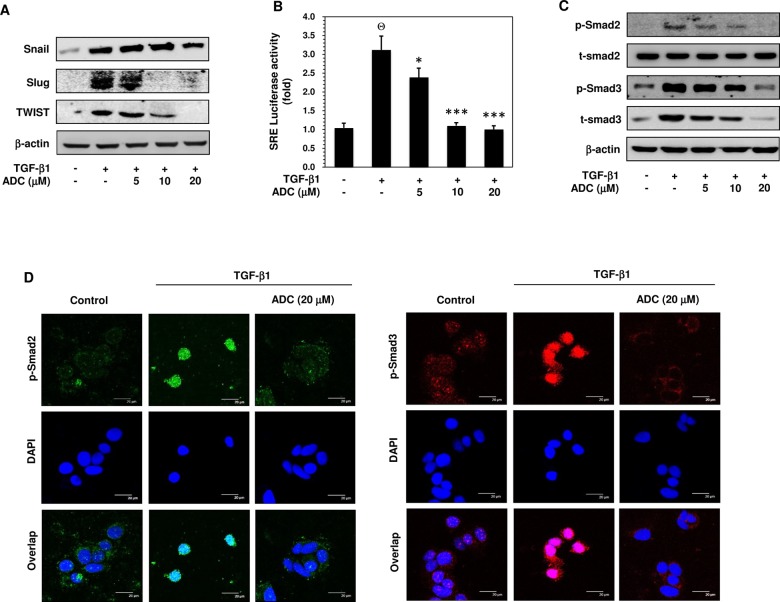
Fig 4. ADC inhibits TGF-β1-induced transcriptional activity…
Fig 4. ADC inhibits TGF-β1-induced transcriptional activity of Smad2/Smad3.
( A ) MCF-7 cells were…
Fig 4. ADC inhibits TGF-β1-induced transcriptional activity of Smad2/Smad3. (A) MCF-7 cells were pre-treated with ADC (5–20 μM) for 2 h prior to stimulation with TGF-β1 (20 ng/mL) for 24 h. Western blot analysis was performed to examine the protein expression levels of Snail, Slug, and TWIST with specific antibodies. β-actin was used as an internal loading control. (B) Cells were transfected with pGL3-SBE-4-Luc reporter construct, and then pre-treated with ADC (5–20 μM) prior to stimulation with TGF-β1 for 3 h. The luciferase activity was expressed as a relative value compared to that of the untreated cells which was set to 1-fold. (C) Western blot was performed to measure the total and phosphorylated levels of Smad2 and Smad3 proteins. (D) TGF-β1-induced nuclear translocation of phosphorylated Smad2 and Smad3 were examined by immunofluorescence analysis with confocal microscope. Cells were pre-treated with ADC (20 μM) for 2 h, and then incubated with TGF-β1 for 1 h. After treatment, cells were fixed, permiabilized, and incubated with Phos-Smad2 or Phos-Smad3 primary antibodies for overnight followed by FITC and TRITC secondary antibodies, respectively for 1 h. The cellular DNA was stained with DAPI (1 μg/mL) and images were captured by confocal microscope (magnification 200). Bars, 20 μm. The data reported as mean ± SD of three independent experiments. ΘP< 0.001, significant difference from control and TGF-β1 alone treated group. *P< 0.05, **P< 0.01, and ***P< 0.001 were significantly different from TGF-β1 alone with the ADC treatment groups.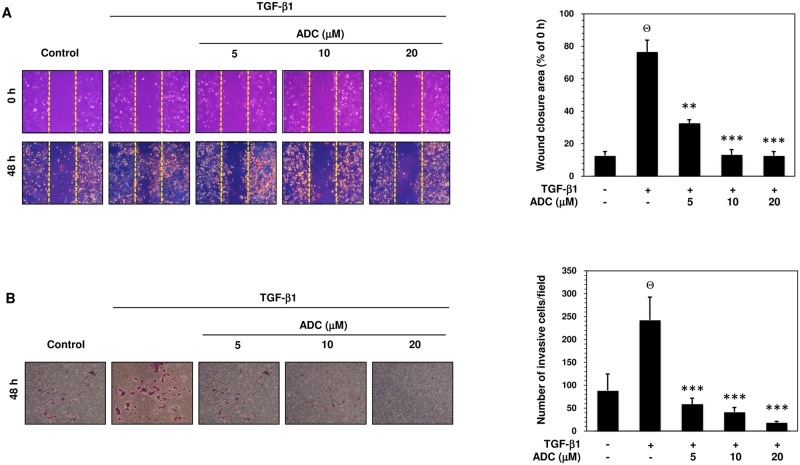
Fig 5. ADC inhibits TGF-β1-induced breast cancer…
Fig 5. ADC inhibits TGF-β1-induced breast cancer cell migration and invasion.
(A) Cell migration was…
Fig 5. ADC inhibits TGF-β1-induced breast cancer cell migration and invasion. (A) Cell migration was determined by wound healing assay, the confluent MCF-7 monolayer was pre-treated with ADC (5–20 μM) for 2 h, cells were scratched by 200 μL pipet tips, and washed to remove the debris followed by addition of freshmedium containing 1% FBS and TGF-β1 (20 ng/mL). Cells were then incubated for 48 h. Photographs were taken at 0 h, and 48 h using inverted microscope with 10 × magnification. TGF-β1-induced cell motility was determined by measuring the area of wound closure as shown by histogram. The closure area at 48 h was compared with 0 h in the same samples. (B) For the invasion assay, the pre-treated cells were seed into the upper chamber of 24-well transwell chamber containing DMEM with 1% FBS. The lower chamber was filled with complete serum media. The cells were allowed to invade for 48 h. Invading cells were then fixed, and stained with Giemsa stain solution and counted in 5 random fields. The average invaded cells in each group was presented by histogram. The data reported as mean ± SD of three independent experiments. ΘP< 0.001, significant difference from control and TGF-β1 alone treated group. *P< 0.05, **P< 0.01, and ***P< 0.001 were significantly different from TGF-β1 alone with the ADC treatment groups.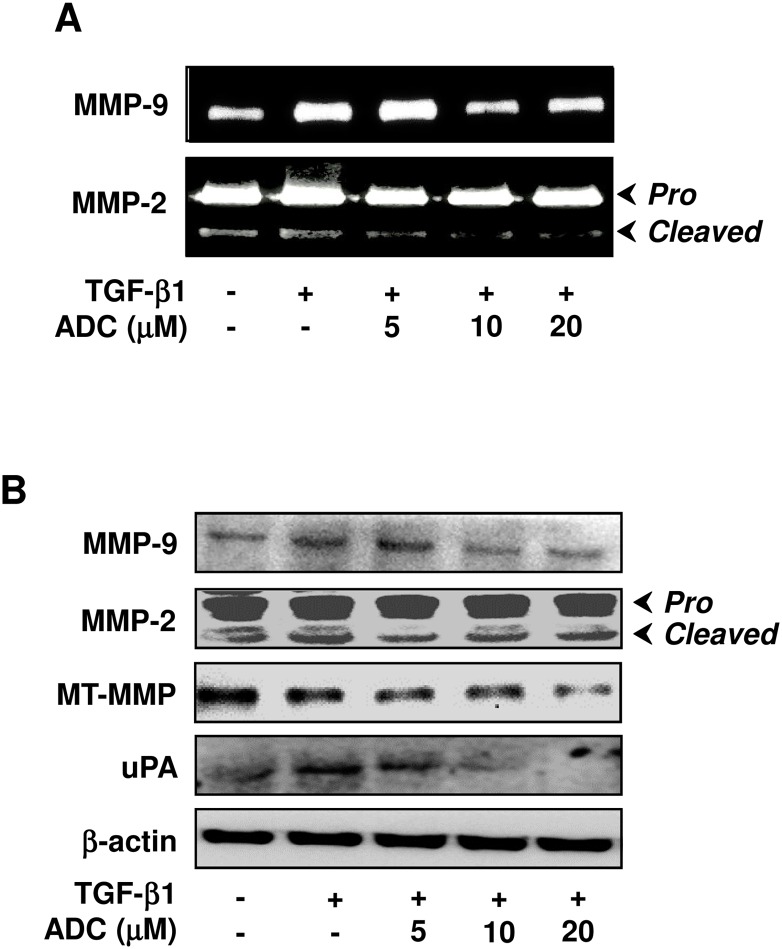
Fig 6. ADC down-regulates TGF-β1-induced MMPs activity…
Fig 6. ADC down-regulates TGF-β1-induced MMPs activity in breast cancer cells.
( A ) MCF-7…
Fig 6. ADC down-regulates TGF-β1-induced MMPs activity in breast cancer cells. (A) MCF-7 cells were pre-treated with ADC (5–20 μM) for 2 h, and then stimulated with TGF-β1 (20 ng/mL) for 48 h. Gelatin zymography was performed with conditioned media collected from MCF-7 cells. (B) Protein expression levels of MT1-MMP, MMP-2, MMP-9, and uPA were determined by western blot analysis with specific antibodies. The house-keeping protein β-actin served as an internal loading control. Arrows denote pro- and cleaved forms of MMP-2. The data reported as mean ± SD of three independent experiments. ΘP< 0.001, significant difference from control and TGF-β1 alone treated group. *P< 0.05, **P< 0.01, and ***P< 0.001 were significantly different from TGF-β1 alone with the ADC treatment groups.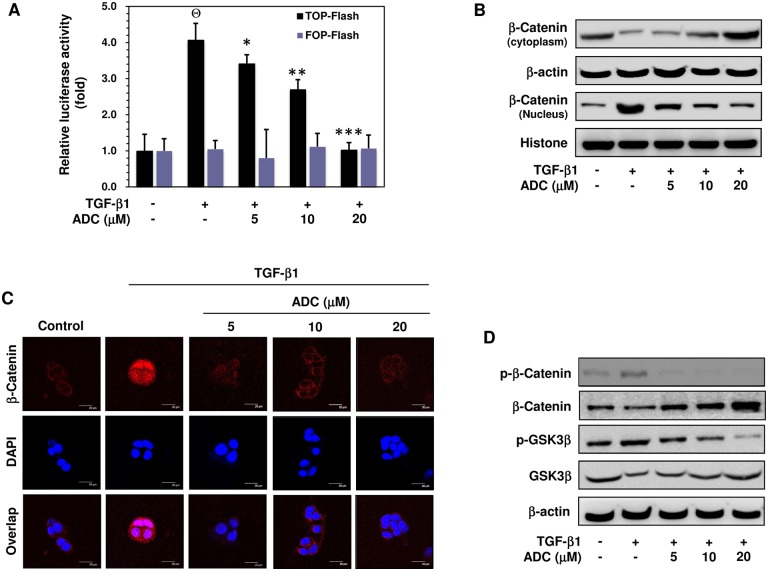
Fig 7. ADC suppressed TGF-β1-induced transcriptional activation…
Fig 7. ADC suppressed TGF-β1-induced transcriptional activation of β-catenin breast cancer cells.
( A )…
Fig 7. ADC suppressed TGF-β1-induced transcriptional activation of β-catenin breast cancer cells. (A) MCF-7 cells were co-transfected with TOP-flash or FOP-flash or pCMV-β-Gal harboring luciferase reporter construct. After transfection, cells were pre-treated with ADC (5–20 μM) for 2 h and then stimulated with TGF-β1 for 3 h. Luciferase activity was determined and normalized with β-gal activity. The histogram shows the relative luciferase activity (fold increase). (B) Cells were pre-treated with ADC (5–20 μM) for 2 h and then stimulated with TGF-β1 for 2 h. β-catenin expression in cytoplasam and the nucleus were determined by western blot analysis using specific cytosolic and nuclear extracts. β-actin and histone were served as an internal control for cytosolic and nuclear fractions, respectively. (C) The nuclear localization of β-catenin in MCF-7 cells were determined by immunofluorescence staining. MCF-7 cells were seeded in a 8-well Tek chamber and allowed to adhere for 24 h. ADC (5–20 μM) for 2 h and then stimulated with TGF-β1 for 2 h. After treatment, cells were fixed, permiabilized, and incubated with β-catenin primary antibody overnight, followed by FITC secondary antibody for 1 h. The cellular DNA was stained with DAPI (1 μg/mL) and images were captured by confocal microscope (magnification 200). (D) Cells were pre-incubated with ADC (5–20 μM) for 2 h, and then stimulated with TGF-β1 for 1 h. The phosphorylated and total protein expression levels of β-catenin and GSK3β were determined by western blot analysis. The data reported as mean ± SD of three independent experiments. ΘP< 0.001, significant difference from control and TGF-β1 alone treated group in TOP-Flash transfected groups. *P< 0.05, **P< 0.01, and ***P< 0.001 were significantly different from TGF-β1 alone with the ADC treatment groups in TOP-Flash transfected groups.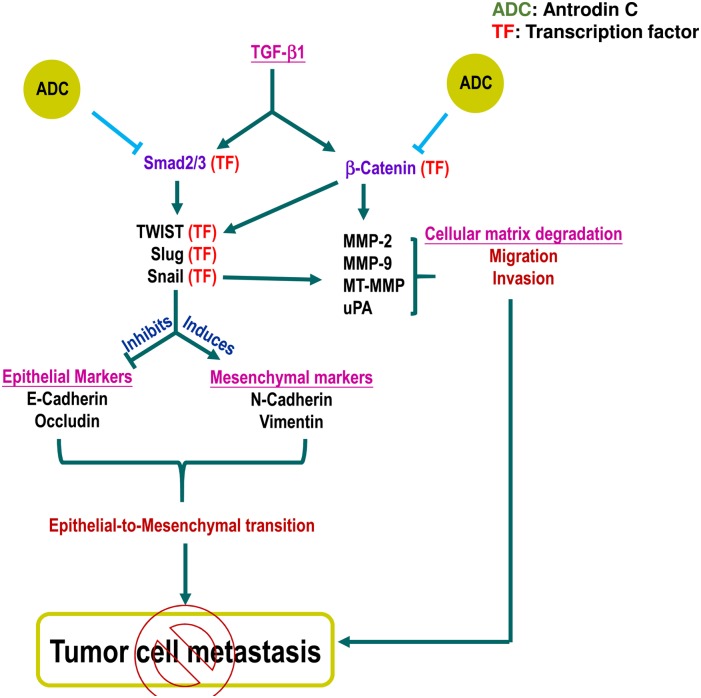
Fig 8. Schematic representation represents the anti-metastatic…
Fig 8. Schematic representation represents the anti-metastatic potential of ADC.
TGF-β ligand binding with TGF-β…
Fig 8. Schematic representation represents the anti-metastatic potential of ADC. TGF-β ligand binding with TGF-β receptor II (TGF-βRII) recruit TGF-βRI into a tetrameric receptor complex resulting in transphosphorylation and activation of TGF-βRI, which then phosphorylates Smad2 or Smad3. Phosphorylated Smad2/3 associate with Smad4 and translocate into the nucleus, where they activate transcription of target genes including snail, slug, and Twist. These genes regulate EMT through suppression of epithelial markers and induction of mesenchymal markers. Pretreatment with ADC inhibits TGF-β-induced EMT by inhibiting phosphorylation and transcriptional activation of Smad2/3. In addition, TGF-β activates β-catenin signaling cascade through the suppression of GSK3β, a negative regulator of β-catenin. The free form of β-catenin translocate into the nucleus and transcribe number of migration marker genes including MMP-2, MMP-9, and uPA. Pretreatment with ADC blocks TGF-β1-induced migration and invasion of MCF-7 cells through the suppression of transcriptional activation of β-catenin followed by down-regulation of MMP-2, MMP-9, and uPA. In addition, previous reports demonstrated that MMPs expression also regulated by snail, transcription factor regulates EMT. There is a possible that reduction in snail expression by may influence MMPs activity. Moreover, Twist was reported to be one of the down-stream target of β-catenin. Therefore, we believe that there may be a cross-talk existing between ADC-induced down-regulation of β-catenin and Twist. All figures (8)