Antrodia cinnamomea triterpenoids attenuate cardiac hypertrophy via the SNW1/RXR/ALDH2 axis
Abstract
Aldehyde dehydrogenase 2 (ALDH2), a pivotal enzyme in the metabolism of toxic aldehydes produced by oxidative stress, has been demonstrated to play a cardioprotective role in cardiovascular diseases. Antrodia cinnamomea triterpenoids (ACT) is a medicinal mushroom with anti-inflammatory and antioxidant properties, and our previous study found that ACT can exert anti-fatty liver effects by regulating ALDH2. This study aimed to elucidate the impact of ACT and its monomer on cardiac hypertrophy and investigate the relationship between its pharmacological mechanism and ALDH2. Through examining cardiac morphology and expression levels of hypertrophic biomarkers, ACT significantly reduced myocardial hypertrophy induced by angiotensin II (Ang II) and transverse aortic constriction (TAC)surgery in wild-type mice, but not in ALDH2 knockout mice. In vitro, ACT and its monomeric dehydrosulphurenic acid (DSA) inhibited the hypertrophic phenotype of Ang II-stimulated neonatal cardiac myocytes (NRCMs) in an ALDH2-dependent manner. Regarding the pharmacological mechanism, it was observed that ACT and DSA restored ALDH2 expression and activity in myocardial tissues of WT-Ang II/TAC mice and Ang II-induced NRCMs. Furthermore, it inhibited oxidative stress and improved mitochondrial quality control (MQC) homeostasis in an ALDH2-dependent manner. We screened SNW1, a transcriptional coactivator, as a DSA-binding protein by "target fishing" and cellular enthusiasm transfer assay techniques and validated that SNW1 promoted ALDH2 transcription and translation levels through synergistic interaction with the transcription factor RXR. In conclusion, the findings demonstrate that ACT/DSA upregulates ALDH2 expression via regulating SNW1/RXR, thereby inhibiting oxidative stress and maintaining MQC homeostasis, and then protects against cardiac hypertrophy.
Figures 
Graphical abstract
Graphical abstract
Graphical abstract
Fig. 1
ACT attenuates Ang II-induced hypertrophic…
Fig. 1
ACT attenuates Ang II-induced hypertrophic response and mitochondrial dysfunction in NRCMs. (a) MTT…
Fig. 1 ACT attenuates Ang II-induced hypertrophic response and mitochondrial dysfunction in NRCMs. (a) MTT assay for detecting the cytotoxicity of ACT on NRCMs. (b–d) RT-PCR to analyze the mRNA expressions of Anf, Bnp, and β-MHC induced by Ang II. (e–g) RT-PCR to analyze the mRNA expressions of Nox-4, Nrf-2, and HO-1 induced by Ang II. (h) Western blot to detect the protein expressions of Mfn1, Mfn2, Drp1, Pink1, and Parkin. (i–j) Quantitative analysis of Mfn1, Mfn2, Drp1, Pink1 and Parkin. (Mean ± SEM, ∗p < 0.05, ∗∗p < 0.01, ∗∗∗p < 0.001). (For interpretation of the references to colour in this figure legend, the reader is referred to the Web version of this article.)
Fig. 2
ACT and its active monomer…
Fig. 2
ACT and its active monomer DSA attenuate Ang II-induced hypertrophic responses in NRCMs…
Fig. 2 ACT and its active monomer DSA attenuate Ang II-induced hypertrophic responses in NRCMs in an ALDH2-dependent manner. (a) Chemical structure of DSA. (b) MTT assay for detecting the cytotoxicity of DSA on NRCMs. (c–d) RT-PCR to analyze the mRNA expressions of Anf and Bnp induced by Ang II. (e–f) Western blot to verify and quantify the overexpression and knockdown efficiency of ALDH2. (g–h) After overexpression and knockdown of ALDH2 by lentivirus, the mRNA levels of Anf and Bnp in NRCMs induced by Ang II were detected by RT-RCR. (Mean ± SEM, ∗p < 0.05, ∗∗p < 0.01, ∗∗∗p < 0.001 versus Control group; #p < 0.05, ##p < 0.01, ###p < 0.001 versus Ang II group; ∗p < 0.05, ∗∗p < 0.01, ∗∗∗p < 0.001; &&p < 0.01, &&&p < 0.001).
Fig. 3
ALDH2 mediates the anti-cardiac hypertrophic…
Fig. 3
ALDH2 mediates the anti-cardiac hypertrophic effects of ACT in the Ang II-induced mouse…
Fig. 3 ALDH2 mediates the anti-cardiac hypertrophic effects of ACT in the Ang II-induced mouse model. (a) H&E staining of mouse heart tissues. (b) Quantitative analysis of HW/BW. (c) Quantitative analysis of HW/TL. (d–f) RT-PCR to analyze the mRNA expressions of Anf, Bnp and β-MHC in the heart tissues of WT mice. (g–i) RT-PCR to analyze the mRNA expressions of Anf, Bnp and β-MHC in the heart tissues of ALDH2−/− mice. (Mean ± SEM, ∗p < 0.05, ∗∗p < 0.01, ∗∗∗p < 0.001).
Fig. 4
ALDH2 mediates the anti-cardiac hypertrophic…
Fig. 4
ALDH2 mediates the anti-cardiac hypertrophic effects of ACT in the TAC-induced mouse model.…
Fig. 4 ALDH2 mediates the anti-cardiac hypertrophic effects of ACT in the TAC-induced mouse model. (a) H&E staining of mice heart tissues. (b) Quantitative analysis of HW/BW. (c) Quantitative analysis of HW/TL. (d–f) RT-PCR to analyze the mRNA expressions of Anf, Bnp, and β-MHC in the heart tissues of WT mice. (g–i) RT-PCR to analyze the mRNA expressions of Anf, Bnp, and β-MHC in the heart tissues of ALDH2−/− mice. (Mean ± SEM, ∗p < 0.05, ∗∗p < 0.01, ∗∗∗p < 0.001).
Fig. 5
ALDH2 mediates the effects of…
Fig. 5
ALDH2 mediates the effects of ACT in the attenuation of oxidative stress in…
Fig. 5 ALDH2 mediates the effects of ACT in the attenuation of oxidative stress in cardiac hypertrophy model. (a) 4-hydroxynonenal levels in the heart tissues of the Ang II-induced WT and ALDH2 −/− mice. (b) 4-hydroxynonenal levels in the heart tissues of the TAC-induced WT and ALDH2 −/− mice. (c) In WT mouse myocardial tissues, RT-PCR to detect mRNA levels of SOD-1, SOD-2, Nrf-2, and HO-1 in the Ang II-induced mouse model. (d) In ALDH2−/− mouse myocardial tissues, RT-PCR to detect mRNA levels of SOD-1, SOD-2, Nrf-2, and HO-1 in the Ang II-induced mouse model. (Mean ± SEM, ∗p < 0.05, ∗∗p < 0.01, ∗∗∗p < 0.001).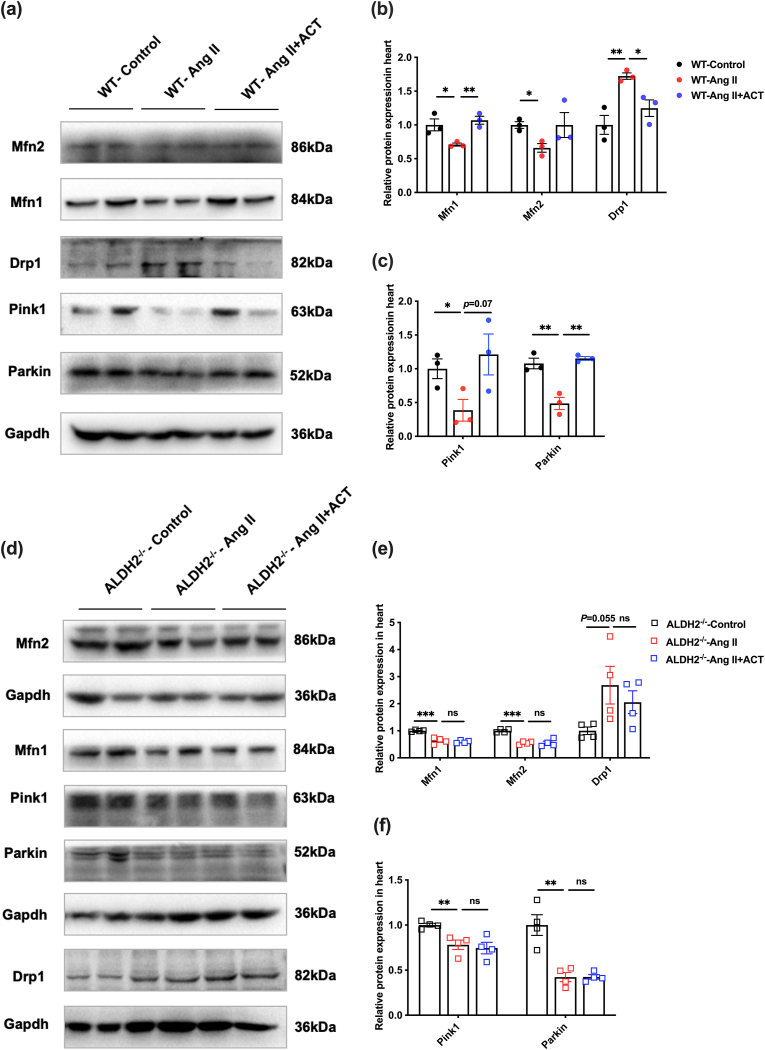
Fig. 6
ALDH2 mediates the effects of…
Fig. 6
ALDH2 mediates the effects of ACT in the improvement of MQC impairment in…
Fig. 6 ALDH2 mediates the effects of ACT in the improvement of MQC impairment in the cardiac hypertrophy mouse model. (a) In the WT mouse myocardial tissues, Western blot to detect the protein expressions of Mfn1, Mfn2, Drp1, Pink1, and Parkin in the Ang II-induced mice. (b–c) Quantitative analysis of Mfn1, Mfn2, Drp1, Pink1, and Parkin. (d) In the ALDH2−/− mouse myocardial tissues, Western blot to detect the protein expressions of Mfn1, Mfn2, Drp1, Pink1, and Parkin in the Ang II-induced mice. (e–f) Quantitative analysis of Mfn1, Mfn2, Drp1, Pink1 and Parkin. (Mean ± SEM, ∗p < 0.05, ∗∗p < 0.01, ∗∗∗p < 0.001). (For interpretation of the references to colour in this figure legend, the reader is referred to the Web version of this article.)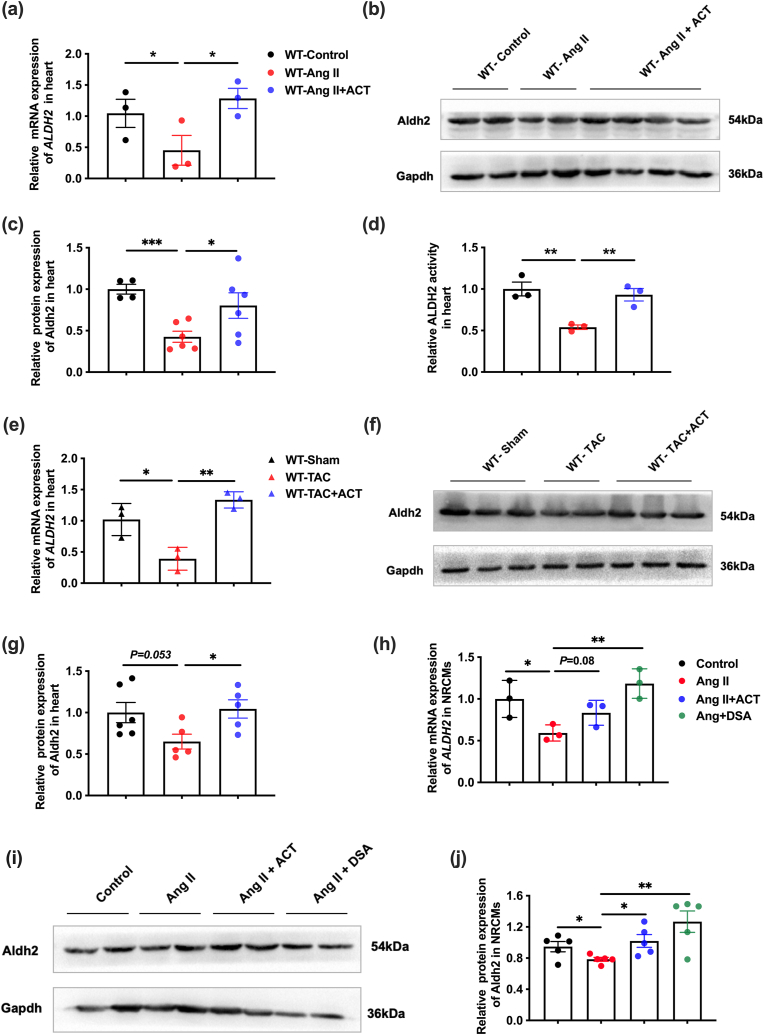
Fig. 7
ACT up-regulates ALDH2 expression and…
Fig. 7
ACT up-regulates ALDH2 expression and activity in vivo and in vitro . (a)…
Fig. 7 ACT up-regulates ALDH2 expression and activity in vivo and in vitro. (a) RT-PCR to analyze the mRNA levels of cardiac ALDH2 in the Ang II-induced cardiac hypertrophy mice. (b–c) Western blot to detect and quantify cardiac ALDH2 protein levels in the Ang II-induced cardiac hypertrophy mice. (d) Quantitative analysis of cardiac ALDH2 activity in the Ang II-induced cardiac hypertrophy mice. (e) RT-PCR to analyze the mRNA levels of cardiac ALDH2 in the TAC-induced cardiac hypertrophy mice. (f–g) Western blot to detect and quantify cardiac ALDH2 protein levels in the TAC-induced cardiac hypertrophy mice. (h) RT-PCR to detect the mRNA level of ALDH2 in NRCMs on the Ang II-induced hypertrophy cell model. (i–j) Western blot to detect and quantify the protein level of ALDH2 in NRCMs on the Ang II-induced hypertrophy cell model. (Mean ± SEM, ∗p < 0.05, ∗∗p < 0.01).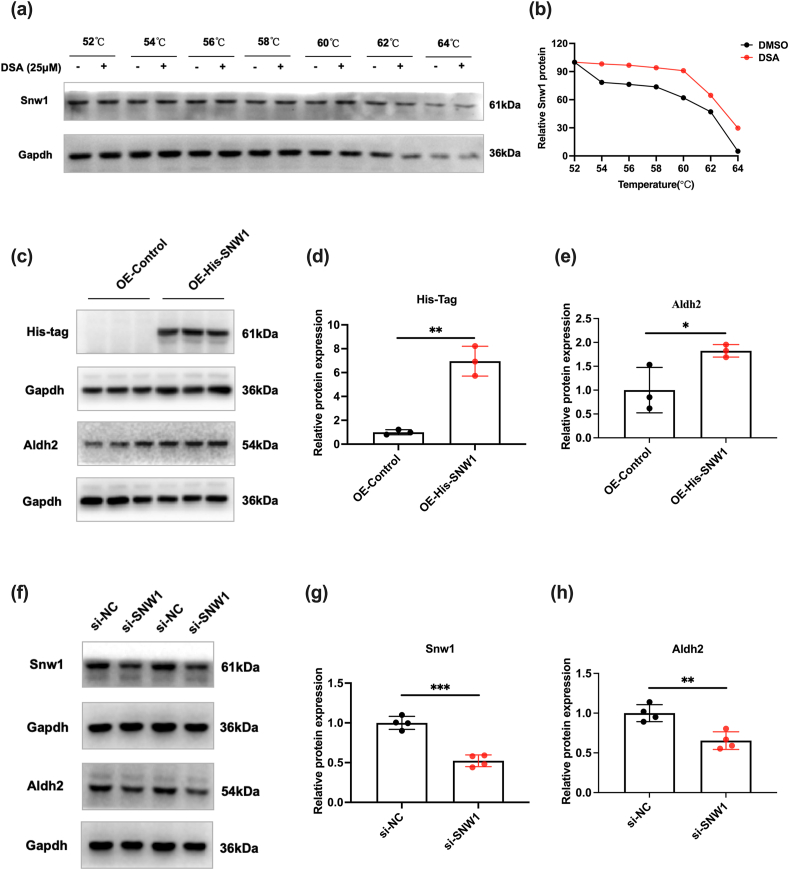
Fig. 8
SNW1 as a binding protein…
Fig. 8
SNW1 as a binding protein for DSA is involved in regulating ALDH2 expression.…
Fig. 8 SNW1 as a binding protein for DSA is involved in regulating ALDH2 expression. (a) CETSA assay confirmed the binding of DSA to SNW1 in NRCMs, and GAPDH was used as the internal control. (b) The graph shows the quantification of SNW1 protein versus temperature points based on Western blot analyses. (c–e) Western blot to detect and quantify His-tag and ALDH2 protein levels in NRCMs after overexpression of SNW1. (f–h) Western blot to detect and quantify SNW1 and ALDH2 protein levels in NRCMs after knockdown of SNW1. (Mean ± SEM, ∗p < 0.05, ∗∗p < 0.01, ∗∗∗p < 0.001).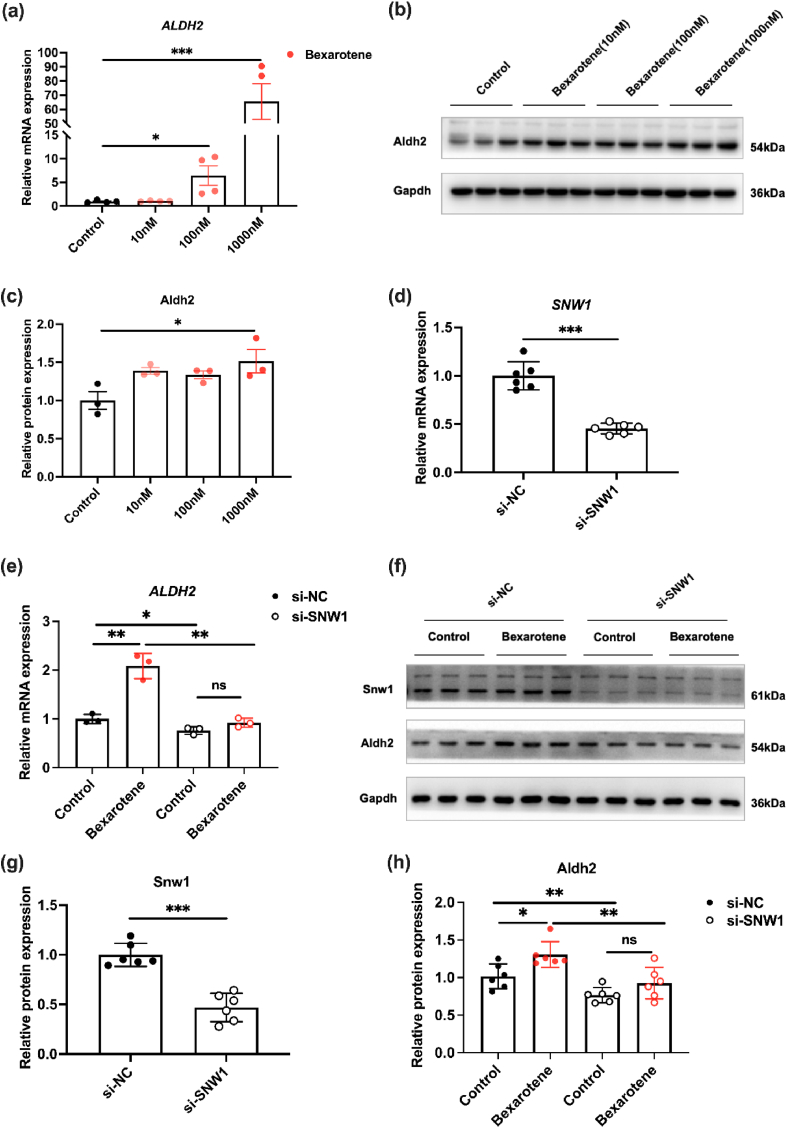
Fig. 9
SNW1 regulates ALDH2 expression by…
Fig. 9
SNW1 regulates ALDH2 expression by co-operating with RXR. (a) RT-PCR to detect ALDH2…
Fig. 9 SNW1 regulates ALDH2 expression by co-operating with RXR. (a) RT-PCR to detect ALDH2 mRNA levels in NRCMs following the administration of bexarotene. (b–c) Western blot to detect and quantify ALDH2 protein levels in NRCMs following the administration of bexarotene. (d) RT-PCR to detect the mRNA level of SNW1 in NRCMs after knockdown of SNW1. (e) RT-PCR to detect the mRNA level of ALDH2 in NRCMs after administration of bexarotene, following knockdown of SNW1. (f) Western blot to detect the protein levels of SNW1 and ALDH2 in NRCMs after administration of bexarotene, following knockdown of SNW1. (g–h) Quantitative analysis of SNW1 and ALDH2. (Mean ± SEM, ∗p < 0.05, ∗∗p < 0.01, ∗∗∗p < 0.001). All figures (10)