Antrodia cinnamomea, a Treasured Medicinal Mushroom, Induces Growth Arrest in Breast Cancer Cells, T47D Cells: New Mechanisms Emerge
Abstract
Reported cases of breast cancer have skyrocketed in the last decades with recent advances in examination techniques. Brest cancer has become the second leading cause of mortality among women worldwide, urging the scientific community to develop or find new drugs from natural sources with potent activity and a reasonable safety profile to tackle this ailment. Antrodia cinnamomea (AC) is a treasured medicinal fungus which has attracted attention due to its potent hepatoprotective and cytotoxic activities. We evaluated the antiproliferative activity of the ethanol extract of artificially cultured AC (EEAC) on breast cancer cells (T47D cells) in vivo and in vitro. Ethanol extract of artificially cultured AC inhibited T47D cells' proliferation mediated by cell cycle arrest at G1 phase as well induced autophagy. Immunoblotting assay confirmed that EEAC not only decreased the expression of the cell-cycle-related proteins but also increased the expression of transcription factor FOXO1, autophagic marker LC3 II, and p62. Ethanol extract of artificially cultured AC mediated endoplasmic reticulum stress by promoting the expression of IRE1 (inositol-requiring enzyme 1α), GRP78/Bip (glucose regulating protein 78), and CHOP (C/EBP homologous protein). Apart from previous studies, HDACs (histone deacetylases) activity was inhibited as demonstrated by a cell-free system, immunoblotting, and immunofluorescence assays following EEAC treatment. The in vivo studies demonstrated that EEAC decreased tumor volume and inhibited tumor growth without any significant side effects. High performance liquid chromatography profile demonstrated similar triterpenoids compared to the profile of wild AC ethanol extract. The multiple targets of EEAC on breast cancer cells suggested that this extract may be developed as a potential dietary supplement targeting this debilitating disease.
Figures 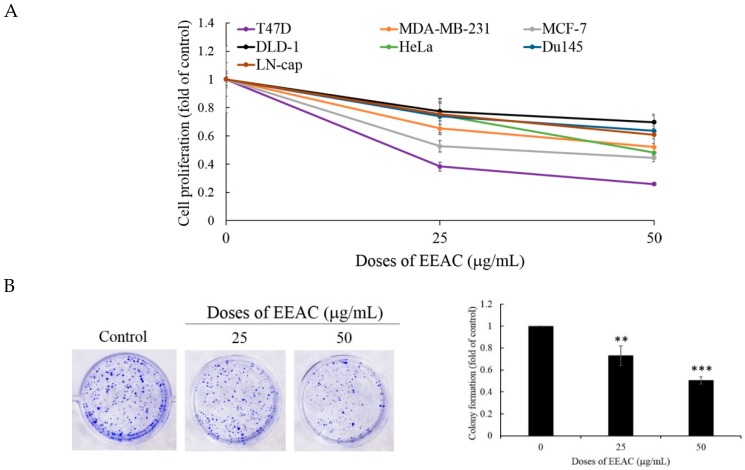
Figure 1
Ethanol extract of artificially cultured…
Figure 1
Ethanol extract of artificially cultured AC (EEAC) (25 and 50 μg/mL) inhibited cancer…
Figure 1 Ethanol extract of artificially cultured AC (EEAC) (25 and 50 μg/mL) inhibited cancer cell proliferation without the induction of cellular apoptosis and disruption of mitochondrial membrane potential. (A) Human cancer cell lines were treated with EEAC and incubated for 72 h and assessed by MTT assay; (B) effect of EEAC on colony formation in T47D cells; T47D cells were treated with EEAC, incubated for 48 h, and stained with (C) Annexin V and propidium iodide and (D) Rhodamine 123; (E) the expression of pro-apoptosis protein caspases-3, -8, and -9 was determined by Western blot assay. Actin was used as the loading control. All results are presented as mean ± SD of at least three experiments, ** p < 0.01; *** p < 0.001.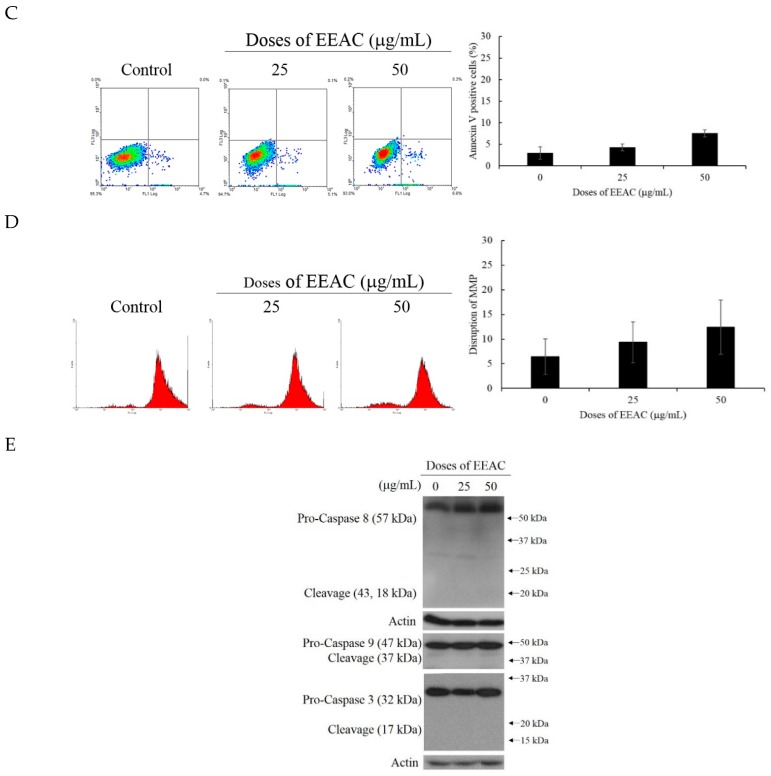
Figure 1
Ethanol extract of artificially cultured…
Figure 1
Ethanol extract of artificially cultured AC (EEAC) (25 and 50 μg/mL) inhibited cancer…
Figure 1 Ethanol extract of artificially cultured AC (EEAC) (25 and 50 μg/mL) inhibited cancer cell proliferation without the induction of cellular apoptosis and disruption of mitochondrial membrane potential. (A) Human cancer cell lines were treated with EEAC and incubated for 72 h and assessed by MTT assay; (B) effect of EEAC on colony formation in T47D cells; T47D cells were treated with EEAC, incubated for 48 h, and stained with (C) Annexin V and propidium iodide and (D) Rhodamine 123; (E) the expression of pro-apoptosis protein caspases-3, -8, and -9 was determined by Western blot assay. Actin was used as the loading control. All results are presented as mean ± SD of at least three experiments, ** p < 0.01; *** p < 0.001.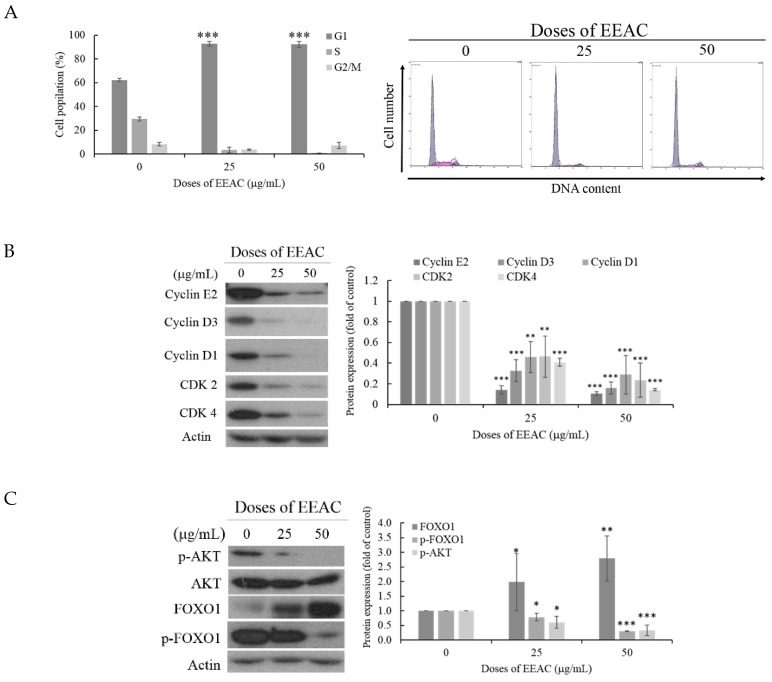
Figure 2
Effect of EEAC on cell…
Figure 2
Effect of EEAC on cell cycle progression and autophagy induction. T47D cells were…
Figure 2 Effect of EEAC on cell cycle progression and autophagy induction. T47D cells were treated with EEAC (25 and 50 μg/mL) for 48 h. (A) Determination of cell cycle progression using flow cytometry and quantification was done by MultiCycle software. (B) Expression of G1 phase-related proteins cyclin E2, cyclin D3, and cyclin D1, CDK2, and CDK4 was determined by Western blot assay. (C) Expression of AKT/FOXO1 signaling pathway proteins was determined by Western blot assay. (D) Expression of autophagy-related proteins LC3 II and p62 was determined by Western blot assay. Actin was used as the loading control. All the results are presented as mean ± SD of at least three experiments, * p < 0.05; ** p < 0.01; *** p < 0.001.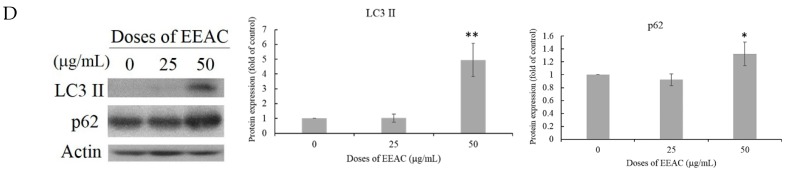
Figure 2
Effect of EEAC on cell…
Figure 2
Effect of EEAC on cell cycle progression and autophagy induction. T47D cells were…
Figure 2 Effect of EEAC on cell cycle progression and autophagy induction. T47D cells were treated with EEAC (25 and 50 μg/mL) for 48 h. (A) Determination of cell cycle progression using flow cytometry and quantification was done by MultiCycle software. (B) Expression of G1 phase-related proteins cyclin E2, cyclin D3, and cyclin D1, CDK2, and CDK4 was determined by Western blot assay. (C) Expression of AKT/FOXO1 signaling pathway proteins was determined by Western blot assay. (D) Expression of autophagy-related proteins LC3 II and p62 was determined by Western blot assay. Actin was used as the loading control. All the results are presented as mean ± SD of at least three experiments, * p < 0.05; ** p < 0.01; *** p < 0.001.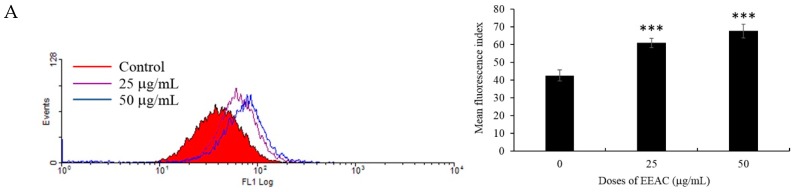
Figure 3
Effect of EEAC on endoplasmic-reticulum…
Figure 3
Effect of EEAC on endoplasmic-reticulum (ER). T47D cells were treated with EEAC (25…
Figure 3 Effect of EEAC on endoplasmic-reticulum (ER). T47D cells were treated with EEAC (25 and 50 μg/mL) for 48 h. (A) Cells were collected and stained with Fluo-3 AM for the determination of Ca2+ concentration and analyzed using flow cytometry. (B) Expression of ER stress sensor proteins IRE1 (inositol-requiring enzyme 1α), PERK (pancreatic endoplasmic reticulum kinase), and ATF-6 (activating transcription factor 6), as well as ER stress marker GRP78/Bip and CCAAT-enhancer-binding protein homologous protein (CHOP), was determined by Western blot assay. Actin was used as the loading control. (C) Confocal microscopy image of GRP78/Bip (red) and CHOP (green) stained T47D cells were treated with EEAC (50 μg/mL) for 48 h. Cells were counterstained with DAPI to label cells nuclei (blue). All the results are presented as mean ± SD of at least three experiments, ** p < 0.01; *** p < 0.001.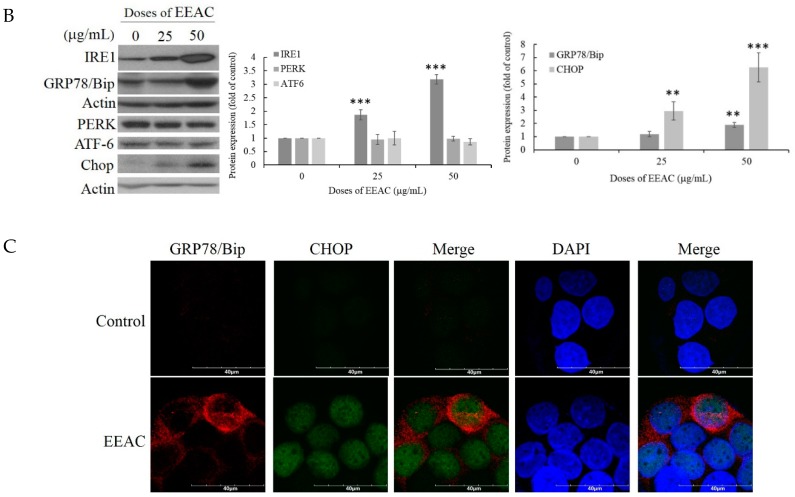
Figure 3
Effect of EEAC on endoplasmic-reticulum…
Figure 3
Effect of EEAC on endoplasmic-reticulum (ER). T47D cells were treated with EEAC (25…
Figure 3 Effect of EEAC on endoplasmic-reticulum (ER). T47D cells were treated with EEAC (25 and 50 μg/mL) for 48 h. (A) Cells were collected and stained with Fluo-3 AM for the determination of Ca2+ concentration and analyzed using flow cytometry. (B) Expression of ER stress sensor proteins IRE1 (inositol-requiring enzyme 1α), PERK (pancreatic endoplasmic reticulum kinase), and ATF-6 (activating transcription factor 6), as well as ER stress marker GRP78/Bip and CCAAT-enhancer-binding protein homologous protein (CHOP), was determined by Western blot assay. Actin was used as the loading control. (C) Confocal microscopy image of GRP78/Bip (red) and CHOP (green) stained T47D cells were treated with EEAC (50 μg/mL) for 48 h. Cells were counterstained with DAPI to label cells nuclei (blue). All the results are presented as mean ± SD of at least three experiments, ** p < 0.01; *** p < 0.001.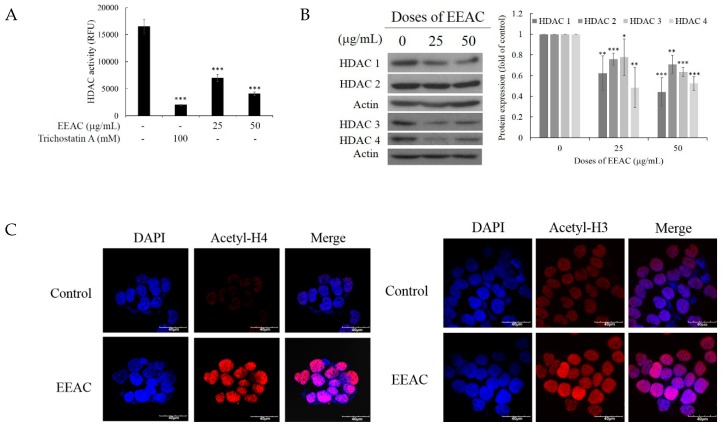
Figure 4
Effect of EEAC on histone…
Figure 4
Effect of EEAC on histone deacetylase activity. ( A ) The effect of…
Figure 4 Effect of EEAC on histone deacetylase activity. (A) The effect of EEAC on HDAC mediated deacetylation in the cell-free system. (B) T47D cells were treated with EEAC (25 and 50 μg/mL) for 48 h and the expression of HDACs 1, 2, 3, and 4 was determined by Western blot assay. Actin was used as the loading control. (C) Confocal microscopy image of acetyl-H3 and acetyl-H4 stained T47D cells treated with EEAC (50 μg/mL) for 48 h. Cells were counterstained with DAPI to label cells nuclei (blue). All the results are presented as mean ± SD of at least three experiments, * p < 0.05; ** p < 0.01; *** p < 0.001.
Figure 5
Anti-tumor effect of EEAC on…
Figure 5
Anti-tumor effect of EEAC on tumor growth in vivo animal model. Tumor-bearing nude…
Figure 5 Anti-tumor effect of EEAC on tumor growth in vivo animal model. Tumor-bearing nude mice were treated with DMSO or EEAC (100 μg/g) for 87 days (each group contained five mice). (A) Photo of tumors (left) and the histogram results of tumor weights (right). (B) Tumor volumes were measured every other day. (C) Effect of EEAC on the increase of tumor volume. (D) Nude mice body weights were measured every other day. (E) Chemical plasma profiles were determined with FUJIFILM colorimetric analyzer (DRI-Chem 3000). (F,G) Tissue sections from nude mice organs were stained with hematoxylin and eosin (400×). All the results are presented as mean ± SD, ** p < 0.01.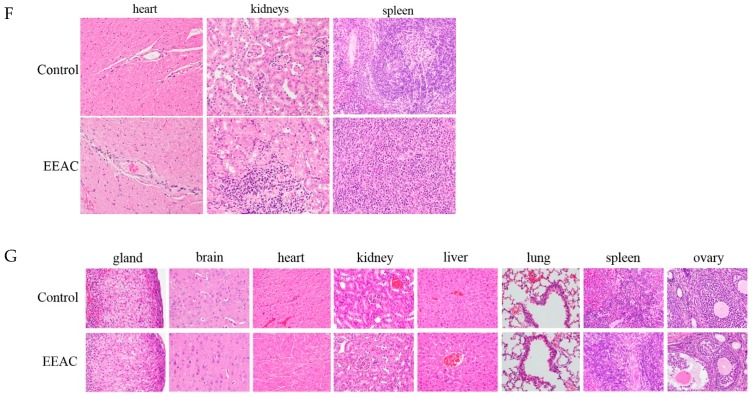
Figure 5
Anti-tumor effect of EEAC on…
Figure 5
Anti-tumor effect of EEAC on tumor growth in vivo animal model. Tumor-bearing nude…
Figure 5 Anti-tumor effect of EEAC on tumor growth in vivo animal model. Tumor-bearing nude mice were treated with DMSO or EEAC (100 μg/g) for 87 days (each group contained five mice). (A) Photo of tumors (left) and the histogram results of tumor weights (right). (B) Tumor volumes were measured every other day. (C) Effect of EEAC on the increase of tumor volume. (D) Nude mice body weights were measured every other day. (E) Chemical plasma profiles were determined with FUJIFILM colorimetric analyzer (DRI-Chem 3000). (F,G) Tissue sections from nude mice organs were stained with hematoxylin and eosin (400×). All the results are presented as mean ± SD, ** p < 0.01.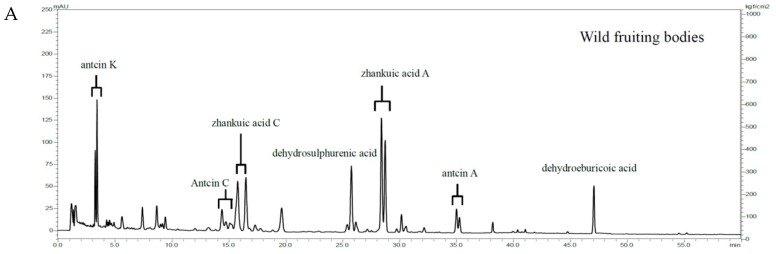
Figure 6
HPLC profiles of AC major…
Figure 6
HPLC profiles of AC major triterpenoids of the ethanol extract of ( A…
Figure 6 HPLC profiles of AC major triterpenoids of the ethanol extract of (A) wild fruiting bodies and (B) dish-cultured product (EEAC).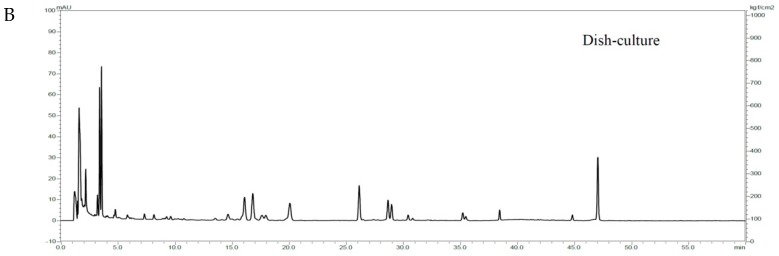
Figure 6
HPLC profiles of AC major…
Figure 6
HPLC profiles of AC major triterpenoids of the ethanol extract of ( A…
Figure 6 HPLC profiles of AC major triterpenoids of the ethanol extract of (A) wild fruiting bodies and (B) dish-cultured product (EEAC). All figures (11)