Antrodia cinnamomea reduces obesity and modulates the gut microbiota in high-fat diet-fed mice
Abstract
Figures 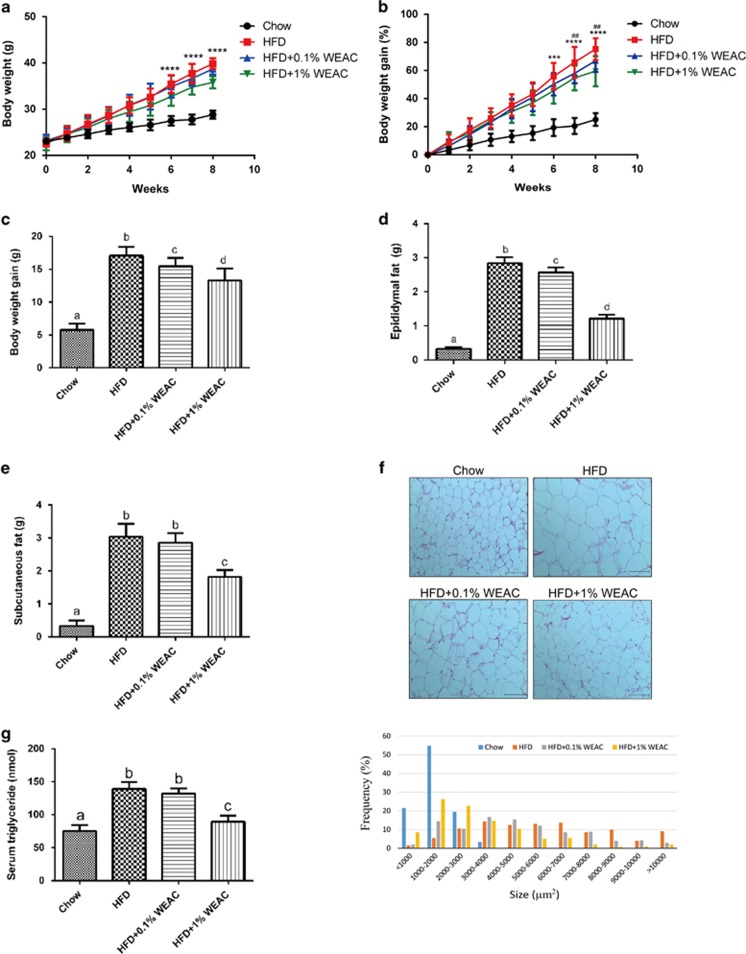
Figure 1
WEAC supplementation reduces body weight…
Figure 1
WEAC supplementation reduces body weight and fat accumulation in HFD-fed mice. Chow-fed mice…
Figure 1 WEAC supplementation reduces body weight and fat accumulation in HFD-fed mice. Chow-fed mice (n=21) and HFD-fed mice (n=15) were treated daily with 200 μl of either double-distilled water as control or WEAC at 0.1% (n=15) or 1% (w/v) (n=15) by intragastric gavage for 8 weeks. Effects of WEAC treatment on body weight (a), relative and absolute body weight gain (b and c), epididymal fat (d), subcutaneous fat (e), epididymal adipocyte size (f) and serum triglycerides (g). Parameters shown in c–g were measured after eight weeks of feeding. In f, adipocyte size was estimated using Adiposoft from the ImageJ software. Scale bars, 50 μm. Data are expressed as means±s.d. from three independent experiments. Body weight differences in a and b were analyzed using two-way ANOVA Bonferroni post hoc test (##P<0.01 for HFD+0.1% WEAC vs HFD; ***P<0.001 and ****P<0.0001 for HFD+1% WEAC vs HFD). Graph bars with different letters on top correspond to statistically significant results (P<0.05) based on Bonferroni post hoc one-way ANOVA analysis.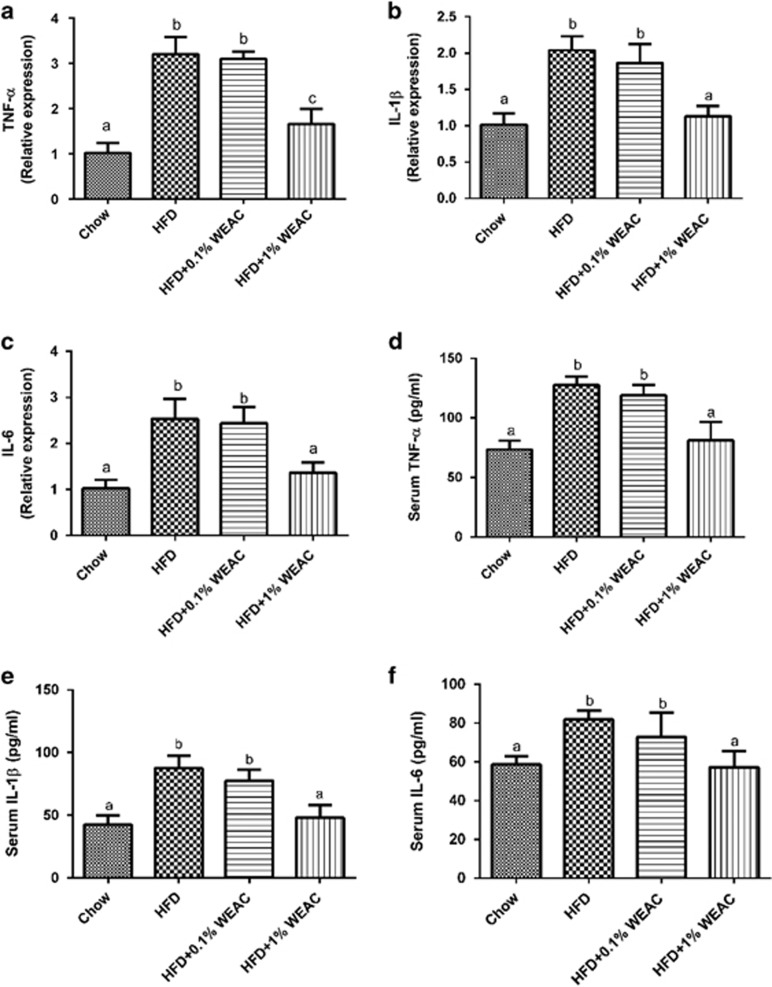
Figure 2
WEAC reduces pro-inflammatory cytokine expression…
Figure 2
WEAC reduces pro-inflammatory cytokine expression and production in HFD-fed mice. Mice were treated…
Figure 2 WEAC reduces pro-inflammatory cytokine expression and production in HFD-fed mice. Mice were treated as in Figure 1. Relative expression of TNF-α (a), IL-1β (b), and IL-6 (c) in EAT was assessed using qRT-PCR. Expression was normalized against GAPDH. TNF-α (d), IL-1β (e) and IL-6 (f) protein levels in the serum of chow-fed and HFD-fed mice were determined using ELISA (n=5 for each group). Data are shown as means±s.d. Graph bars with different letters on top correspond to statistically significant results (P<0.05) based on Bonferroni post hoc one-way ANOVA analysis.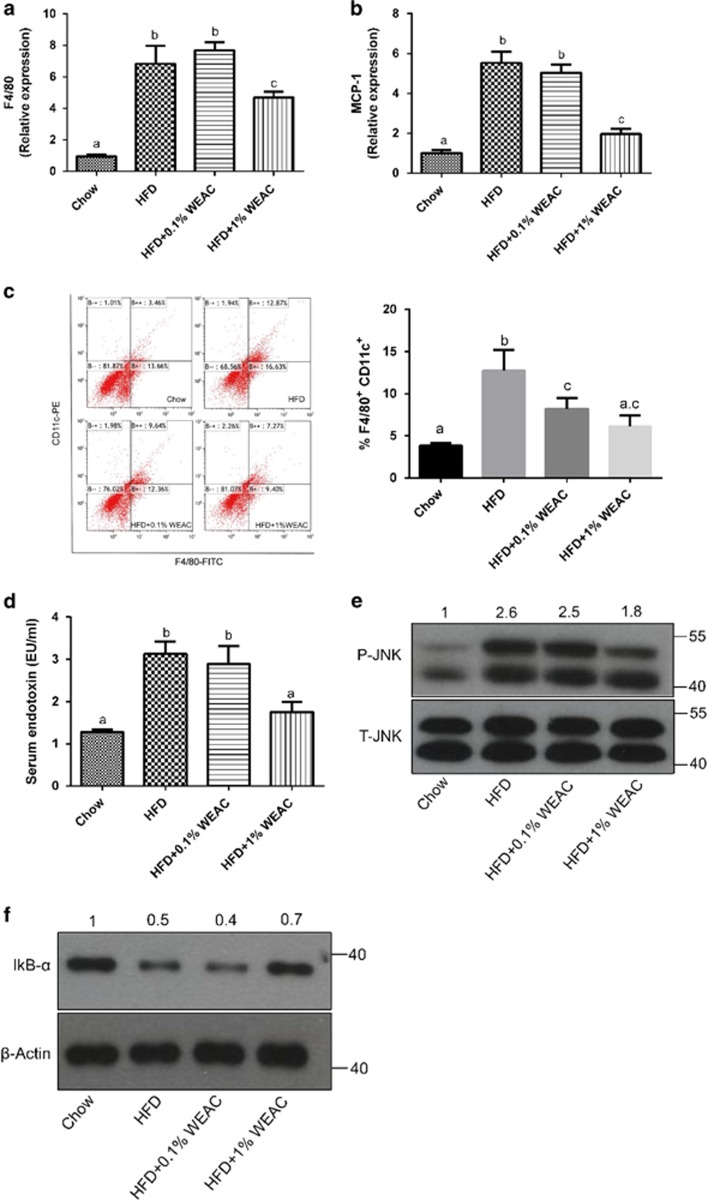
Figure 3
WEAC reduces macrophage infiltration, serum…
Figure 3
WEAC reduces macrophage infiltration, serum endotoxin and pro-inflammatory signaling pathways in HFD-fed mice.…
Figure 3 WEAC reduces macrophage infiltration, serum endotoxin and pro-inflammatory signaling pathways in HFD-fed mice. Effects of WEAC on mRNA expression levels of F4/80 (a) and MCP-1 (b) in EAT as assessed by qRT-PCR (n=5 for each group). Mice were treated as in Figure 1. Relative mRNA expression levels represent means±s.d. Expression level was normalized against GAPDH. Macrophage infiltration in EAT (c) was determined by flow cytometry; quantification is shown in the panel on the right. Effect of WEAC on serum endotoxin (LPS) (d) was assessed using the limulus amebocyte lysate assay kit and expressed as means±s.d. of serum endotoxin units per ml. Effects of WEAC on P-JNK (e) and IκB-α (f) was assessed using Western blotting. In e, the anti-JNK antibodies (P-JNK and T-JNK) react against the two JNK isoforms p54 and p46. In e and f, relative band intensities for P-JNK and IκB-α were determined by densitometry analysis (values shown on top of each blot; for P-JNK, the values represent the average intensity of the two bands). Graph bars with different letters on top correspond to statistically significant results (P<0.05) based on Bonferroni post hoc one-way ANOVA analysis.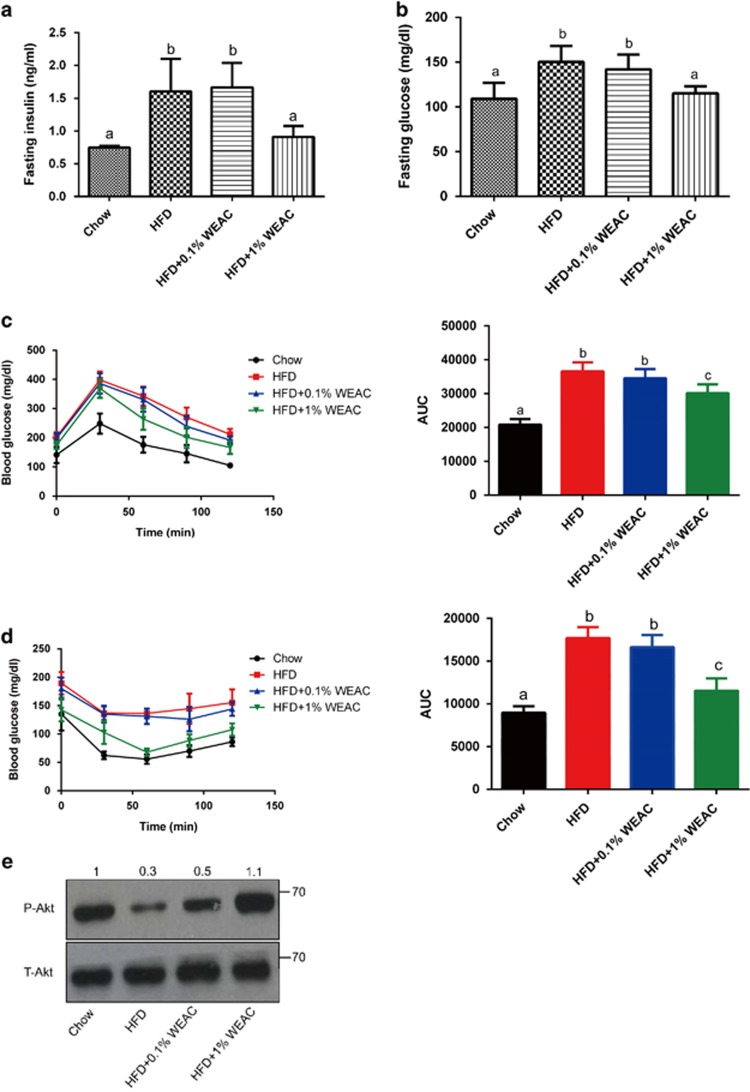
Figure 4
WEAC supplementation reduces HFD-induced insulin…
Figure 4
WEAC supplementation reduces HFD-induced insulin resistance. Effects of WEAC on fasting insulin (…
Figure 4 WEAC supplementation reduces HFD-induced insulin resistance. Effects of WEAC on fasting insulin (a), fasting glucose (b), oral glucose tolerance test (c), insulin tolerance test (d) and phosphorylation of Akt in EAT (e) (n=5 for each group). T-Akt refers to total Akt. Insulin and glucose levels were monitored using commercial ELISA kit and a glucose meter, respectively. The areas under the curve (AUC) in (c, d) (right panels) are also shown. Graph bars with different letters on top correspond to statistically significant results (P<0.05) based on Bonferroni post hoc one-way ANOVA analysis. In e, relative P-Akt band intensities determined by densitometry analysis are shown on top.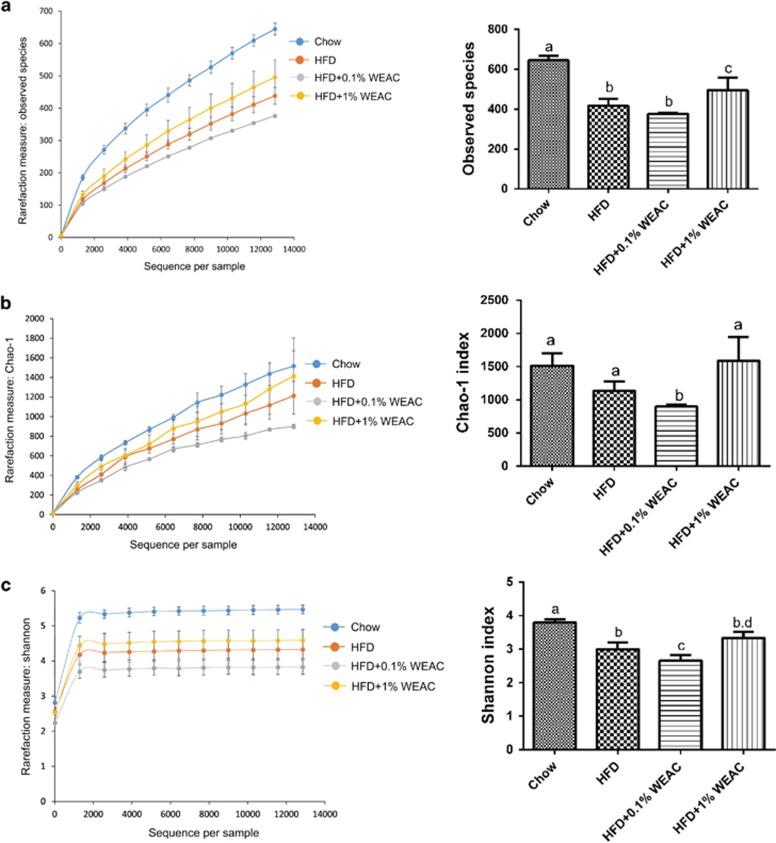
Figure 5
Diversity analysis of WEAC-treated gut…
Figure 5
Diversity analysis of WEAC-treated gut microbiota. Observed species ( a ), Chao-1 index…
Figure 5 Diversity analysis of WEAC-treated gut microbiota. Observed species (a), Chao-1 index (b) and Shannon index (c) of fecal samples from mice fed with chow (n=4), HFD (n=4), HFD+0.1% WEAC (n=4) or HFD+1% WEAC (n=3). Graph bars with different letters on top correspond to statistically significant results (P<0.05) based on Bonferroni post hoc one-way ANOVA analysis.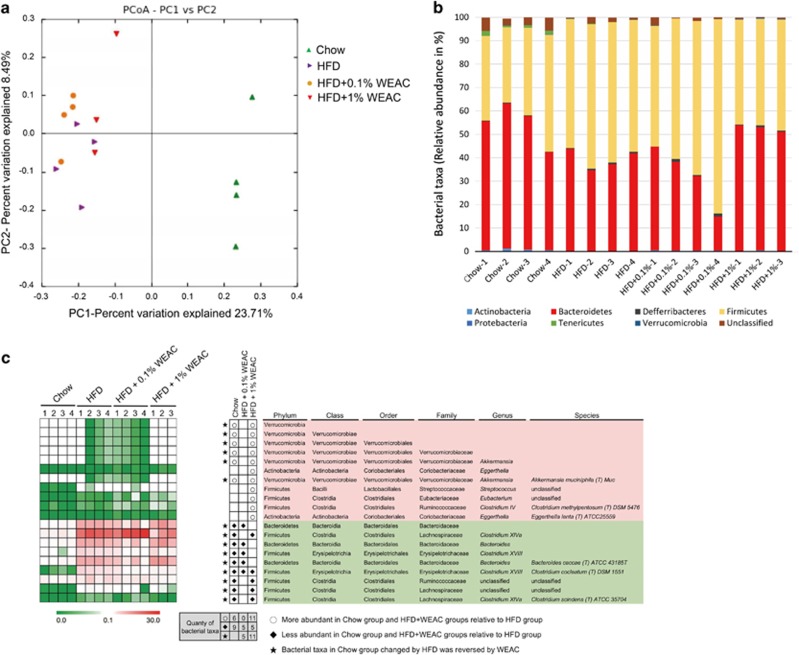
Figure 6
WEAC supplementation alters microbiota composition…
Figure 6
WEAC supplementation alters microbiota composition in HFD-fed mice. Microbiota composition in feces of…
Figure 6 WEAC supplementation alters microbiota composition in HFD-fed mice. Microbiota composition in feces of chow-fed mice (n=4), HFD mice (n=4) treated with 0.1% (n=4) or 1% WEAC (n=3) was analyzed using next-generation sequencing and bioinformatics analysis. (a) UniFrac-based PCoA plots. (b) Bacterial taxonomic profiling of intestinal bacteria from different mouse groups at the phylum level. (c) Heat map showing the abundance of bacterial taxa significantly altered by WEAC in HFD-fed mice. Bacterial taxa information (phylum, class, order, family, genus and species) is shown in the right panel. White circles and black diamonds indicate the bacterial taxa that respectively increased and decreased in chow-fed and HFD+WEAC-fed groups compared with the HFD-fed group. Black stars represent bacterial taxa whose abundance in chow-fed mice was altered by HFD and reversed by WEAC.