Antrodia cinnamomea extract alleviates bleomycin-induced pulmonary fibrosis in mice by inhibiting the mTOR pathway
Abstract
Figures 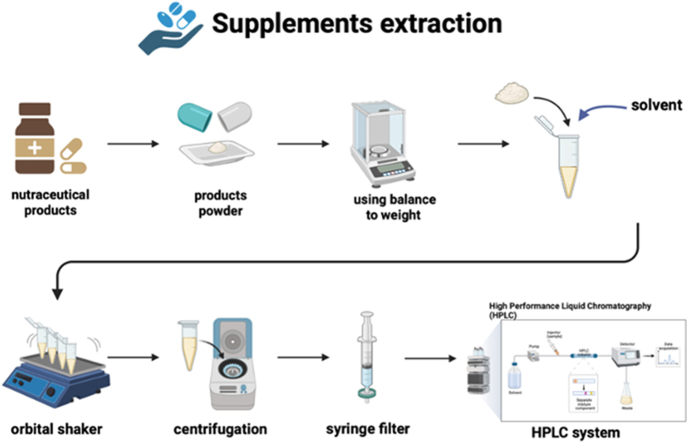
Graphical abstract
Graphical abstract
Graphical abstract
Fig. 1
Characterization of the anti-oxidative and…
Fig. 1
Characterization of the anti-oxidative and anti-inflammatory properties of A. cinnamomea extract in vitro…
Fig. 1 Characterization of the anti-oxidative and anti-inflammatory properties of A. cinnamomea extract in vitro. (A) MRC-5 cells were incubated without or with xanthine (2.5 mU.mL)-xanthine oxidase (XO) and co-treated with A. cinnamomea (A.C.) extract for 2 h (filled bar), or without A. cinnamomea treatment (empty bar). At the end of treatment, cells were harvested for cell viability measurement by crystal violet staining. (B–D) Effects of A. cinnamomea on the pro-inflammatory cytokines expression of LPS-induced RAW264.7 cells. The cells were treated with LPS (10 ng/ml) in the presence of A. cinnamomea for 4 h (emtpy bars) and or 18 h (filled bars). The mRNA levels of pro-IL-1β (B), iNOS (C) and IL-6 (D) were determined by quantitative real-time RT-PCR. Values were normalized to β-actin and are expressed relative to the respective control group. ∗∗p < 0.01.
Fig. 2
Attenuation of ECM production through…
Fig. 2
Attenuation of ECM production through TGF-β1 stimulation of Akt-mTOR signaling on A. cinnamomea…
Fig. 2 Attenuation of ECM production through TGF-β1 stimulation of Akt-mTOR signaling on A. cinnamomea treatment. (A) Expression of collagen. MRC-5 fibroblasts were treated with TGF-β (1 ng/ml) in the presence of different concentrations of A. cinnamomea (A.C.) for 24 h. After treatment, cells were harvested for determination of cellular collagen contents by using Sirius Red/Fast Green Collagen Staining Kit to determine the ratio of collagen/non-collagen. (B) Expression of the fibrotic marker, fibronection. The mRNA levels of fibronection were determined by quantitative real-time RT-PCR. (C) Western blot analysis of the signaling molecules in the Akt-mTOR pathway after 24 h A. cinnamomea treatment. Values were normalized to β-actin and are expressed relative to the respective control group. ∗p < 0.05, ∗∗p < 0.01.
Fig. 3
A. cinnamomea treatment improved pulmonary…Fig. 3
A. cinnamomea treatment improved pulmonary respiratory function index (Penh) in a bleomycin-induced pulmonary… Fig. 3 A. cinnamomea treatment improved pulmonary respiratory function index (Penh) in a bleomycin-induced pulmonary fibrosis mouse model. Mice were intratracheally administered bleomycin or PBS on day 0, and started orally gavaging A. cinnamomea (A.C.) or PBS on day 3, orally once a day, five times a week for 18 days. Whole-body plethysmograph (WBP) was employed and Penh was used as a noninvasive index of airway dysfunction on days 3 (A) and 21 (B) after BLM administration. Penh values were determined relative to those of the PBS treatment controls. Each dot represents an individual mouse with the mean shown for n ≥ 6 per group. ∗p < 0.05, ∗∗p < 0.01, ∗∗∗p < 0.001.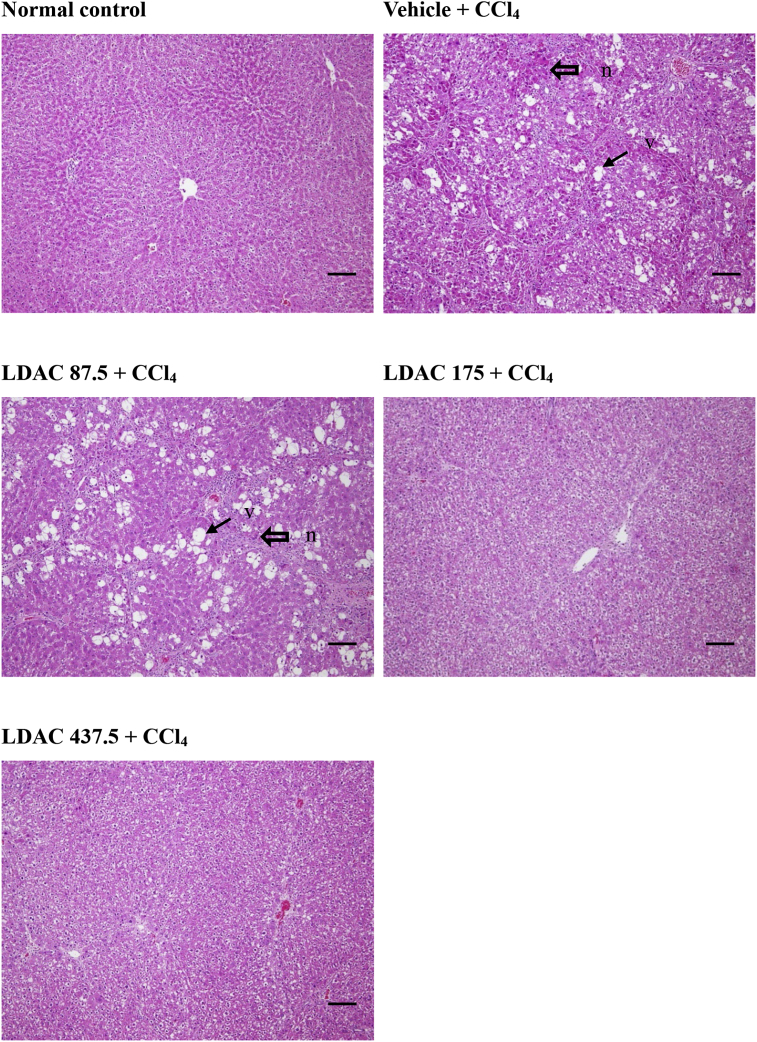
Fig. 4
Down-regulated expression of inflammatory factor…
Fig. 4
Down-regulated expression of inflammatory factor and fibrotic Indicators' genes on A. cinnamomea treatment…
Fig. 4 Down-regulated expression of inflammatory factor and fibrotic Indicators' genes on A. cinnamomea treatment of bleomycin-induced pulmonary fibrosis mice. Bleomycin and A. cinnamomea treatment of the mice was as in [Fig. 3]. The mice were sacrificed on 21 days after BLM administration, and total RNA was extracted from lung tissues of the mice for real-time RT-PCR analysis using specific primers set for inflammatory factor gene, IL-6 (A), and fibrotic indicator genes Col III (B), CTGF(C), Ltbp2 (D), and TIMP-1 (E). Each dot represents an individual mouse with the mean shown for n ≥ 6 per group. ∗p < 0.05.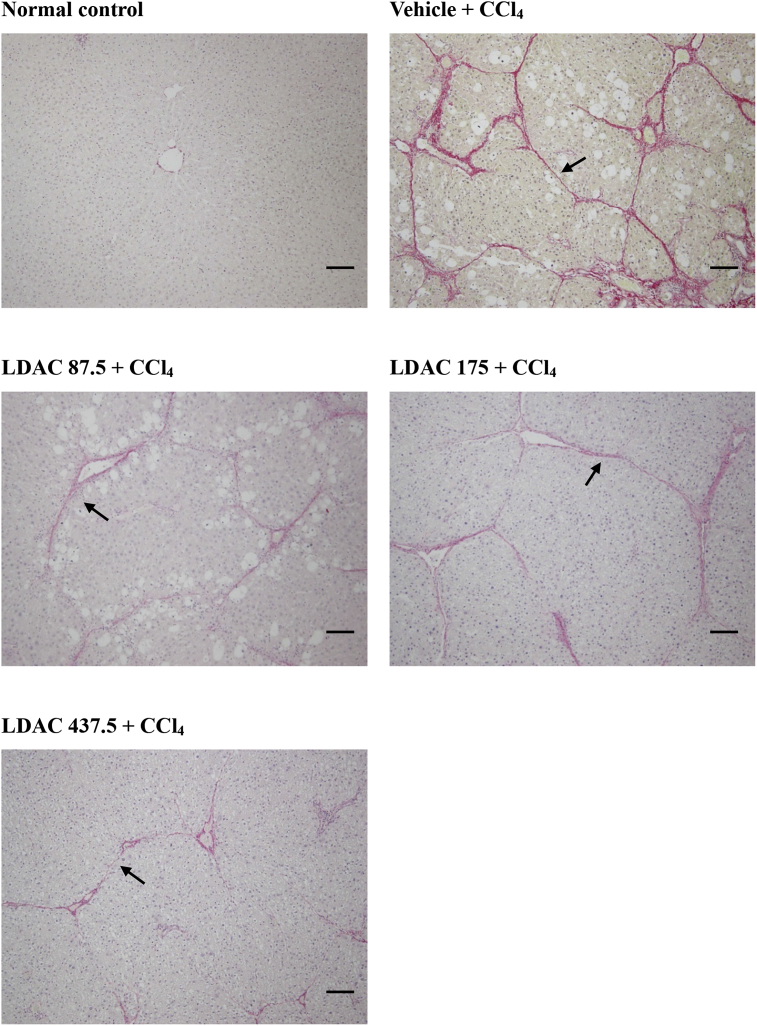
Fig. 5
Effects of A. cinnamomea extract…
Fig. 5
Effects of A. cinnamomea extract on histopathologic changes in bleomycin-induced pulmonary fibrosis mice.…
Fig. 5 Effects of A. cinnamomea extract on histopathologic changes in bleomycin-induced pulmonary fibrosis mice. Mice were administered bleomycin (BLM) or PBS on day 0, The treatment groups received orally with A. cinnamomea (A.C.), or PBS on day 3, orally once a day, five times a week for 18 days. Lung tissues were collected 21 days after bleomycin administration for sectioning and H&E staining. Mice were sacrificed on day 21 and lung samples were collected for further analysis. (A) Representative photographs of H&E and Masson's trichrome staining of lung tissue sections in the indicated groups. Scale bar: 100 μm. (B) Ashcroft fibrosis scores were used to evaluate the degree of lung fibrosis. Data are represented as the mean ± SEM (n ≥ 6 per group). #p < 0.05 compared with vehicle-treated control group. ∗p < 0.05 compared with BLM group.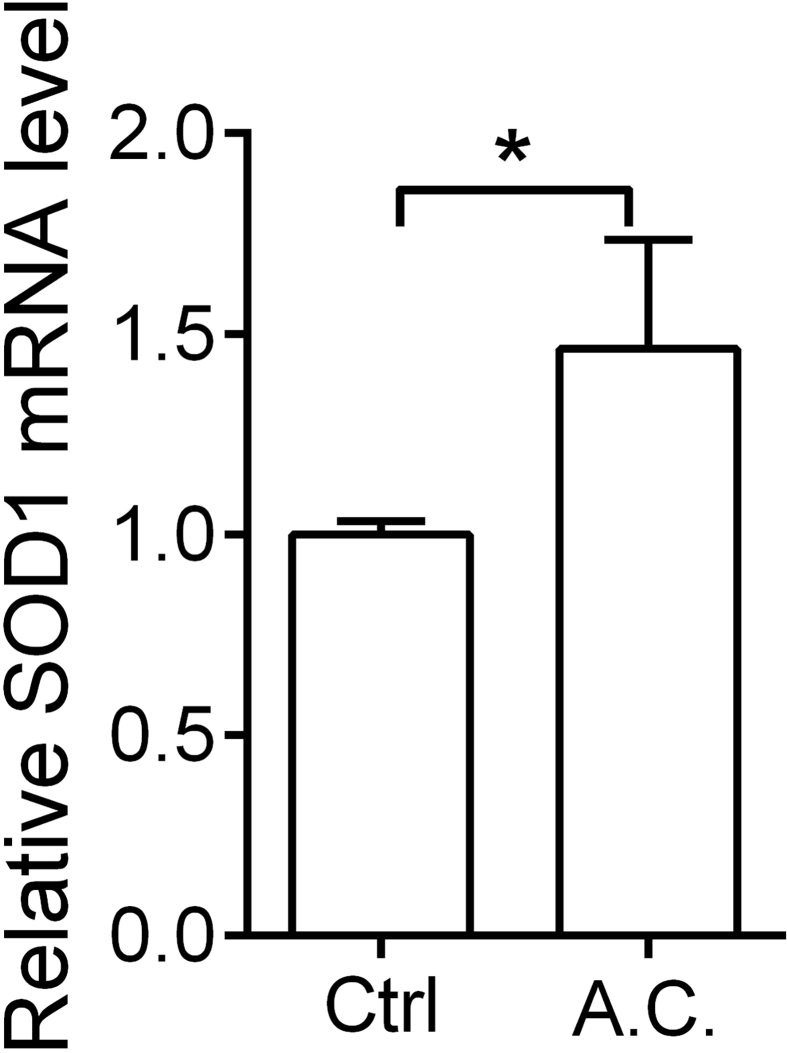
Supplementary Fig.1Effects of A. cinnamomea extract on…
Supplementary Fig.1Effects of A. cinnamomea extract on anti-oxidative gene expressions. MRC-5 cells were incubated without…
Supplementary Fig.1Effects of A. cinnamomea extract on anti-oxidative gene expressions. MRC-5 cells were incubated without or with A. cinnamomea (A.C.) extract for 24 h. Quantitative real-time RT-PCR was performed to examine the relative SOD1 mRNA expression levels. Values were normalized to β-actin and are expressed relative to the respective control group. ∗p < 0.05. All figures (7)