Antrocin Sensitizes Prostate Cancer Cells to Radiotherapy through Inhibiting PI3K/AKT and MAPK Signaling Pathways
Abstract
Radiotherapy is one of the most common treatment options for local or regional advanced prostate cancer (PCa). Importantly, PCa is prone to radioresistance and often develops into malignancies after long-term radiotherapy. Antrocin, a sesquiterpene lactone isolated from Antrodia cinnamomea, possesses pharmacological efficacy against various cancer types; however, its therapeutic potential requires comprehensive exploration, particularly in radioresistant PCa cells. In this study, we emphasized the effects of antrocin on radioresistant PCa cells and addressed the molecular mechanism underlying the radiosensitization induced by antrocin. Our results showed that a combination treatment with antrocin and ionizing radiation (IR) synergistically inhibited cell proliferation and induced apoptosis in radioresistant PCa cells. We further demonstrated that antrocin downregulated PI3K/AKT and MAPK signaling pathways as well as suppressed type 1 insulin-like growth factor 1 receptor (IGF-1R)-mediated induction of β-catenin to regulate cell cycle and apoptosis. Using xenograft mouse models, we showed that antrocin effectively enhanced radiotherapy in PCa. Our study demonstrates that antrocin sensitizes PCa to radiation through constitutive suppression of IGF-1R downstream signaling, revealing that it can be developed as a potent therapeutic agent to overcome radioresistant PCa.
Figures 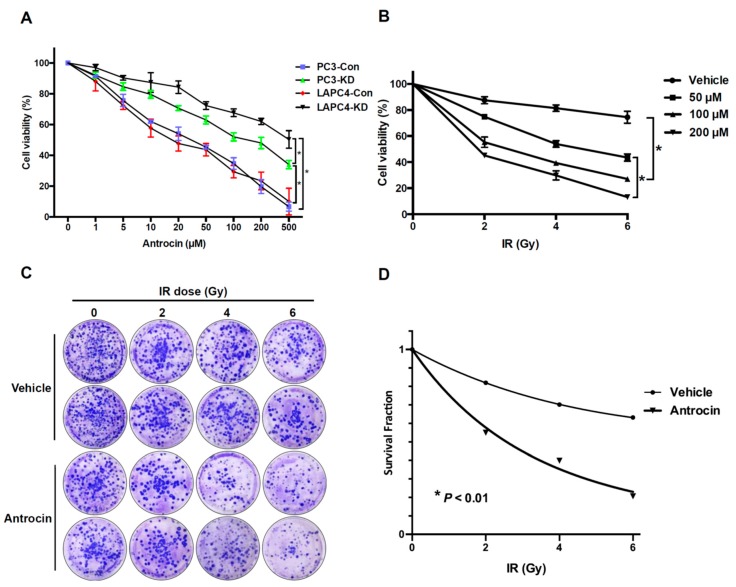
Figure 1
Antrocin inhibits PCa cells proliferation…
Figure 1
Antrocin inhibits PCa cells proliferation and sensitizes PCa cells to IR-induced cell death.…
Figure 1 Antrocin inhibits PCa cells proliferation and sensitizes PCa cells to IR-induced cell death. (A) PC3-Con, PC3-KD, LAPC4-Con, and LAPC4-KD cells were treated with various concentrations of antrocin (0, 1, 5, 10, 20, 50, 100, 200, and 500 μM) for 48 h. An approximately half-maximal inhibition of cell viability was obtained at 100 μM antrocin concentration. (B) PC3-KD cells were exposed to IR (0–6 Gy) and antrocin (50, 100, or 200 μM, respectively) followed by incubation for 48 h. Cell proliferation was assessed by using the MTT assay. (C) PC3-KD cells were treated with IR (0–6 Gy) alone or co-treatment IR and antrocin (100 μM). After 7-day incubation, survival cell colonies were stained with crystal violet and (D) assessed through clonogenic assays as described in the Methods Section. Statistical significance was evaluated by two-way ANOVA (* p < 0.01).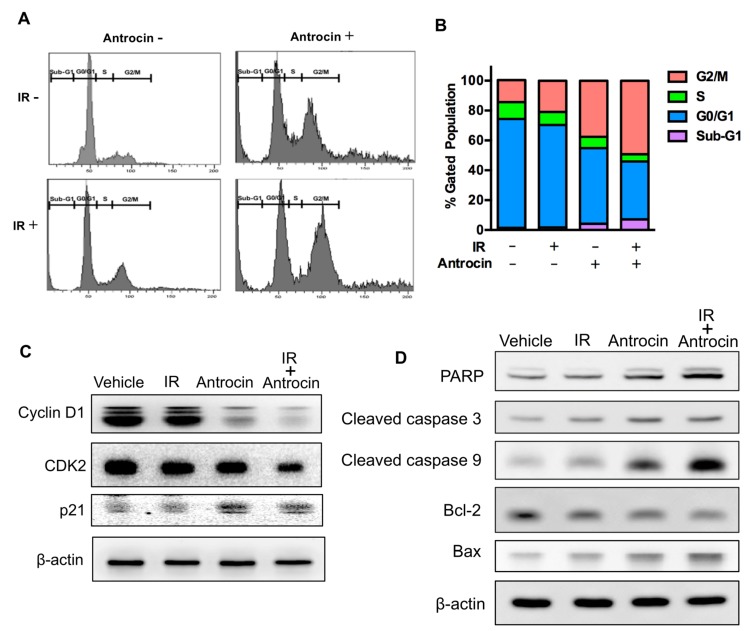
Figure 2
Antrocin and radiation synergistically arrest…
Figure 2
Antrocin and radiation synergistically arrest the cell cycle at G2/M and regulate apoptosis-related…
Figure 2 Antrocin and radiation synergistically arrest the cell cycle at G2/M and regulate apoptosis-related molecules in radioresistant PCa cells. (A) PC3-KD cells were treated with the vehicle control, IR (2 Gy) alone, antrocin (100 μM) alone, or IR combined with antrocin, and incubated for 48 h. Cell cycle distribution based on DNA content was analyzed through flow cytometry. (B) Different cell phases were plotted as the percentage of total events. (C,D) Cell lysates were harvested and subjected to Western blot analysis to determine the protein expression levels. The data represent one of three independent experiments. β-actin was used as a loading control.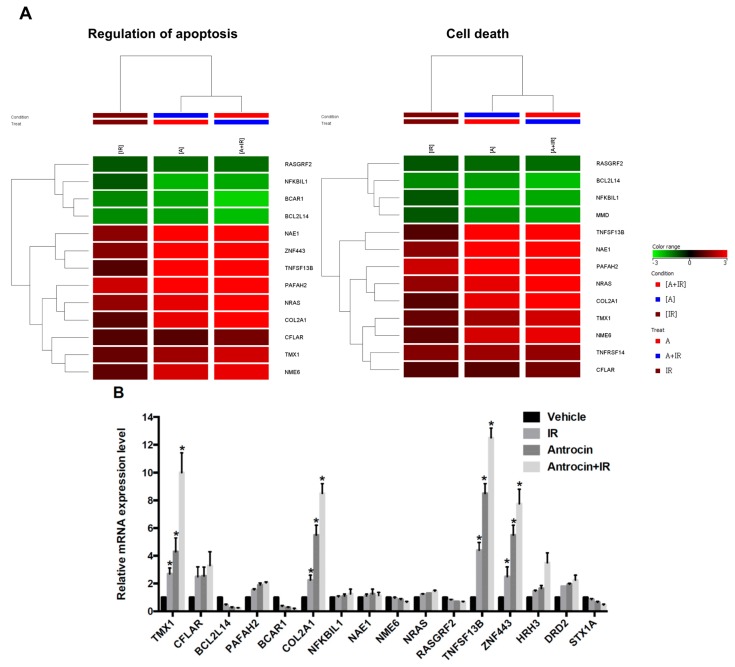
Figure 3
Gene expression profiles in PCa…
Figure 3
Gene expression profiles in PCa cells treated with IR and antrocin. After PC3-KD…
Figure 3 Gene expression profiles in PCa cells treated with IR and antrocin. After PC3-KD cells were treated with antrocin (100 μM) and/or IR (2 Gy), or co-treatment with IR and antrocin, a microarray analysis was performed. (A) Heatmap analysis showed the gene expression changes. Analysis of apoptosis-related genes are shown. (B) Apoptosis-related genes that were differentially expressed between treated and untreated groups were validated through qRT-PCR. Average fold-changes are presented. Statistical significance was evaluated by two-way ANOVA (* p < 0.01).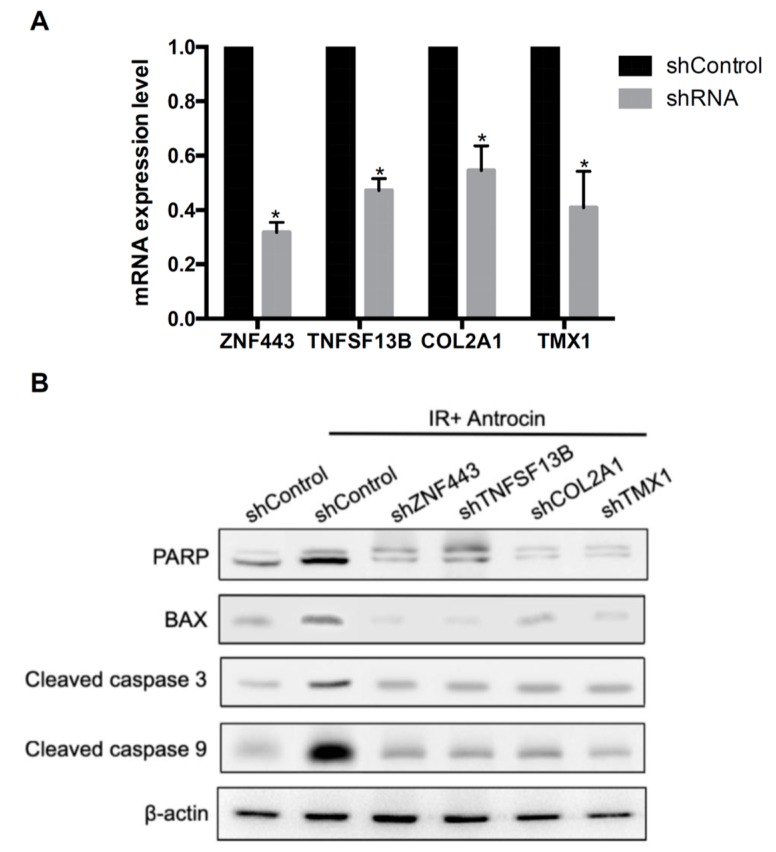
Figure 4
Knockdown of ZNF443 , TNFSF13B…
Figure 4
Knockdown of ZNF443 , TNFSF13B , COL2A1 , and TMX1 decreases antrocin and…
Figure 4 Knockdown of ZNF443, TNFSF13B, COL2A1, and TMX1 decreases antrocin and IR-induced apoptosis-related molecule expression. (A) mRNA levels in shRNA-Control (shControl) and shRNA knockdown cells were analyzed using qRT-PCR. GAPDH was used as an internal control. * p < 0.01 when compared to each group. (B) PC3-KD cells were transfected with shControl or with gene-targeting shRNA. The shControl or shRNA knockdown cells were vehicle-treated or co-treated with IR (2 Gy) and antrocin (100 μM) for 48 h. Cell lysates were harvested and subjected to Western blot analysis. The data represent one of three independent experiments. β-actin was used as a loading control.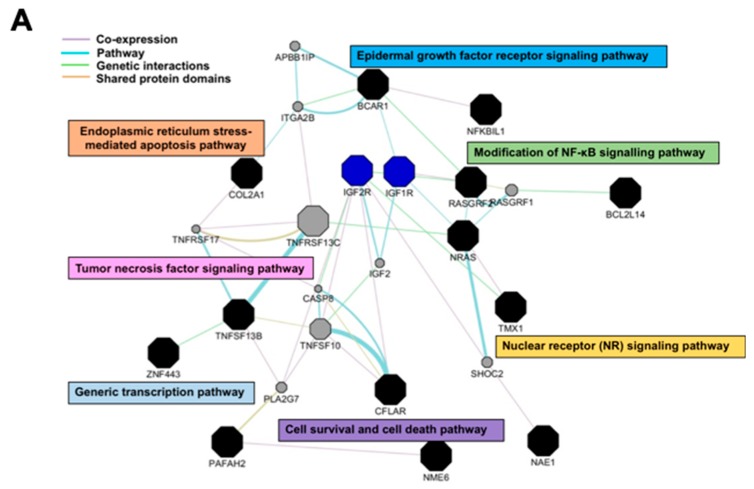
Figure 5
Antrocin inhibits the PI3K/AKT and…
Figure 5
Antrocin inhibits the PI3K/AKT and MAPK signaling pathways and phosphorylation of IGF-1R. PC3-KD…
Figure 5 Antrocin inhibits the PI3K/AKT and MAPK signaling pathways and phosphorylation of IGF-1R. PC3-KD cells were treated with IR (2 Gy), antrocin (100 μM), or IR plus antrocin, followed by incubation for 48 h. (A) The represented gene network was identified by ingenuity pathway analysis. The color of each line indicates the regulation of gene expression. (B) Cell lysates were harvested and subjected to Western blot analysis using antibodies against p85, p110, p-AKT, AKT, GSK3-β, p-GSK3-β, p-β-catenin, and β-catenin, and (C) antibodies against IGF-1R, p38, JNK, Erk1/2, and their respective phosphorylated forms. The data represent one of three independent experiments. β-actin was used as a loading control. The expression level of each protein was quantified by the signal intensity and normalized with each vehicle untreated group. The relative level of each protein expression was indicated at the bottom of each lane.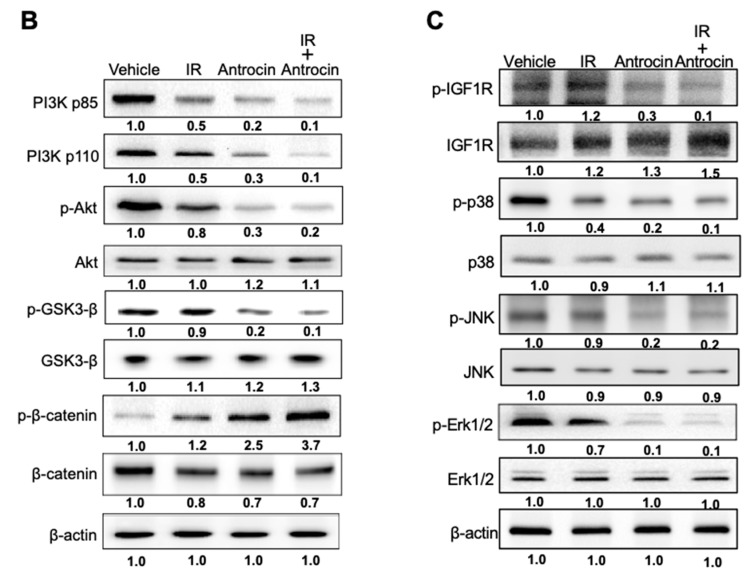
Figure 5
Antrocin inhibits the PI3K/AKT and…
Figure 5
Antrocin inhibits the PI3K/AKT and MAPK signaling pathways and phosphorylation of IGF-1R. PC3-KD…
Figure 5 Antrocin inhibits the PI3K/AKT and MAPK signaling pathways and phosphorylation of IGF-1R. PC3-KD cells were treated with IR (2 Gy), antrocin (100 μM), or IR plus antrocin, followed by incubation for 48 h. (A) The represented gene network was identified by ingenuity pathway analysis. The color of each line indicates the regulation of gene expression. (B) Cell lysates were harvested and subjected to Western blot analysis using antibodies against p85, p110, p-AKT, AKT, GSK3-β, p-GSK3-β, p-β-catenin, and β-catenin, and (C) antibodies against IGF-1R, p38, JNK, Erk1/2, and their respective phosphorylated forms. The data represent one of three independent experiments. β-actin was used as a loading control. The expression level of each protein was quantified by the signal intensity and normalized with each vehicle untreated group. The relative level of each protein expression was indicated at the bottom of each lane.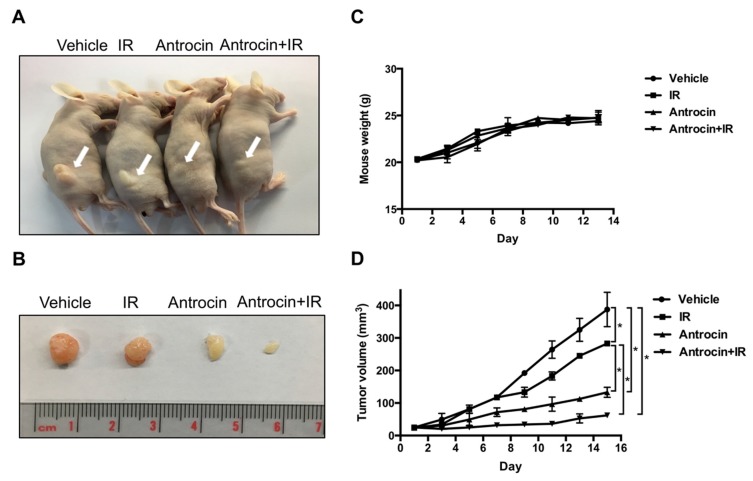
Figure 6
Antrocin synergistically enhances radiation-suppressed PCa…
Figure 6
Antrocin synergistically enhances radiation-suppressed PCa growth in vivo. ( A ) Mice with…
Figure 6 Antrocin synergistically enhances radiation-suppressed PCa growth in vivo. (A) Mice with xenograft tumors were divided into four groups: vehicle-treated, treated with IR (2 Gy), treated with antrocin (100 mg/kg), or treated with a combination of IR and antrocin, respectively. Arrows indicate tumors that were grown in the posterior flanks of mice. (B) Treatments were administered on days 1, 3, 5, 7, 9, 11, and 13. After euthanasia, tumors were excised from the mice. Scales shown in images are in centimeters. (C) Mouse weights were recorded. (D) Tumor volume was measured, and data are presented as means ± SEM. Vehicle vs. IR: p = 0.0264; Vehicle vs. Antrocin: p = 0.0177; Vehicle vs. Antrocin+IR: p = 0.0116; IR vs. Antrocin: p = 0.0211; IR vs. Antrocin+IR: p = 0.0192. Statistical significance was evaluated by two-way ANOVA (* p < 0.01).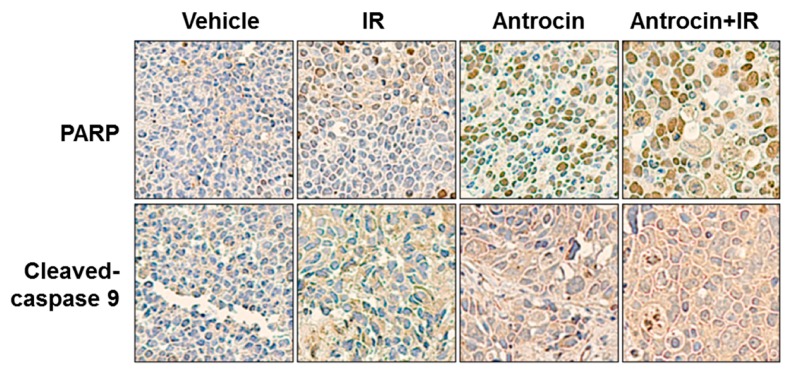
Figure 7
Representative immunohistochemical (IHC) staining patterns…
Figure 7
Representative immunohistochemical (IHC) staining patterns in xenograft PCa tissue. IHC analysis of paraffin…
Figure 7 Representative immunohistochemical (IHC) staining patterns in xenograft PCa tissue. IHC analysis of paraffin sections show staining with specific antibodies against PARP, cleaved-caspase 9, phospho-AKT, phospho-β-catenin, and cyclin D1, respectively. Images were photographed at 200× magnification.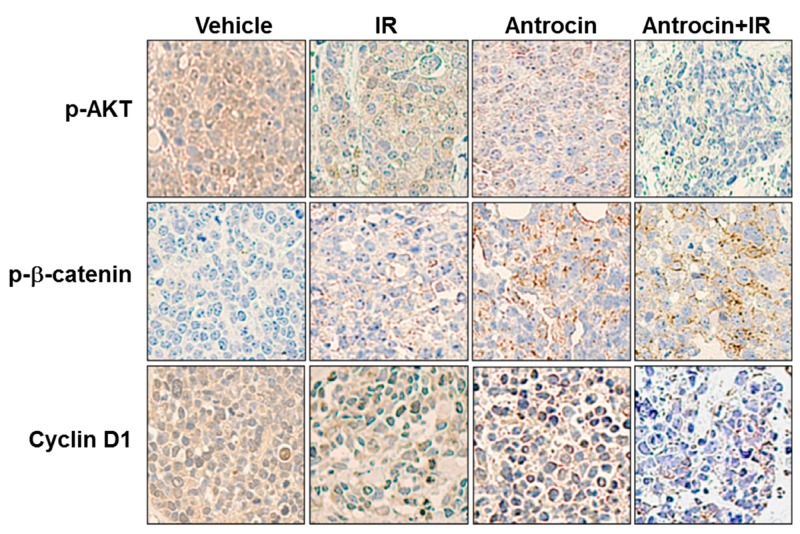
Figure 7
Representative immunohistochemical (IHC) staining patterns…
Figure 7
Representative immunohistochemical (IHC) staining patterns in xenograft PCa tissue. IHC analysis of paraffin…
Figure 7 Representative immunohistochemical (IHC) staining patterns in xenograft PCa tissue. IHC analysis of paraffin sections show staining with specific antibodies against PARP, cleaved-caspase 9, phospho-AKT, phospho-β-catenin, and cyclin D1, respectively. Images were photographed at 200× magnification.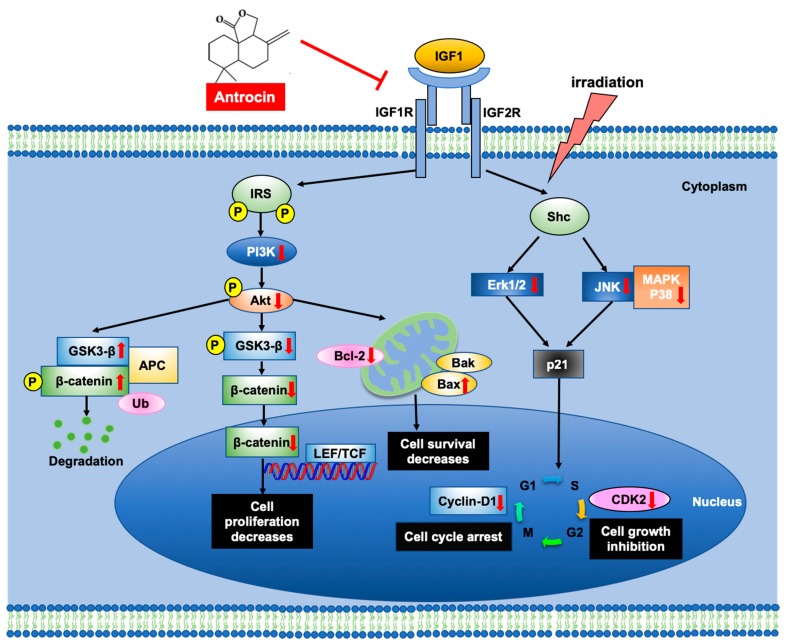
Figure 8
Proposed mechanism of action for…
Figure 8
Proposed mechanism of action for antrocin-induced sensitization to radiotherapy in radioresistant PCa cells.…
Figure 8 Proposed mechanism of action for antrocin-induced sensitization to radiotherapy in radioresistant PCa cells. IGF-1 binds to IGF-1R and induces IRS/Shc phosphorylation, which leads to the activation of PI3K/AKT and MAPK signaling. Co-treatment of cells with antrocin and radiation inhibits IGF1-induced activation of the PI3K/AKT and MAPK pathways, effectively sensitizing PCa cells to radiotherapy. IRS: insulin receptor substrate; Shc: src homology/collagen; LEF: lymphoid enhancer factor; TCF: transcription factor; Ub: ubiquitin. All figures (10)