Antcin-B, a phytosterol-like compound from Taiwanofungus camphoratus inhibits SARS-CoV-2 3-chymotrypsin-like protease (3CLPro) activity in silico and in vitro
Figures
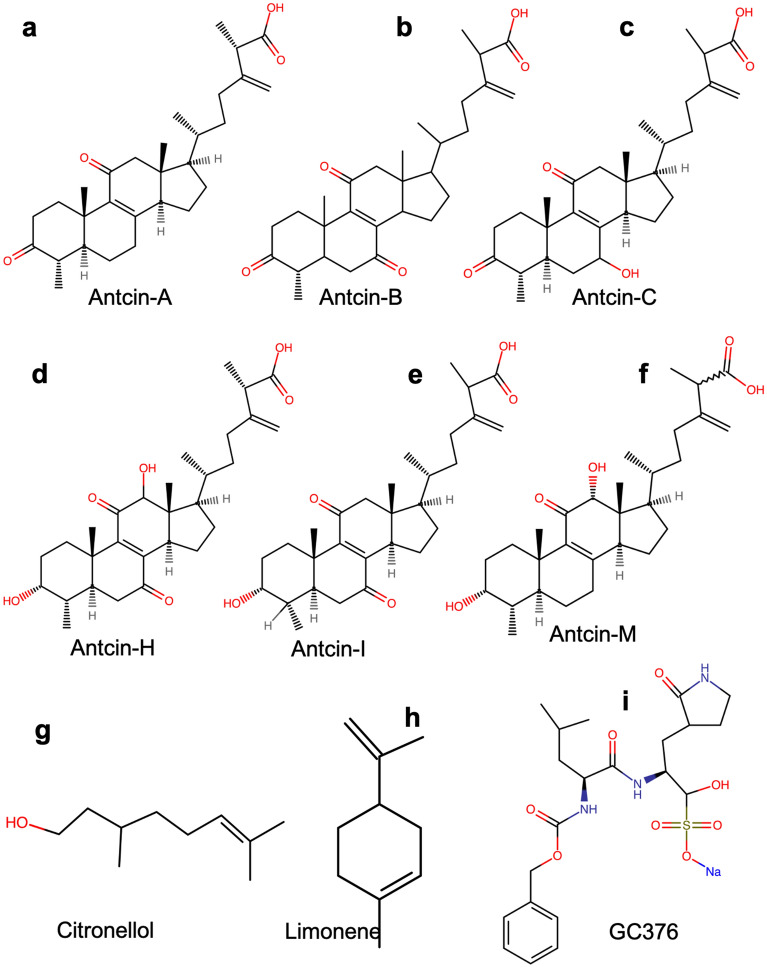
Figure 1
Chemical structures of natural compounds…
Figure 1
Chemical structures of natural compounds to test inhibition of SARS-CoV-2-3CL Pro . The…
Figure 1 Chemical structures of natural compounds to test inhibition of SARS-CoV-2-3CLPro. The chemical structure of (a) antcin-A, (b) antcin-B, (c) antcin-C, (d) antcin-H, (e) antcin-I, (f) antcin-M, (g) citronellol, (h) limonene, and (i) GC367. Relatively, all antcins structurally resemble the backbone except for a few functional groups. Non-antcins have different chemical structures compared to antcins. However, as shown in the figure, GC376 has benzene as the backbone and other functional groups.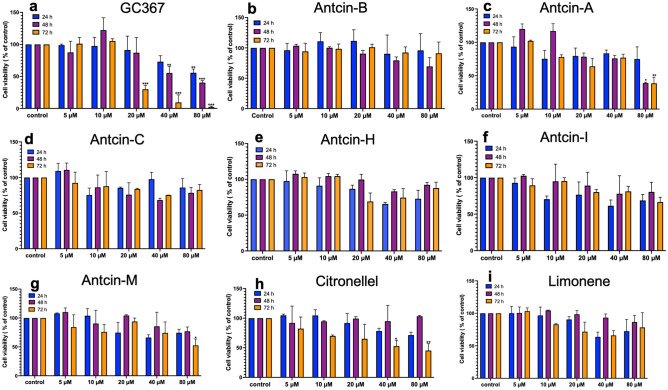
Figure 2
Cell viability effect of natural…
Figure 2
Cell viability effect of natural compounds on A549 cells. Cytotoxicity effects of (…
Figure 2 Cell viability effect of natural compounds on A549 cells. Cytotoxicity effects of (a) GC376, (b) antcin-A, (c) antcin-B, (d) antcin-C, (e) antcin-H, (f) antcin-I, (g) antcin-M, (h) citronellol, and (i) limonene. Antcin (A, B, C, H, I, and M), non-antcins (citronellol and limonene), and the positive control compound (GC376) on A549 cells. The cells were incubated with increasing concentrations of antcins, non-antcins, and GC376 (5–80 μM) for 24, 48, and 72 h. Cell toxicity was determined by the MTT colorimetric assay as described in the materials and methods. Values represent the mean ± S.D. of three independent experiments. Statistical significance was set at *p < .05, **p < .01, ***p < .001 compared to the treatment and control groups. Without asterisks, indicate statistically non-significant results.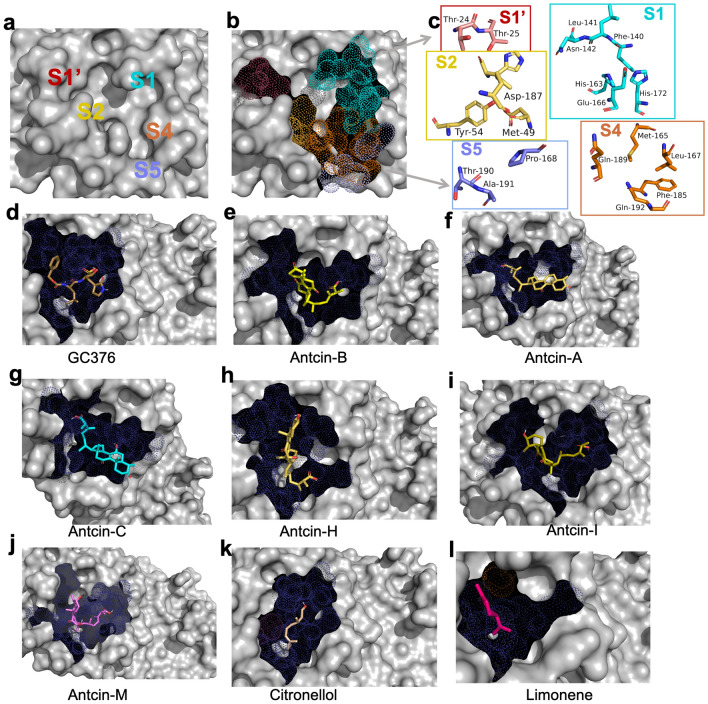
Figure 3
Structural analysis and potential inhibitors…
Figure 3
Structural analysis and potential inhibitors with SARS-CoV-2-3CL Pro enzyme using molecular docking. (…
Figure 3 Structural analysis and potential inhibitors with SARS-CoV-2-3CLPro enzyme using molecular docking. (a) Cocrystal structures of SARS-CoV-2-3CLPro labeling substrate binding subsites (S1, S2, S4, S5, S1′). (b) Binding subsites of 3CLPro are presented in dot models, with S1, S1′, S2, S4, and S5 shown in different colors (maroon, cyan, yellow, orange, and purple), and (c) these five substrate binding subsites comprise the main catalytic site with amino acid residues and their structures presented. Since these are catalytic binding sites, (d–l) antcins, non-antcins, and the positive control GC376 were docked with the active site of 3CLPro protein using CB-Dock2 and Auto-Dock Vina module; UCSF-Chimera. The compounds bind to highly similar pockets of binding sites. The binding sites are presented with a dot model in deep blue. Ligands (compounds) binding with SARS-CoV-2-3CLPro are presented in stick models with different colors, as shown in (d–l).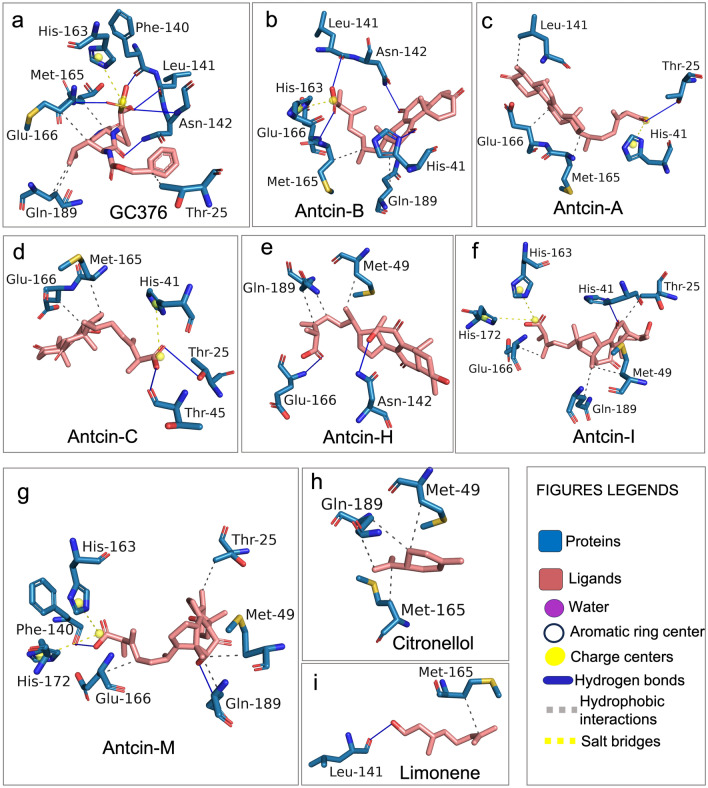
Figure 4
Detailed visualization of the interaction…
Figure 4
Detailed visualization of the interaction between the native ligand and residues of SARS-CoV-2-3CL…
Figure 4 Detailed visualization of the interaction between the native ligand and residues of SARS-CoV-2-3CLPro using PLIP from the docking results. Antcins, non-antcins, and the positive control GC376 were docked with the active site of the 3CLPro protein using CB-Dock2 and Auto-Dock Vina module; UCSF-Chimera, exhibiting similar binding pockets but different binding affinity energy as shown in Table 2. The detailed chemical interaction of the above compounds with 3CLPro is performed by the protein–ligand interaction profiler (PLIP), allowing detection and visualization of relevant interactions from docking results. Ligands interacting with the amino acids of 3CLPro are presented in stick models with the same color as a flamingo for ligands. The ligands interact with residues of 3CLPro via hydrogen bonds, hydrophobic interactions, and salt bridges, as shown by PLIP. (a) GC376, (b) antcin-A, (c) antcin-B, (d) antcin-C, (e) antcin-H, (f) antcin-I, (g) antcin-M, (h) citronellol, and (i) limonene interact with various 3CLPro residues represented in stick models. Interactions in the blue line indicate hydrogen bonds between drugs and amino acids, the grey dotted line represents hydrophobic interactions, and the yellow dotted line indicates the salt bridge in PLIP results.es legends. Residue contacts represent the blue color, and the red dot represents Oxygen.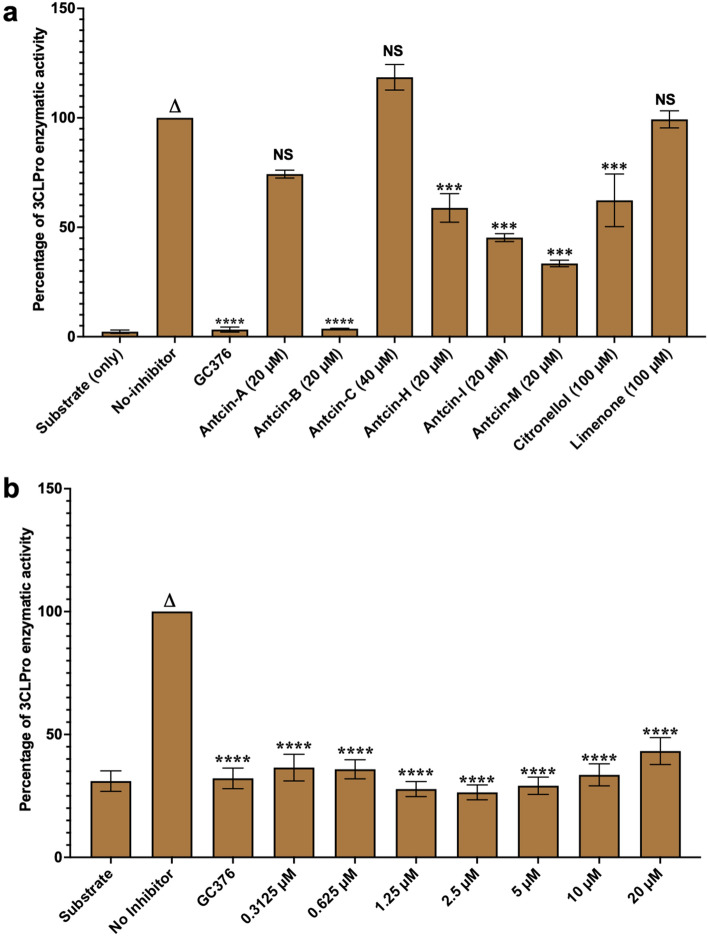
Figure 5
Antcin-B completely inhibits SARS-CoV-2 3CLPro…
Figure 5
Antcin-B completely inhibits SARS-CoV-2 3CLPro like GC376 in enzymatic assay. Antcins (A, B,…
Figure 5 Antcin-B completely inhibits SARS-CoV-2 3CLPro like GC376 in enzymatic assay. Antcins (A, B, C, H, I, and M), non-antcins (citronellol and Limonene), and the positive control GC376 protease inhibitors were screened for their inhibitory activity against SARS-CoV-2 3CLPro enzyme, as described in the Methods section. The percentage (%) of inhibition of 3CLPro activity was calculated as the ratio of activity in the presence of the inhibitor to the total activity, considering the background. Blank values were subtracted from all the readings before calculating the percent activity. A representation of three individual experiments with triplicate values is presented graphically (n = 3). One-way ANOVA with Dunnett’s multiple comparison posthoc tests was used to calculate the statistical significance. Statistical significance was set at **p < .05, ***p < .001, ****p < .0001 compared to the treatment group versus the control group (no inhibitors). Without asterisks, indicate statistically non-significant (ns) results.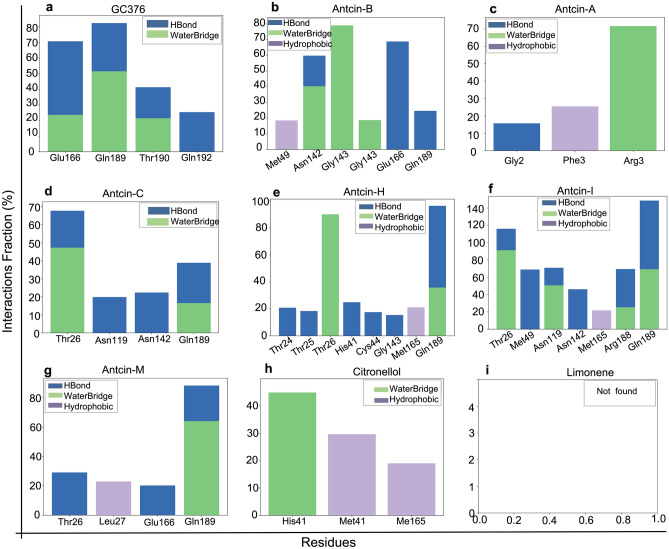
Figure 6
Protein–ligand interactions histograms from Molecular…
Figure 6
Protein–ligand interactions histograms from Molecular dynamics (MD) simulations (100 ns) of antcins (A,…
Figure 6 Protein–ligand interactions histograms from Molecular dynamics (MD) simulations (100 ns) of antcins (A, B, C, H, I, and M), non-antcins (citronellol and Limonene), and the positive control compound (GC376) with SARS-CoV-2-3CLPro (PDB ID; 7LME). Protein interactions with the ligand were monitored throughout the simulation, and the interaction types were classified as Hydrogen Bonds, Hydrophobic, and Water Bridge, represented by blue, green, and lavender colors, respectively. The Y-axis represents the interaction fraction (the % of the time the ligand formed an interaction with a certain protein residue). On the x-axis, the specific protein residues are plotted. Residues interacting for less than 15% of the simulation time were omitted for clarity. The protein–ligand mapping shows the normalized stacked bar chart depicting the intermolecular interaction simulation time fraction between 3CLPro with (a) GC376, (b) antcin-A, (c) antcin-B, (d) antcin-C, (e) antcin-H, (f) antcin-I, (g) antcin-M, (h) citronellol, and (i) limonene during the 100 ns MD simulation interval. Values of interaction fractions > 1.0 are possible, as some residues create multiple interactions of a similar subtype. Alternate figures displaying similar information are included in the supplementary data (Fig. S4a–i).