Amelioration of carbon tetrachloride-induced hepatic injury by emulsified Antrodia extract
Abstract
Figures 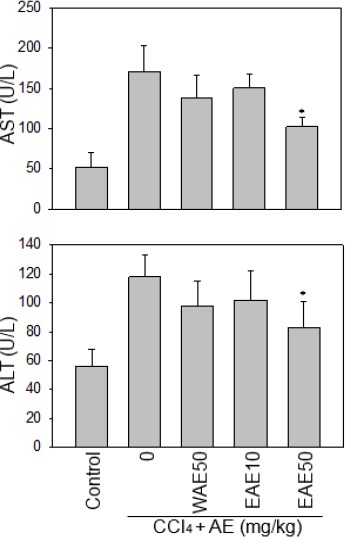
Figure 1
Serum AST and ALT concentrations…
Figure 1
Serum AST and ALT concentrations in response to CCl 4 stress and the…
Figure 1 Serum AST and ALT concentrations in response to CCl4 stress and the Antrodia cinnamomea (AC) extract treatment. The result showed that EAE at 50 mg/kg significantly reduced serum ALT and AST levels from CCl4-induced rats. Data are presented as the mean±SE. *:P <0.05 as compared to the CCl4 group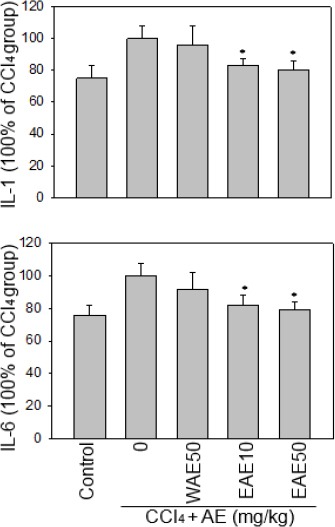
Figure 2
Effects of the Antrodia cinnamomea…
Figure 2
Effects of the Antrodia cinnamomea (AC) extract on serum IL-1 and IL-6 levels…
Figure 2 Effects of the Antrodia cinnamomea (AC) extract on serum IL-1 and IL-6 levels under CCl4 stress. The EAE dose-dependently reduced serum IL-1 and IL-6 levels from CCl4-induced rats. Data are presented as the mean±SE. *:P<0.05 as compared to the CCl4 group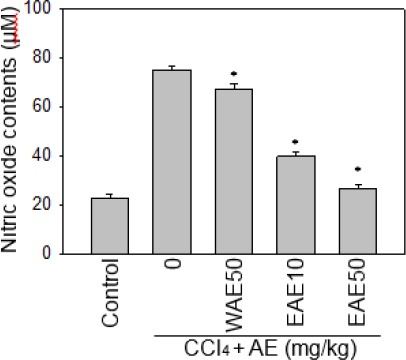
Figure 3
Effect of the Antrodia cinnamomea…
Figure 3
Effect of the Antrodia cinnamomea (AC) extract on serum nitric oxide level in…
Figure 3 Effect of the Antrodia cinnamomea (AC) extract on serum nitric oxide level in rats with and without CCl4 stress. Levels of NO increased with CCl4-induced liver injury but were reduced with WAE or EAE. Data are expressed as the mean±SE.*:P<0.05 as compared to the CCl4 group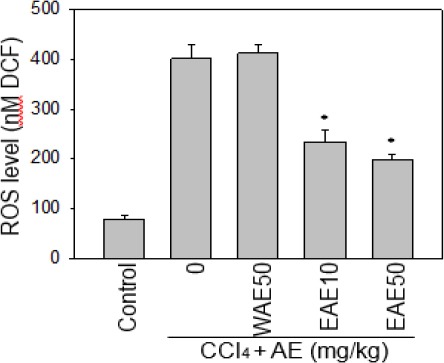
Figure 4
Effect of the Antrodia cinnamomea…
Figure 4
Effect of the Antrodia cinnamomea (AC) extract on serum ROS level under CCl…
Figure 4 Effect of the Antrodia cinnamomea (AC) extract on serum ROS level under CCl4 stress. EAE was able to scavenge serum ROS generation of CCl4-induced rats. But, there is no scavenging activity with WEA. Data are expressed as the mean±SE. *:P<0.05 as compared to the CCl4 group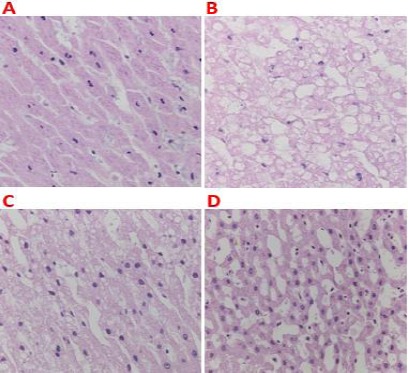
Figure 5
Protective effect of the Antrodia…
Figure 5
Protective effect of the Antrodia cinnamomea (AC) extract on CCl 4 -induced hepatic…
Figure 5 Protective effect of the Antrodia cinnamomea (AC) extract on CCl4-induced hepatic injury. Histopathology of liver slices from rats from (A) no treatment control group; (B) the CCl4 group, (C) the EAE group, and (D) the WAE group. The photographs show the liver section with 200× magnification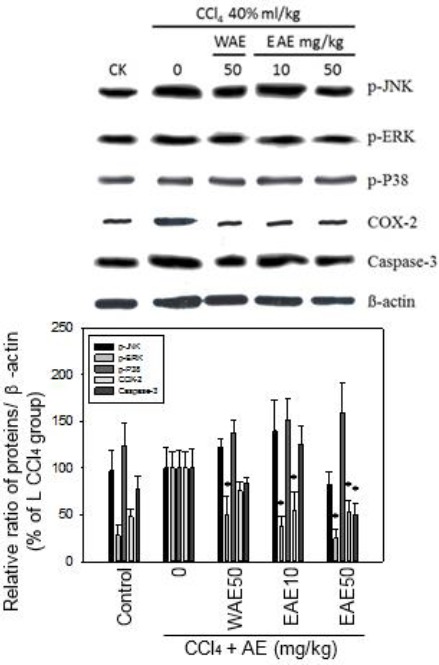
Figure 6
AC extract inhibited CCl 4…
Figure 6
AC extract inhibited CCl 4 -induced phospho-ERK MAP kinase, COX-2 and caspase-3 under…
Figure 6 AC extract inhibited CCl4-induced phospho-ERK MAP kinase, COX-2 and caspase-3 under CCl4 stress. EAE and WEA both extracts reduced the p-ERK activation, and EAE inhibit COX-2, and caspase-3 levels better than WEA in the liver samples. Data are expressed as mean ± SEM of three independent experiments. *:P<0.05 as compared to CCl4 control