Addition of Vegetable Oil to Improve Triterpenoids Production in Liquid Fermentation of Medicinal Fungus Antrodia cinnamomea
Abstract
The liquid fermentation of Antrodia cinnamomea is a promising alternative source for fungus production compared to the wildly grown fruiting body. Elicitation is a strong tool to enhance the productivity in microbial cells to obtain more compounds of interest. In this study, in order to improve the fungus growth and its terpenoids production, various vegetable oils were added in the fermentation broth of A. cinnamomea. It was found that corn oil from a group of vegetable oils exhibited the best effect on the biomass and triterpenoid content. After optimization, the initial addition of 1% (v/v) corn oil plus the inoculation of 10% (v/v) mycelia led to a maximum triterpenoid yield (532.3 mg L-1), which was increased as much as fourfold compared to the blank control. Differential transcriptome analysis demonstrated that corn oil significantly enriched several metabolic pathways including glycolysis/gluconeogenesis, propanoate metabolism and transmembrane hydrophobins. The enriched pathways interacted with deferentially expressed genes (DEGs) induced by corn oil treatment. Our research provides a potential strategy for the large production of triterpenoids by the improved fermentation of A. cinnamomea.
Figures 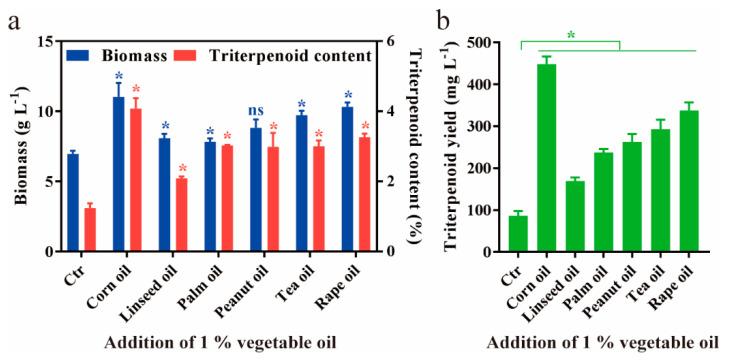
Figure 1
Effects of various vegetables oil…
Figure 1
Effects of various vegetables oil on the fermentation of A. cinnamomea . Biomass…
Figure 1 Effects of various vegetables oil on the fermentation of A. cinnamomea. Biomass and triterpenoid content (a), and triterpenoid yield (b), are quantitatively analyzed, respectively. The addition volume of various vegetable oils is 1% (v/v). The control has no vegetable oils. All fermentations are conducted at 28 °C for 12 days. All data are from triplicates (means ± SD). Asterisks denote (* p < 0.05) statistically significant differences between the treatment groups and the control; ns indicates no significant difference.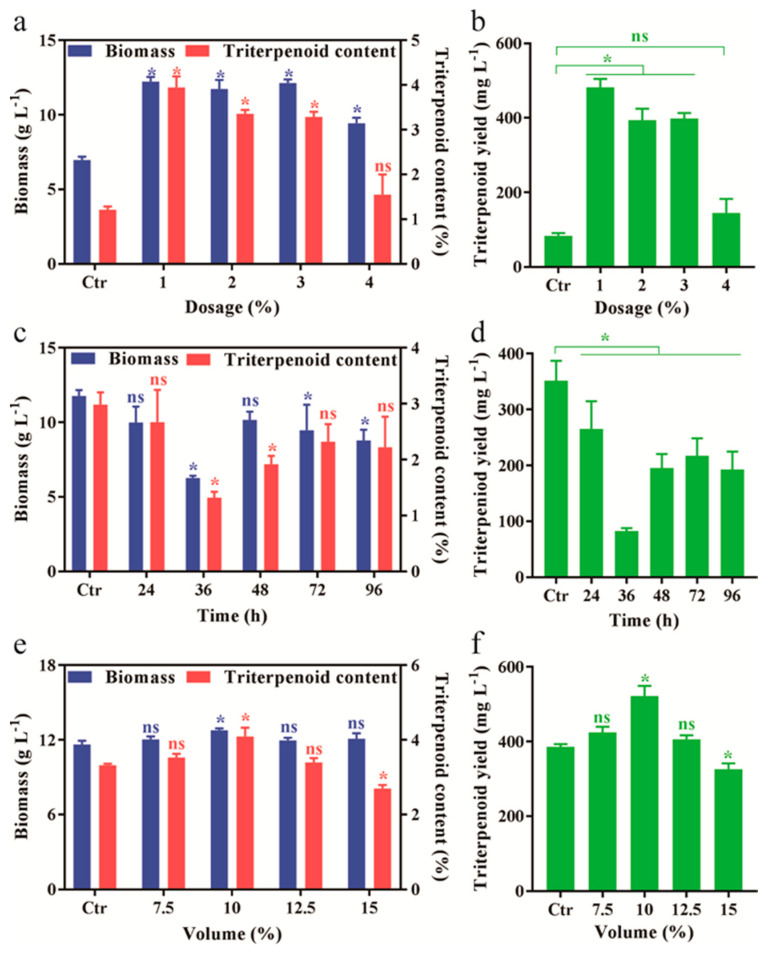
Figure 2
Optimization of the liquid fermentation…
Figure 2
Optimization of the liquid fermentation of A. cinnamomea with corn oil. The effect…
Figure 2 Optimization of the liquid fermentation of A. cinnamomea with corn oil. The effect of oil dosages (a,b), addition time (c,d), and inoculation volume of mycelia (e,f) on biomass and triterpenoid content, and triterpenoids yield, was quantitatively analyzed, respectively. The fermentation without oil, 0 h addition of 1% (v/v) corn oil and 5% (v/v) inoculation volume is considered as the control in a and b, c and d, and e and f, respectively. All fermentation was conducted at 28 °C for 12 days. All data were from triplicates (means ± SD). Asterisks denote (* p < 0.05) statistically significant differences between treatment groups and the control, ns indicates no significant difference.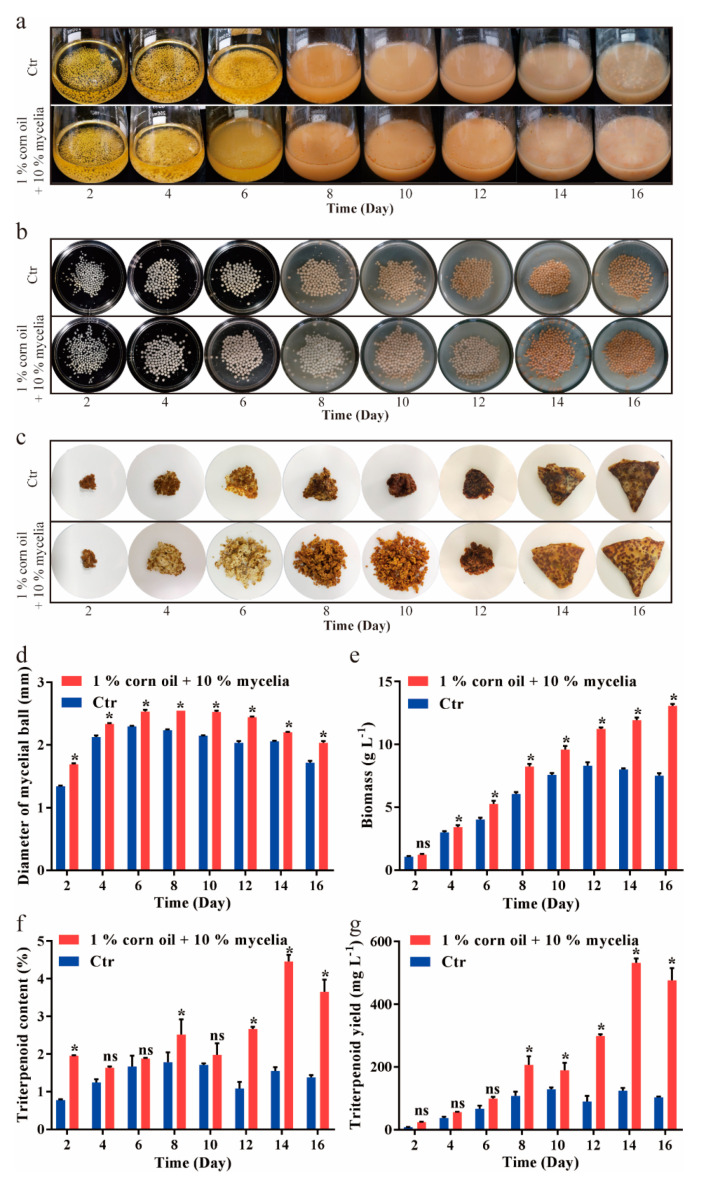
Figure 3
Change of fermentation broth in…
Figure 3
Change of fermentation broth in the optimal fermentations. Fermentation broth ( a ),…
Figure 3 Change of fermentation broth in the optimal fermentations. Fermentation broth (a), mycelial ball (b) and dried mycelial pellet (c), was presented, respectively. During the optimal fermentations for 16 days, diameter of mycelial ball (d), biomass (e), triterpenoid content (f) and triterpenoids yield (g), was quantitatively determined, respectively. The control was the fermentation without oil. All data are from triplicates (means ± SD). Asterisks denote (* p < 0.05) statistically significant differences between the treatment groups and the control, respectively; ns indicates no significant difference.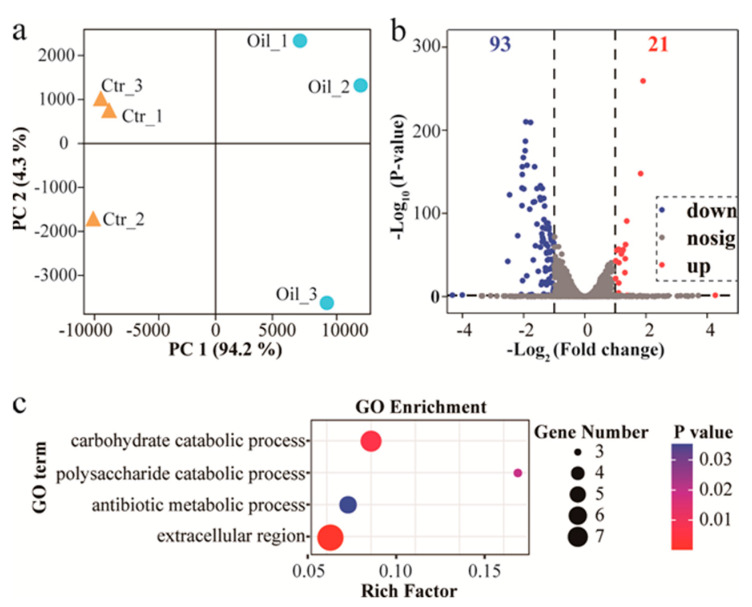
Figure 4
A plot of PCA analysis…
Figure 4
A plot of PCA analysis between samples ( a ), a volcano of…
Figure 4 A plot of PCA analysis between samples (a), a volcano of DGEs (b), and a plot of enriched GO terms (c) was described, respectively.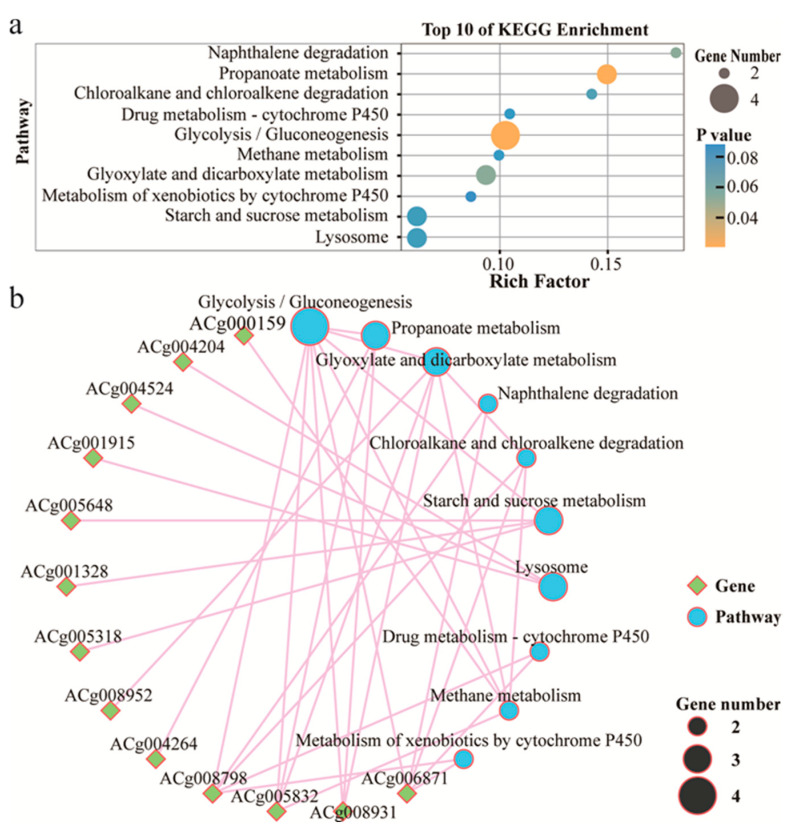
Figure 5
( a ) Top 10…
Figure 5
( a ) Top 10 pathways of KEGG enrichment were detailed. ( b…
Figure 5 (a) Top 10 pathways of KEGG enrichment were detailed. (b) A network map of enriched pathways and their DGEs was descripted.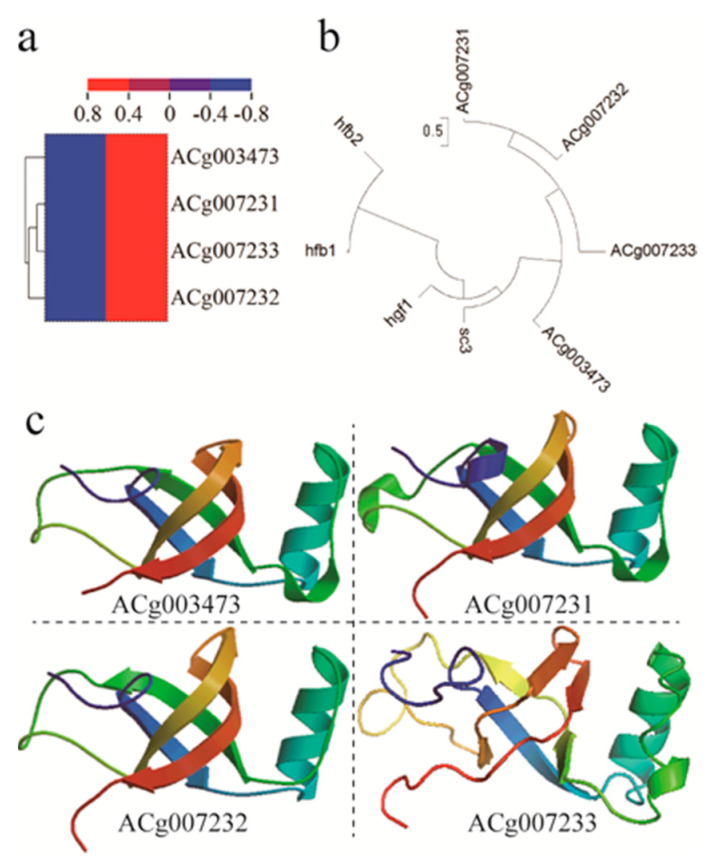
Figure 6
( a ) A heatmap…
Figure 6
( a ) A heatmap about differential expressions of four hydrophobin genes. (…
Figure 6 (a) A heatmap about differential expressions of four hydrophobin genes. (b) Their genetic relation with type I and type II was described by cluster analysis of amino acid sequences. (c) Their protein structure was also described using the SWISS-MODEL.