Activation of Nrf2-mediated anti-oxidant genes by antrodin C prevents hyperglycemia-induced senescence and apoptosis in human endothelial cells
Abstract
In the present study, we investigated the effects of antrodin C (ADC), a maleimide derivative isolated from mycelia of Antrodia cinnamomea, on high glucose (HG, 30 mM)-accelerated endothelial dysfunction in vitro. HG-induced cytotoxicity in human umbilical vein endothelial cells (HUVECs) was significantly ameliorated by ADC. In addition, treatment with ADC significantly prevented HG-induced senescence, growth arrest at the G1-S transition phase and apoptosis in HUVECs. Moreover, the increased level of intracellular reactive oxygen species (ROS) under HG condition was significantly ameliorated by ADC. Further analysis revealed that ADC-mediated anti-oxidant effects were due to up-regulation of cellular anti-oxidant genes, such as HO-1 and NQO-1 via promotion of the transcriptional activity of Nrf2, which was further confirmed by the failure of ADC to protect HUVECs from HG-induced dysfunction under HO-1 inhibition or Nrf2 silencing. Furthermore, hyperosmotic glucose (HOG, 60 mM)-induced uncontrolled production of ROS, rapid apoptotic cell death and HUVEC injury were significantly prevented by ADC, whereas these preventive effects were barely observed in HO-1 inhibited or Nrf2 silenced cells. Taken together, these results suggest that ADC may represent a promising intervention in diabetic-associated cardiovascular diseases by activating the Nrf2-dependent cellular anti-oxidant defense system.
Figures 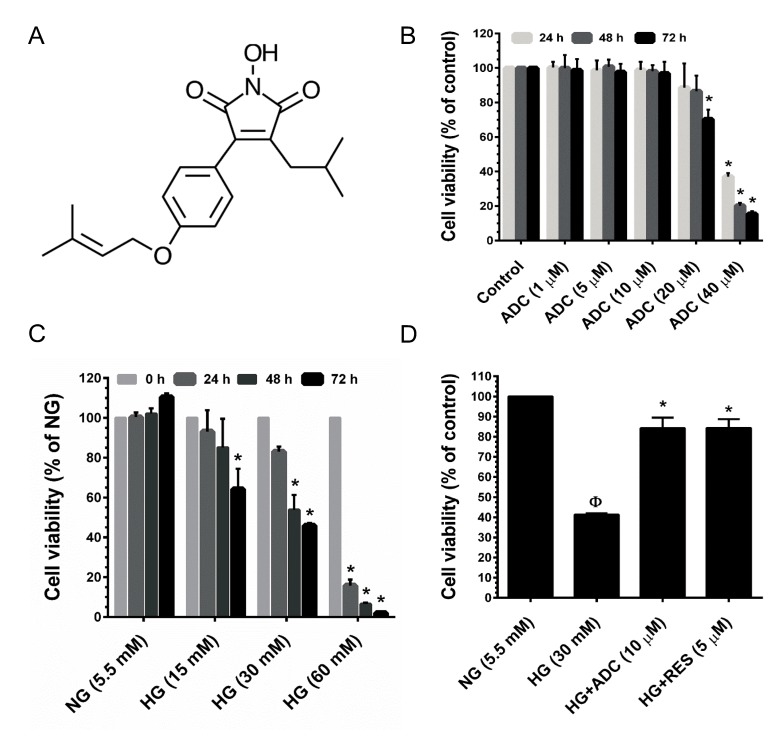
Figure 1. Cytotoxic effect of HG and…
Figure 1. Cytotoxic effect of HG and ADC on HUVECs
A. Chemical structure of Antrodin… Figure 1. Cytotoxic effect of HG and ADC on HUVECs A. Chemical structure of Antrodin C (ADC). B. HUVECs were incubated with increasing concentrations of ADC for 24-72 h and the cell viability was measured by MTT assay. The percentage of cell viability was compared with the control (0.01% DMSO) group. C. HUVECs were incubated with various doses of HG for 24-72 h and cell viability was measured by MTT assay. The percentage of cell viability was compared with the NG treatment group. D. Cells were incubated with HG in the presence or absence of ADC or RES for 72 h. The percentage of cell viability was compared with the NG treatment group. Values represent the mean ± SD of three independent experiments. Statistical significance was set at ФP < 0.05 compared to NG vs. HG and *P < 0.05 compared to HG vs. samples.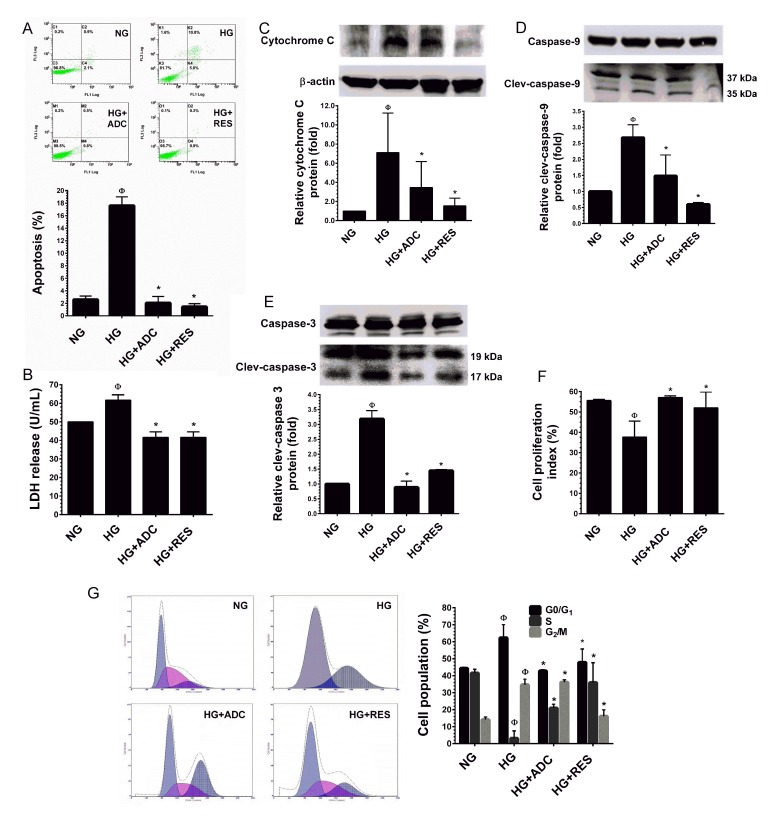
Figure 2. Protective effect of ADC on…
Figure 2. Protective effect of ADC on HG-induced HUVEC apoptosis and growth arrest
A. HUVECs… Figure 2. Protective effect of ADC on HG-induced HUVEC apoptosis and growth arrest A. HUVECs were incubated with HG in the presence or absence of ADC or RES for 72 h. Apoptotic cell death was performed with Annexin V/PI staining and the hypodiploid DNA was determined by flow cytometry. B. HUVECs were treated with HG in the presence or absence of ADC or RES for 72 h. LDH release in the supernatant of HUVEC cultures was measured by LDH assay kit as described in Materials and Methods. C.-E. Protein expression levels of cytochrome C, caspase-9 and caspase-3 levels were determined by western blot analysis. The relative protein expression of cytochrome C was normalized with β-actin, whereas cleaved capase-9 and cleaved caspase-3 levels were normalized with pro-caspase-9 and pro-caspase-3, respectively. F. HUVECs proliferation index was determined by flow cytometry. G. HUVECs were incubated with HG in the presence of ADC or RES for 72 h. Cell-cycle distribution was measured by flow cytometer using PI. Percentage of cell population in each transition phase is shown in the histogram. Values represent the mean ± SD of three independent experiments. Statistical significance was set at ФP < 0.05 compared to NG vs. HG and *P < 0.05 compared to HG vs. samples.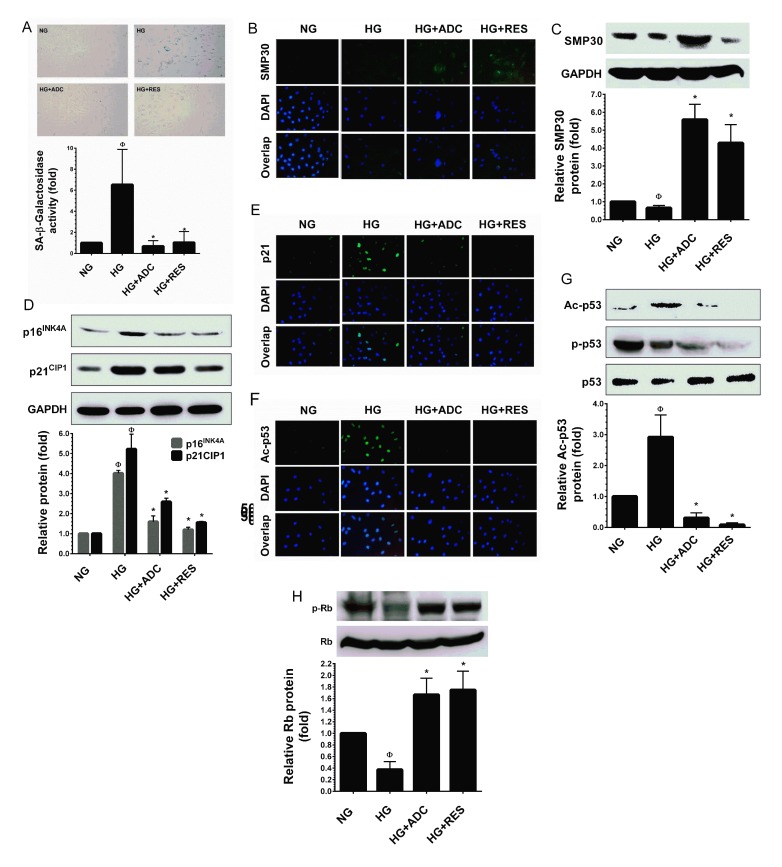
Figure 3. ADC prevents HG-induced senescence in…
Figure 3. ADC prevents HG-induced senescence in HUVECs
To determine the effect of ADC on…
Figure 3. ADC prevents HG-induced senescence in HUVECs To determine the effect of ADC on HG-induced senescence, HUVECs were incubated with HG in the presence or absence of ADC or RES for 72 h. A. Cellular senescence was determined by SA-β-gal assay. The top panel shows representative figures and the lower panel shows quantitative analysis of SA-β-gal positive cells per microscopic field. B.,E.,F. The protein expression of SMP30, p21CIP1 and acetylated p53 was measured by immunofluroscence using specific primary antibodies and FITC-conjugated secondary antibody (green). The cellular localization of SMP30, p21CIP1 and acetylated p53 was photographed using a fluorescence microscope. DAPI was used to stain the nucleus. C. SMP30 protein expression level was determined by western blot analysis and the relative SMP30 expression was normalized with GAPDH. D. Senescence-associated protein p21CIP1 and p16INK4A levels were determined by western blotting and the relative protein levels were normalized with GAPDH. G.,H. The protein levels of acetylated p53, phosphorylated p53 and phosphorylated Rb levels were measured by western blot analysis. The relative protein levels of ac-p53 and p-Rb were normalized with total p53 and total Rb levels, respectively. Values represent the mean ± SD of three independent experiments. Statistical significance was set at ФP < 0.05 compared to NG vs. HG and *P < 0.05 compared to HG vs. samples.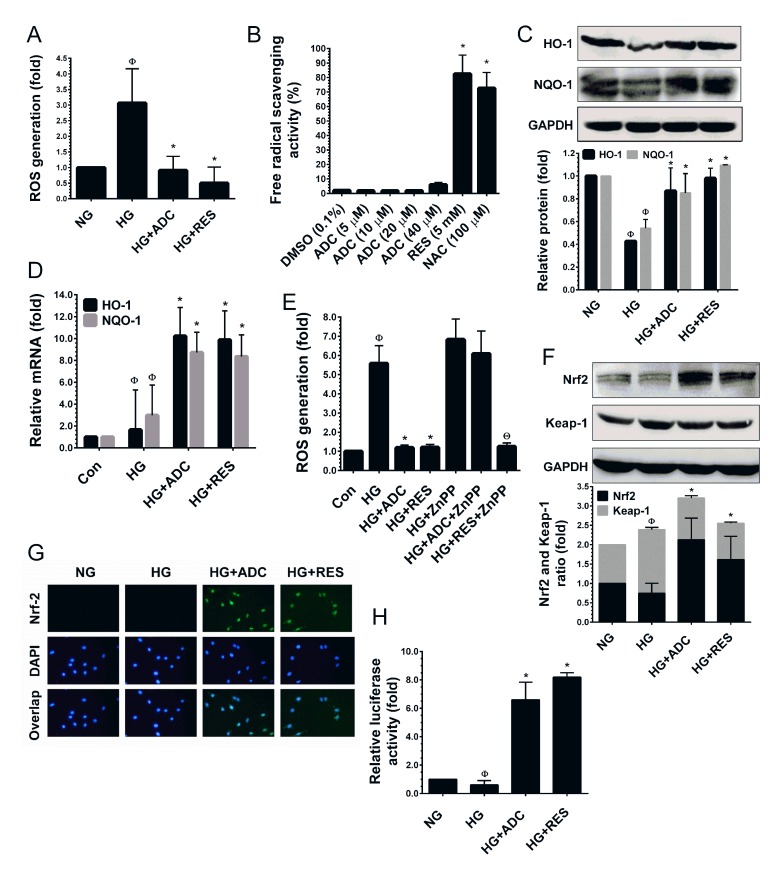
Figure 4. ADC activates Nrf2-dependent anti-oxidant defense…
Figure 4. ADC activates Nrf2-dependent anti-oxidant defense in HUVECs
A. To determine the ROS inhibitory… Figure 4. ADC activates Nrf2-dependent anti-oxidant defense in HUVECs A. To determine the ROS inhibitory effect of ADC, HUVECs were incubated with HG in the presence or absence of ADC or RES for 24 h. After incubation, intracellular ROS was measured by spectrometer using DCFH2-DA flurogenic probe. B. The free-radical scavenging activity of ADC was determined by DPPH assay. NAC and RES were used as positive controls. C.,F. Cells were treated with HG in the presence or absence of ADC or RES for 24 h. The protein levels of HO-1, NQO-1, Nrf2 and Keap-1 were determined by western blot analysis. D. To quantify the mRNA expression levels of HO-1 and NQO-1, HUVECs were incubated with HG in the presence or absence of ADC or RES for 24 h. Total RNA was subjected to Q-PCR analysis. Relative mRNA levels were normalized with β-actin mRNA. E. HUVECs were pre-treated with ZnPP (10 mM) for 2 h and then incubated with HG in the presence or absence of ADC or RES for 24 h. Intracellular ROS was quantified by spectrophotometer. G. The protein expression and nuclear localization of Nrf2 was determined by immunofluorescence analysis. The subcellular and nuclear localization of Nrf2 was photographed using a fluorescence microscope. DAPI was used to stain the nucleus. H. To determine the Nrf2 transcriptional activity, HUVECs were transiently transfected with ARE promoter construct using ipofectamine and incubated with HG in the presence or absence of ADC or RES for 6 h. Cell lysates were mixed with luciferase reagents and quantified using an illuminometer. The fold change of relative ARE promoter activity was compared with untreated cells (NG). Values represent the mean ± SD of three independent experiments. Statistical significance was set at ФP < 0.05 compared to NG vs. HG, *P < 0.05 compared to HG vs. samples and ΘP < 0.05 compared to HG vs. ZnPP pre-treatment group.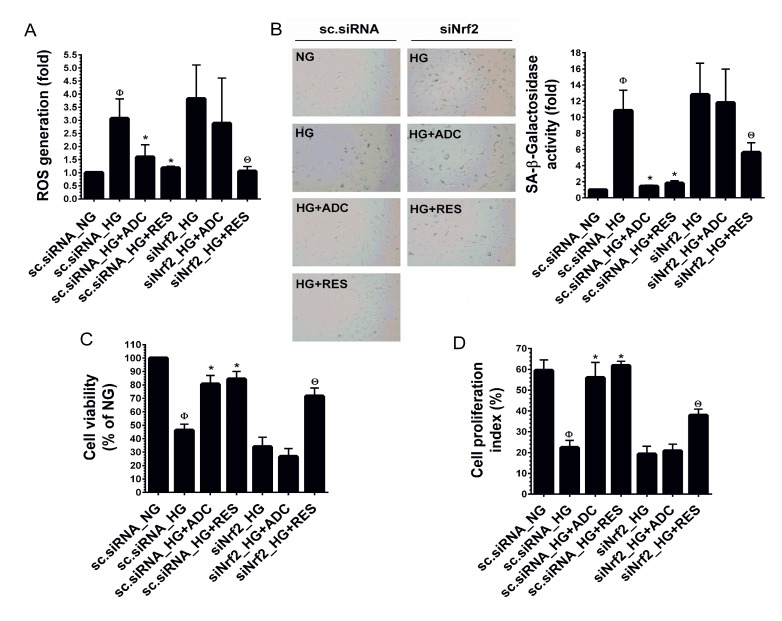
Figure 5. ADC has a protective effect…
Figure 5. ADC has a protective effect in Nrf2 silenced cells
HUVECs were transfected with…
Figure 5. ADC has a protective effect in Nrf2 silenced cells HUVECs were transfected with specific siRNA against Nrf2 or scrambled siRNA. After transfection for 24 h, cells were incubated with HG in the presence or absence of ADC or RES for 24-72 h. A. Intracellular ROS was measured by DCFH2-DA assay using a fluorescence spectrophotometer. Total RNA was extracted and subjected to Q-PCR analysis to determine HO-1 and NQO-1 mRNA expression levels. B. SA-β-gal activity was determined by SA-β-gal assay kit after incubation for 72 h. The left panel shows representative figures and right panel shows quantitative analysis of SA-β-gal positive cells per microscopic field. C. Cell viability was determined by MTT colorimetric assay. D. Cell proliferation index was determined by flow cytometry. Values represent the mean ± SD of three independent experiments. Statistical significance was set at ФP < 0.05 compared to NG vs. HG, *P < 0.05 compared to HG vs. samples and ΘP < 0.05 compared to HG vs. siNrf2 transfection group.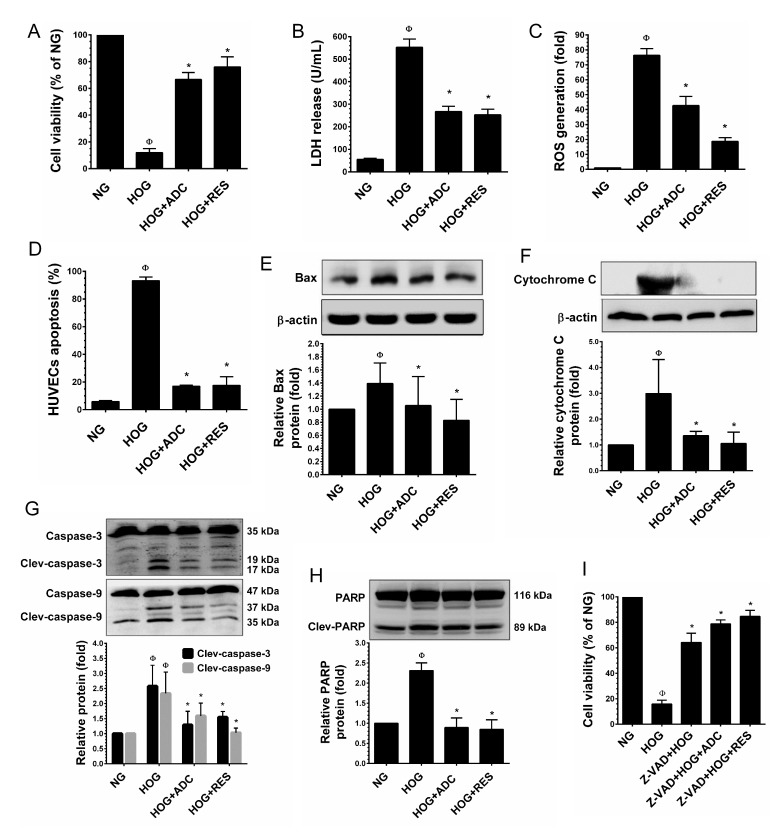
Figure 6. ADC protects HUVECs from hyperosmotic…
Figure 6. ADC protects HUVECs from hyperosmotic glucose (HOG)-induced cell death
HUVECs were incubated with…
Figure 6. ADC protects HUVECs from hyperosmotic glucose (HOG)-induced cell death HUVECs were incubated with HOG in the presence or absence of ADC or RES for 24 h. A. Cell viability was determined by MTT colorimetric assay. B. HUVEC injury was determined by LDH release into the culture media. C. Intracellular ROS generation was quantified by DCFH2-DA flurogenic assay. D. Apoptosis was determined by Annexin V/PI staining assay. E.,F. Protein levels of Bax and cytochrome C levels were measured by western blot analysis. The relative protein levels of Bax and cytochrome C were normalized with β-actin. G.,H. The activation (cleaved form) of caspase-9, caspase-3 and PARP were determined by western blot analysis and the protein levels were normalized with their corresponding pro-form. I. HUVECs were pre-incubated with caspase-3 inhibitor (Z-VAD-FMK, 30 µM) for 2 h and then incubated with HG in the presence or absence of ADC or RES for 24 h. The cell viability was determined by MTT assay. Values represent the mean ± SD of three independent experiments. Statistical significance was set at ФP < 0.05 compared to NG vs. HG and *P < 0.05 compared to HG vs. samples.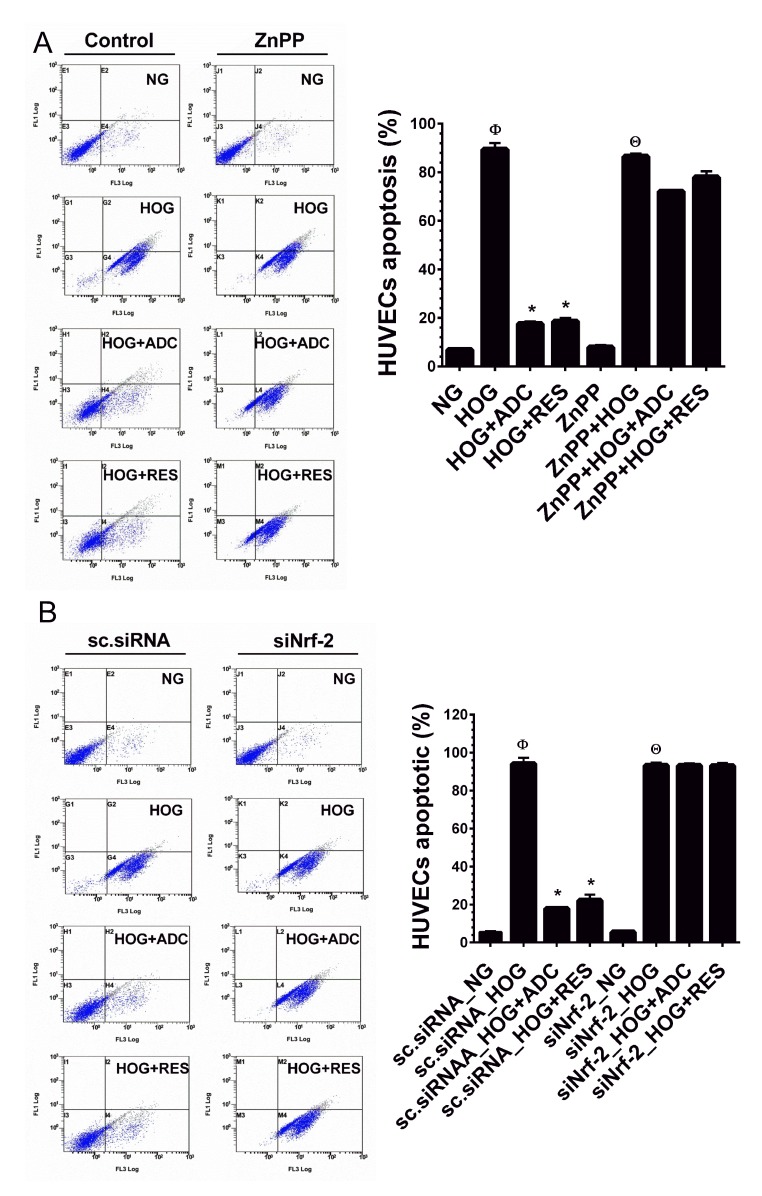
Figure 7. ADC failed to protect HOG-induced…
Figure 7. ADC failed to protect HOG-induced HUVEC apoptosis under Nrf2 silenced conditions
A. HUVECs… Figure 7. ADC failed to protect HOG-induced HUVEC apoptosis under Nrf2 silenced conditions A. HUVECs were transfected with specific siRNA against Nrf2 or scrambled siRNA (control). After transfection for 24 h, cells were incubated with HOG in the presence or absence of ADC or RES for 24 h. HUVEC apoptosis was determined by Annexin V/PI staining using a flow cytometer. B. HUVECs were pre-treated with ZnPP for 2 h and then incubated with HOG in the presence or absence of ADC or RES for 24 h. Apoptotic cell death was quantified by flow cytometry. Values represent the mean ± SD of three independent experiments. Statistical significance was set at ФP < 0.05 compared to NG vs. HG, *P < 0.05 compared to HG vs. samples and ΘP < 0.05 compared to NG vs. HOG in siNrf2 transfected cells.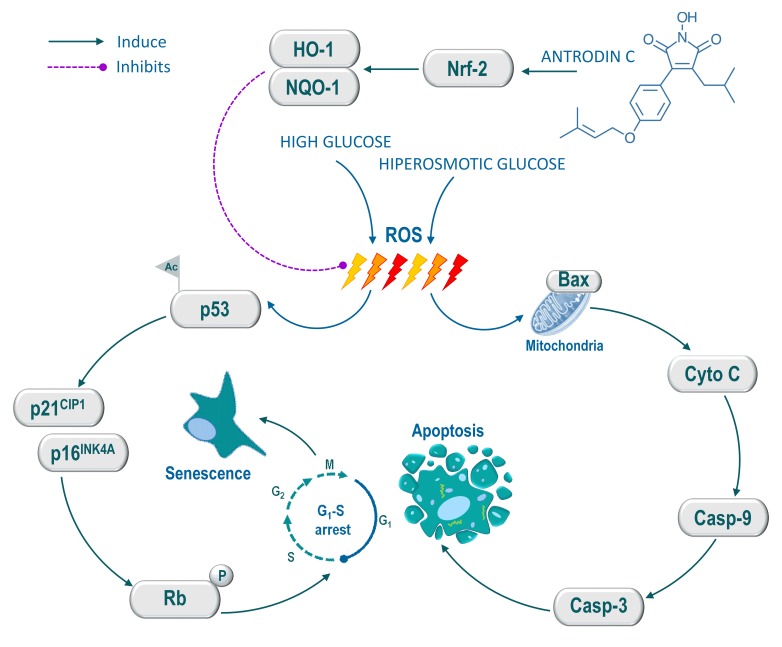
Figure 8. Schematic representation of antrodin C-mediated…
Figure 8. Schematic representation of antrodin C-mediated protection against high glucose or hyperosmotic glucose-induced senescence…
Figure 8. Schematic representation of antrodin C-mediated protection against high glucose or hyperosmotic glucose-induced senescence and apoptosis in human endothelial cells High glucose induces intracellular ROS, which triggers p53 acetylation. Activated p53 up-regulates p16INK4A and p21CIP1, which further activates Rb, thereby the cell-cycle was arrested at G1-S transition and induced cellular senescence. Conversely, hyperosmotic glucose induce aberrant cellular ROS production, which eventually induce apoptosis in HUVECs. However, treatment with antrodin C activates Nrf2-dependent anti-oxidant genes such as HO-1 and NQO-1 followed by degradation of Keap-1, which facilitates ROS inhibition and its down-stream cascades including cell-cycle arrest, senescence and apoptosis in human endothelial cells. All figures (8)