Zhankuic Acids A, B and C from Taiwanofungus Camphoratus Act as Cytotoxicity Enhancers by Regulating P-Glycoprotein in Multi-Drug Resistant Cancer Cells
Abstract
: Since P-glycoprotein (P-gp)-related multidrug resistance (MDR) remains the most important unsolved problem in cancer treatment, scientists are attempting to find potential structures from natural resources. The aim of the present study was to elucidate whether the triterpenoids from Taiwanofungus camphoratus could reverse cancer MDR by influencing P-gp efflux pump. Substrates efflux assay and P-gp ATPase activity assay were conducted to reveal the molecular mechanisms of P-gp inhibition, while SRB assay, cell cycle analyses and apoptosis analyses were performed to confirm the cancer MDR modulating effects. The results indicated that Zhankuic acids A, B and C (ZA-A, ZA-B and ZA-C) impacted P-gp efflux function in competitive, noncompetitive and competitive manners, respectively. Furthermore, these triterpenoids all demonstrated inhibitory patterns on both basal P-gp ATPase activity and verapamil-stimulated ATPase activity. In terms of MDR reversal effects, ZA-A sensitized the P-gp over-expressing cell line (ABCB1/Flp-InTM-293) and MDR cancer cell line (KB/VIN) toward clinically used chemotherapeutic drugs, including doxorubicin, paclitaxel and vincristine, exhibiting the best cytotoxicity enhancing ability among investigated triterpenoids. The present study demonstrated that ZA-A, ZA-B and ZA-C, popular triterpenoids from T. camphoratus, effectively modulated the drug efflux transporter P-gp and reversed the cancer MDR issue.
Figures 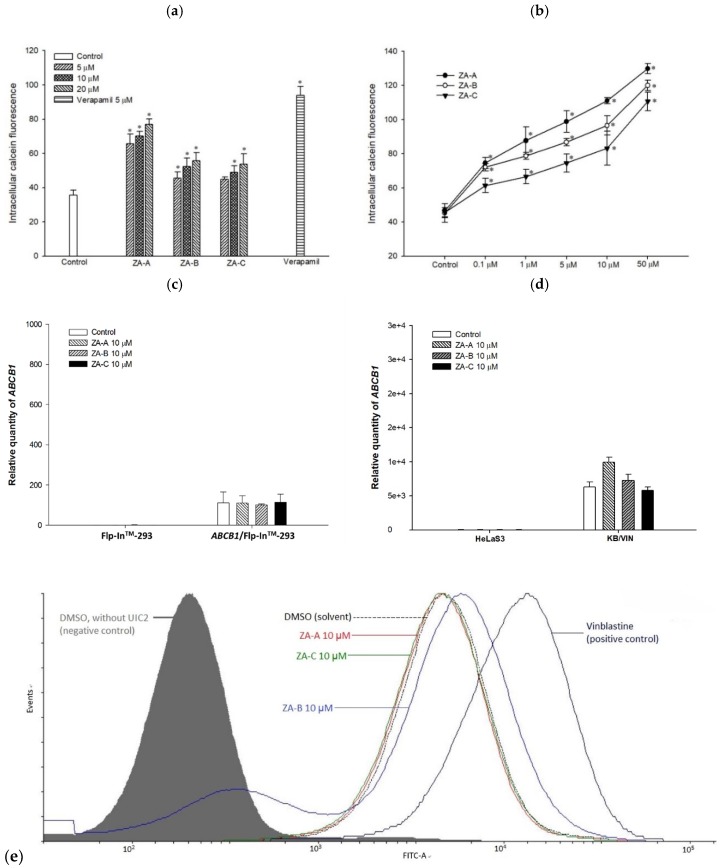
Figure 1
The effects of Zhankuic acids…
Figure 1
The effects of Zhankuic acids A, B and C (ZA-A, ZA-B and ZA-C)…
Figure 1 The effects of Zhankuic acids A, B and C (ZA-A, ZA-B and ZA-C) on human P-glycoprotein (P-gp). (a) Intracellular calcein fluorescence with or without ZA-A, ZA-B or ZA-C pretreatment in ABCB1/Flp-InTM-293 cell line (over-expressing human P-gp). Verapamil 5 μM was used as a positive control. * denotes p < 0.05 compared with the intracellular calcein fluorescence in control group. (b) The dose-dependent effects of ZA-A, ZA-B or ZA-C on calcein retention in ABCB1/Flp-InTM-293. * denotes p < 0.05 compared with the intracellular calcein fluorescence in control group. (c), (d) There were no significant ABCB1 mRNA expression differences after treating the ABCB1/Flp-InTM-293 or KB/VIN with 10 μM ZA-A, ZA-B or ZA-C for 72 h. © The conformation of P-gp was not influenced under the treatment of 10 μM ZA-A, ZA-B or ZA-C. Vinblastine was used as a positive control.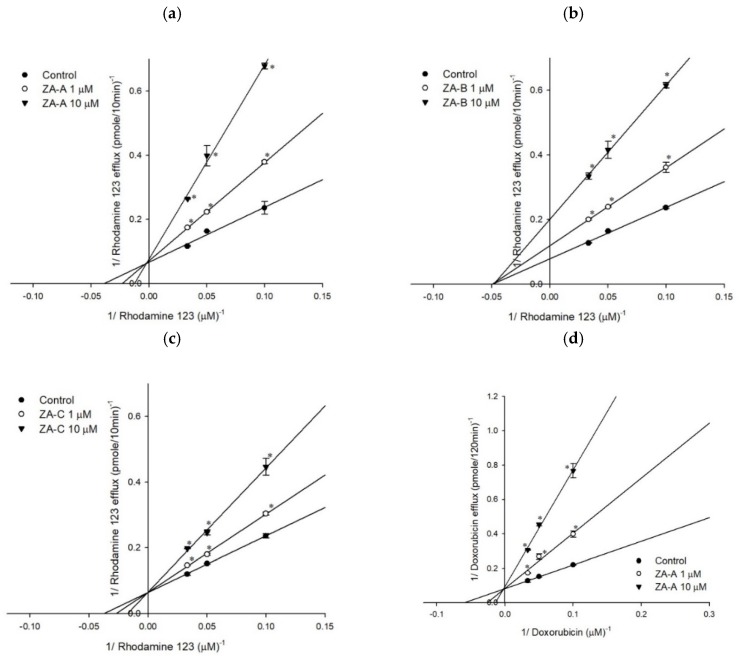
Figure 2
The Lineweaver–Burk plot analyses of…
Figure 2
The Lineweaver–Burk plot analyses of ZA-A, ZA-B and ZA-C on the transport of…
Figure 2 The Lineweaver–Burk plot analyses of ZA-A, ZA-B and ZA-C on the transport of rhodamine123 or doxorubicin in human P-gp. (a) ZA-A, (b) ZA-B and (c) ZA-C inhibited rhodamine 123 efflux via competitive, noncompetitive, and competitive mechanisms, respectively. (d) ZA-A, (e) ZA-B and (f) ZA-C inhibited doxorubicin efflux via competitive, noncompetitive and competitive mechanisms, respectively. * p < 0.05 compared with rhodamine123 or doxorubicin efflux without ZA-A, ZA-B or ZA-C treatment (control group). Data were presented as mean ± SE of at least three experiments, each in triplicate.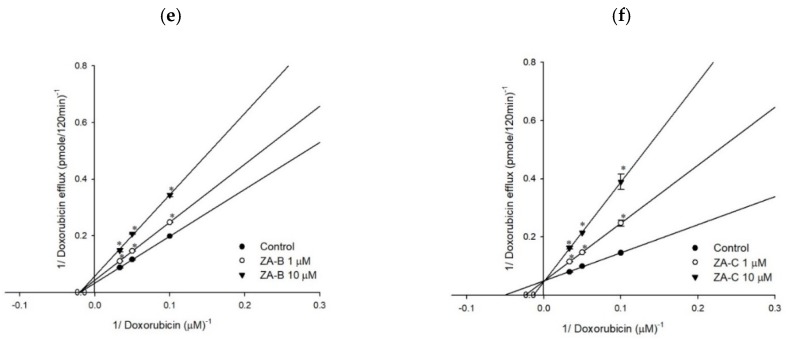
Figure 2
The Lineweaver–Burk plot analyses of…
Figure 2
The Lineweaver–Burk plot analyses of ZA-A, ZA-B and ZA-C on the transport of…
Figure 2 The Lineweaver–Burk plot analyses of ZA-A, ZA-B and ZA-C on the transport of rhodamine123 or doxorubicin in human P-gp. (a) ZA-A, (b) ZA-B and (c) ZA-C inhibited rhodamine 123 efflux via competitive, noncompetitive, and competitive mechanisms, respectively. (d) ZA-A, (e) ZA-B and (f) ZA-C inhibited doxorubicin efflux via competitive, noncompetitive and competitive mechanisms, respectively. * p < 0.05 compared with rhodamine123 or doxorubicin efflux without ZA-A, ZA-B or ZA-C treatment (control group). Data were presented as mean ± SE of at least three experiments, each in triplicate.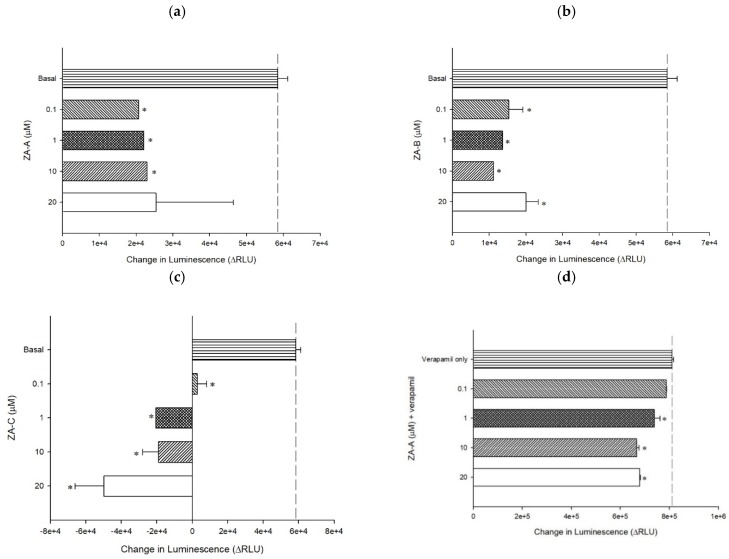
Figure 3
The P-gp ATPase modulating effects…
Figure 3
The P-gp ATPase modulating effects of ZA-A, ZA-B and ZA-C. ( a )…
Figure 3 The P-gp ATPase modulating effects of ZA-A, ZA-B and ZA-C. (a) ZA-A, (b) ZA-B and (c) ZA-C inhibited basal ATPase activity in a dose-dependent trend. Verapamil-stimulated ATPase activity was reversed by (d) ZA-A, (e) ZA-B and (f) ZA-C. Data were analyzed in terms of the change of luminescence (ΔRLU). * denotes p < 0.05 compared with theΔRLU in basal activity group or 200 μM verapamil treatment group. Data were presented as mean ± SE of at least three experiments, each in triplicate.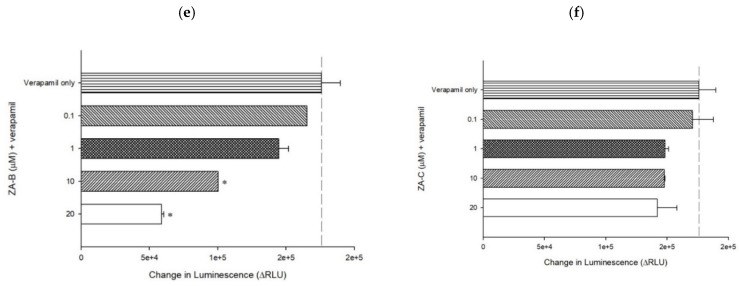
Figure 3
The P-gp ATPase modulating effects…
Figure 3
The P-gp ATPase modulating effects of ZA-A, ZA-B and ZA-C. ( a )…
Figure 3 The P-gp ATPase modulating effects of ZA-A, ZA-B and ZA-C. (a) ZA-A, (b) ZA-B and (c) ZA-C inhibited basal ATPase activity in a dose-dependent trend. Verapamil-stimulated ATPase activity was reversed by (d) ZA-A, (e) ZA-B and (f) ZA-C. Data were analyzed in terms of the change of luminescence (ΔRLU). * denotes p < 0.05 compared with theΔRLU in basal activity group or 200 μM verapamil treatment group. Data were presented as mean ± SE of at least three experiments, each in triplicate.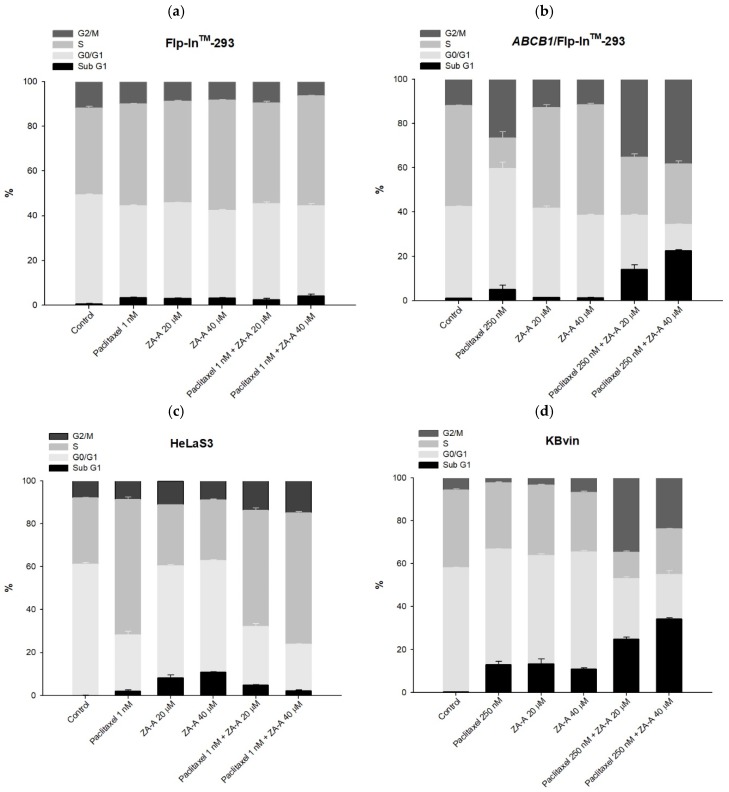
Figure 4
The cell cycle and apoptosis…
Figure 4
The cell cycle and apoptosis analyses of ZA-A and paclitaxel combinatorial treatment. (…
Figure 4 The cell cycle and apoptosis analyses of ZA-A and paclitaxel combinatorial treatment. (a), (b), (c) and (d) The cell cycle distribution of 72 h treatment in Flp-InTM-293, ABCB1/Flp-InTM-293, HeLaS3 and KB/VIN, respectively. Data were presented as mean ± SE of at least three experiments, each in triplicate. (e) The apoptosis phenomenon of 72 h treatment in KB/VIN cell line. Apoptosis and necrosis status of each sample was determined by annexin V (X-axis FITC) and PI (Y-axis PI). Cells distributed in Q1, Q2, Q3 and Q4 represent necrosis, late-apoptosis and normal and early-apoptosis, respectively.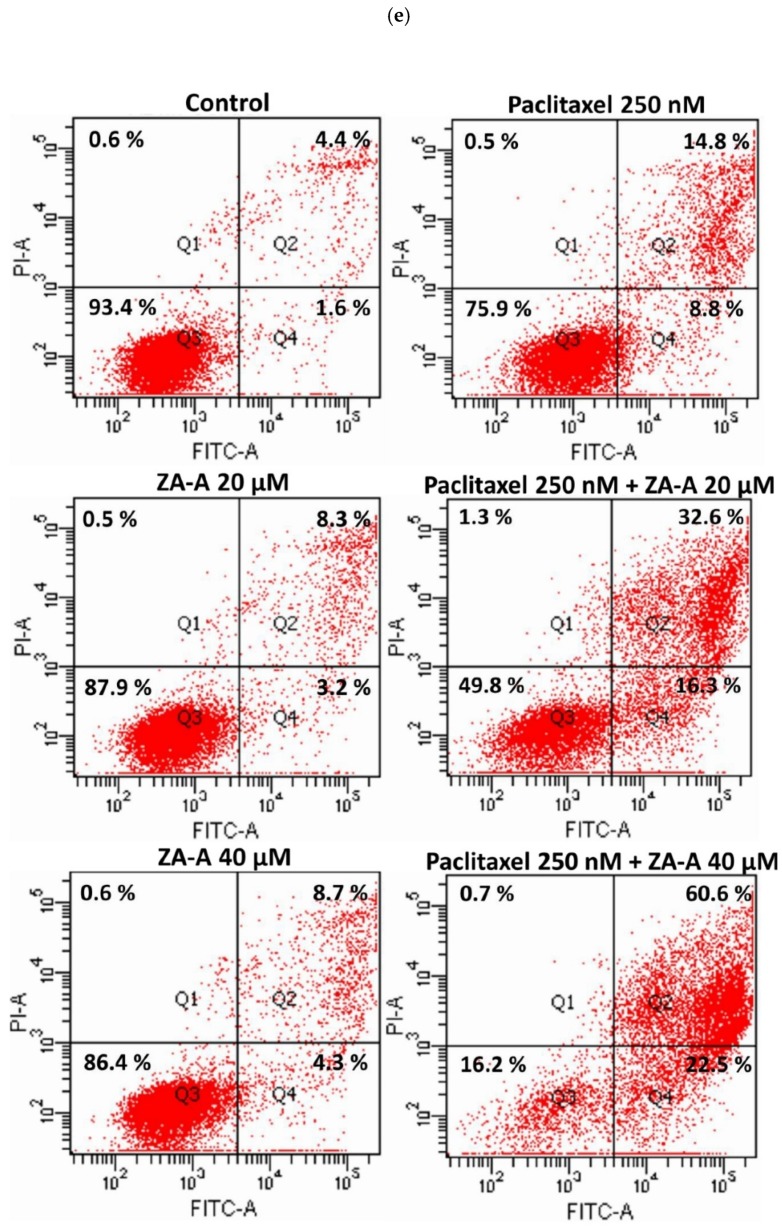
Figure 4
The cell cycle and apoptosis…
Figure 4
The cell cycle and apoptosis analyses of ZA-A and paclitaxel combinatorial treatment. (…
Figure 4 The cell cycle and apoptosis analyses of ZA-A and paclitaxel combinatorial treatment. (a), (b), (c) and (d) The cell cycle distribution of 72 h treatment in Flp-InTM-293, ABCB1/Flp-InTM-293, HeLaS3 and KB/VIN, respectively. Data were presented as mean ± SE of at least three experiments, each in triplicate. (e) The apoptosis phenomenon of 72 h treatment in KB/VIN cell line. Apoptosis and necrosis status of each sample was determined by annexin V (X-axis FITC) and PI (Y-axis PI). Cells distributed in Q1, Q2, Q3 and Q4 represent necrosis, late-apoptosis and normal and early-apoptosis, respectively.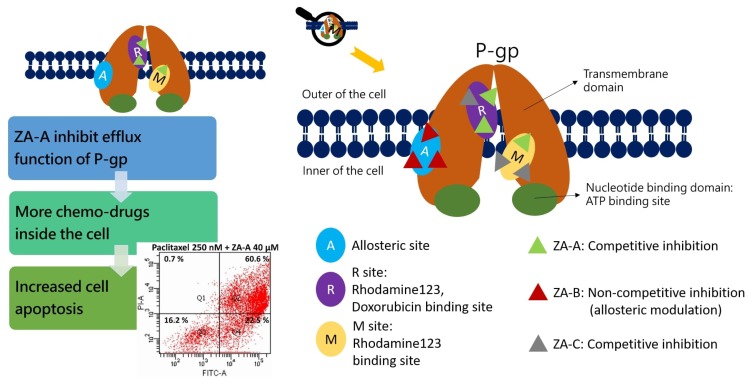
Figure 5
Summary of the P-gp inhibitory…
Figure 5
Summary of the P-gp inhibitory mechanisms and multidrug resistance (MDR) reversing effects of…
Figure 5 Summary of the P-gp inhibitory mechanisms and multidrug resistance (MDR) reversing effects of Zhankuic acids. ZA-A, ZA-B and ZA-C impacted P-gp efflux function through competitive, noncompetitive and competitive inhibitions, respectively. These effects resulted in increased intracellular concentration of chemo-drugs, rendering cell apoptosis. All figures (8)