The Regulatory Effects of a Formulation of Cinnamomum osmophloeum Kaneh and Taiwanofungus camphoratus on Metabolic Syndrome and the Gut Microbiome
Abstract
The number of people with metabolic syndrome (MetS) is increasing year by year, and MetS is associated with gut microbiota dysbiosis. The demand for health supplements to treat or prevent MetS is also growing. Cinnamomum osmophloeum Kaneh (CO) and Taiwanofungus camphoratus (TC) are endemic to Taiwan. Both have been shown to improve the symptoms of MetS, such as dyslipidemia and hyperglycemia. Herein, we investigated the effect of CO, TC and their formulations on diet-induced obese mice. Male C57BL/6J mice were fed with a high-fat diet (HFD) for 10 weeks to induce MetS. After that, the mice were fed with HFD supplemented with CO, TC, and various CO/TC formulations, respectively, for 14 weeks. The changes in physiological parameters and the composition of the gut microbiome were investigated. The results indicated that CO, TC, and their formulations effectively reduced hyperglycemia, and tended to alleviate MetS in obese mice. Moreover, we also observed that CO, TC, and their formulations improved gut microbiota dysbiosis by decreasing the Firmicutes-to-Bacteroidetes ratio and increasing the abundance of Akkermansia spp. Our results revealed that CO and TC might have potential for use as a prebiotic dietary supplement to ameliorate obesity-related metabolic disorders and gut dysbiosis.
Figures 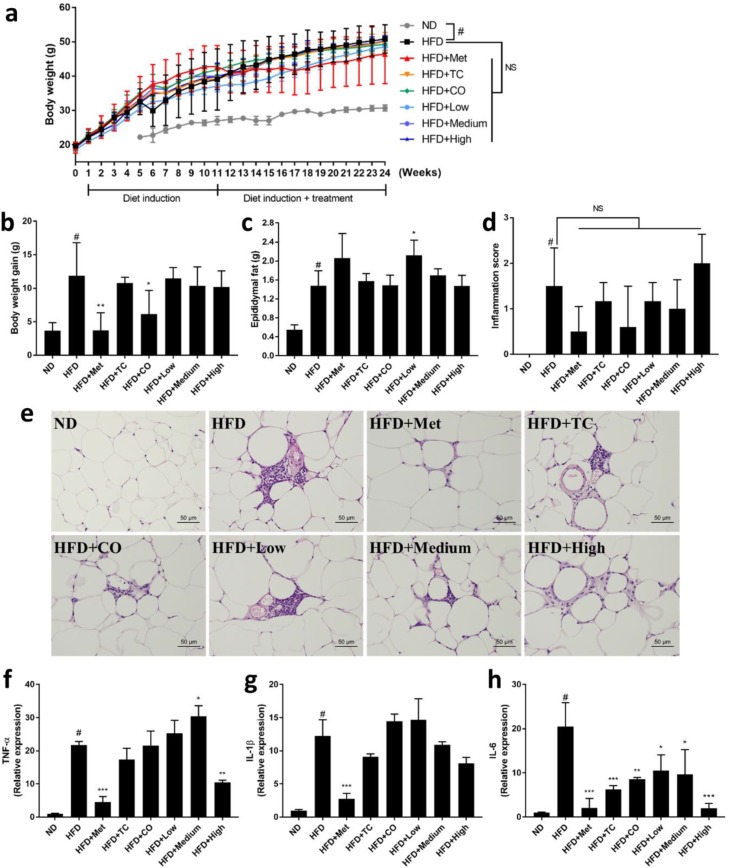
Figure 1
Effects of CO/TC formulations on…
Figure 1
Effects of CO/TC formulations on ( a ) body weight, ( b )…
Figure 1 Effects of CO/TC formulations on (a) body weight, (b) body weight gain, (c) epididymal fat, (d) inflammatory index of adipose tissue, and (e) epididymal adipocyte microsections stained with H&E, and the relative expression of (f) TNF-α, (g) IL-1β, (h) IL-6 in epididymal adipose tissue. Values are means ± SD for n = 6, and analyzed by one-way ANOVA with Tukey post-hoc test. #p < 0.05 was considered significant for ND vs. HFD. *** p < 0.001, ** p < 0.01, * p < 0.05 vs. HFD group. NS, represents no significance difference (p > 0.05).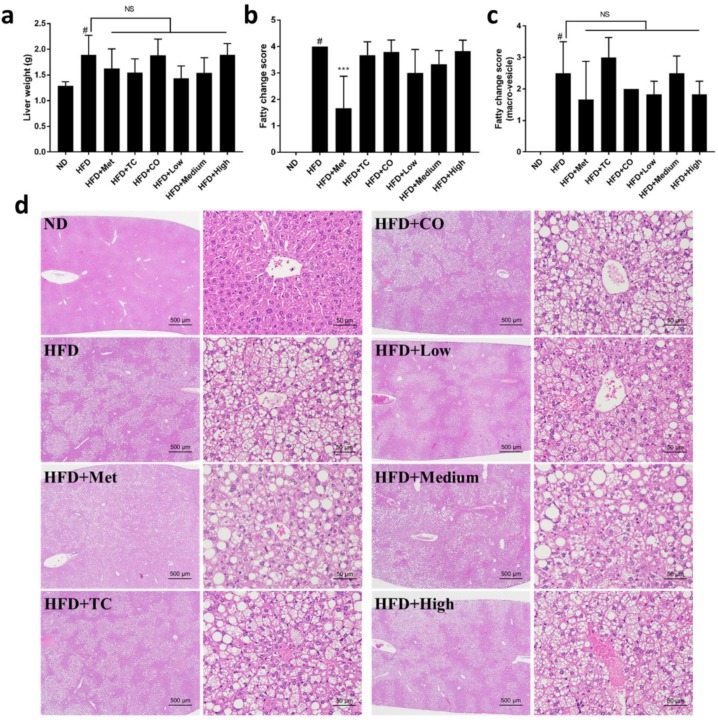
Figure 2
Effects of CO/TC formulations on…
Figure 2
Effects of CO/TC formulations on hepatic steatosis (n = 6). ( a )…
Figure 2 Effects of CO/TC formulations on hepatic steatosis (n = 6). (a) Liver weight. (b) Fatty change score of the livers. (c) Fatty change score with macro-vesicles of the livers. (d) Liver microsections stained with H&E. Data are reported as mean ± SD and analyzed by one-way ANOVA with Tukey post-hoc test. #p < 0.05 was considered significant for ND vs. HFD. *** p < 0.001 vs. HFD group. NS, represents no significance difference (p > 0.05).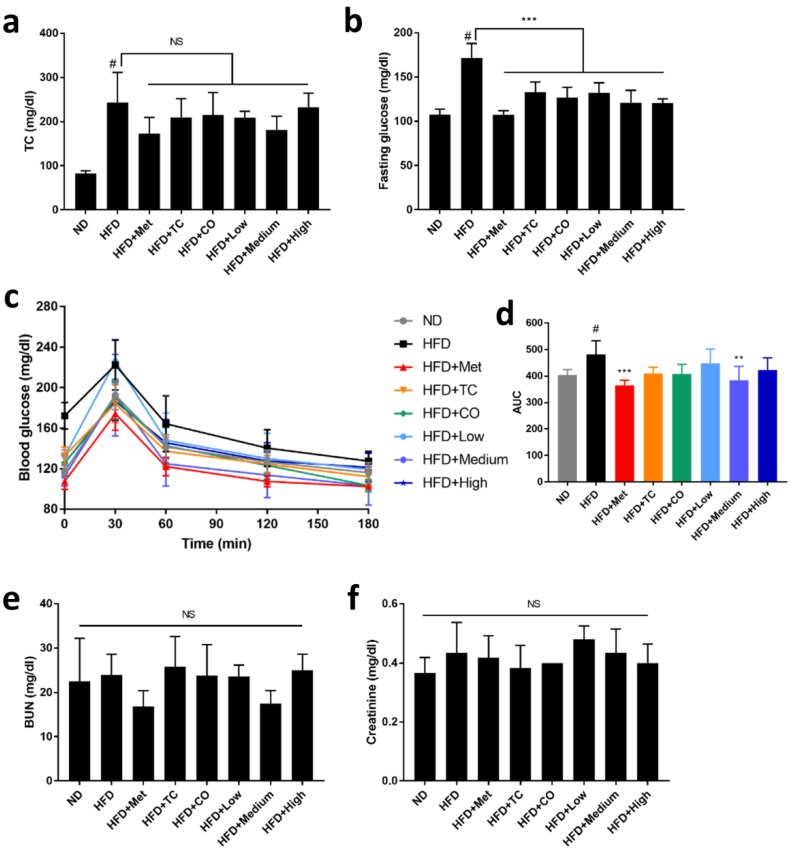
Figure 3
Effects of CO/TC formula on…
Figure 3
Effects of CO/TC formula on serum biochemical index (n = 6). ( a…
Figure 3 Effects of CO/TC formula on serum biochemical index (n = 6). (a) Total cholesterol. (b) Fasting glucose. (c) Oral glucose tolerance test and (d) its area under the curve (AUC). (e) Level of blood urea nitrogen. (f) Level of creatinine. Data are reported as mean ± SD and analyzed by one-way ANOVA with Tukey post-hoc test. #p < 0.05 was considered significant for ND vs. HFD. *** p < 0.001, ** p < 0.01 vs. HFD group. NS, represents no significance difference (p > 0.05).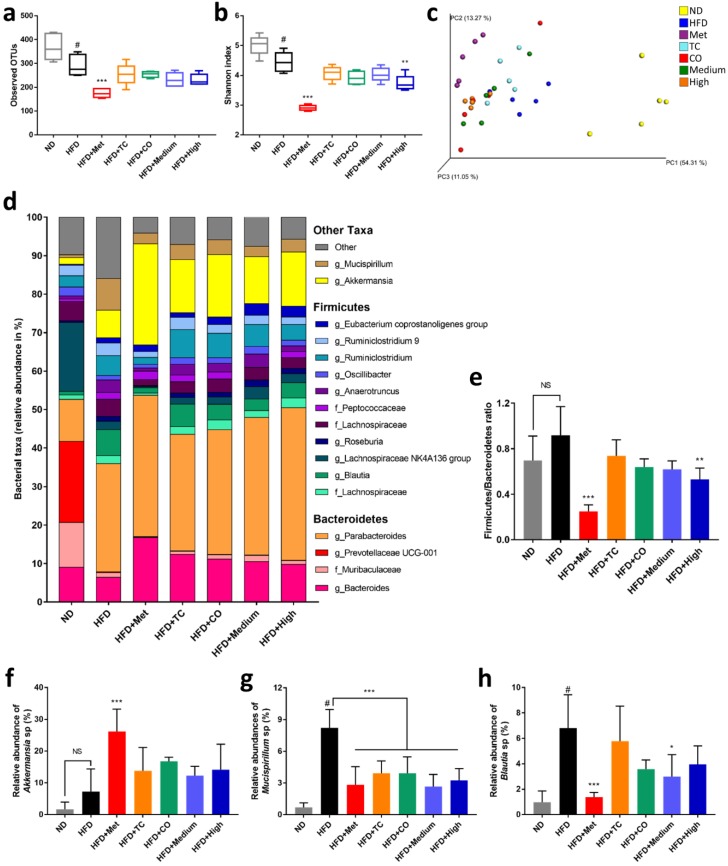
Figure 4
CO/TC formula alters gut microbiota…
Figure 4
CO/TC formula alters gut microbiota composition in HFD-fed mice (n = 5). Alpha…
Figure 4 CO/TC formula alters gut microbiota composition in HFD-fed mice (n = 5). Alpha diversity assessed by (a) the Shannon index and (b) observed species. (c) Principal co-ordinate analysis (PCoA) of the weighted UniFrac metric for fecal microbiota. (d) Taxa summary of samples. OTUs were combined if their deepest taxonomic classifications were identical, and taxa with less than 1% abundance were combined into ‘Other’. (e) The ratio of Firmicutes to Bacteroidetes. (f) The relative abundances of genus Akkermansia. (g) The relative abundances of genus Mucispirillum. (h) The relative abundances of genus Blautia. Data are reported as mean±SD and analyzed by one-way ANOVA with Tukey post-hoc test. #p < 0.05 was considered significant for ND vs. HFD. *** p < 0.001, ** p < 0.01, * p < 0.05 vs. HFD group. NS, represents no significance difference (p > 0.05).