The complete mitochondrial genome of medicinal fungus Taiwanofungus camphoratus reveals gene rearrangements and intron dynamics of Polyporales
Figures
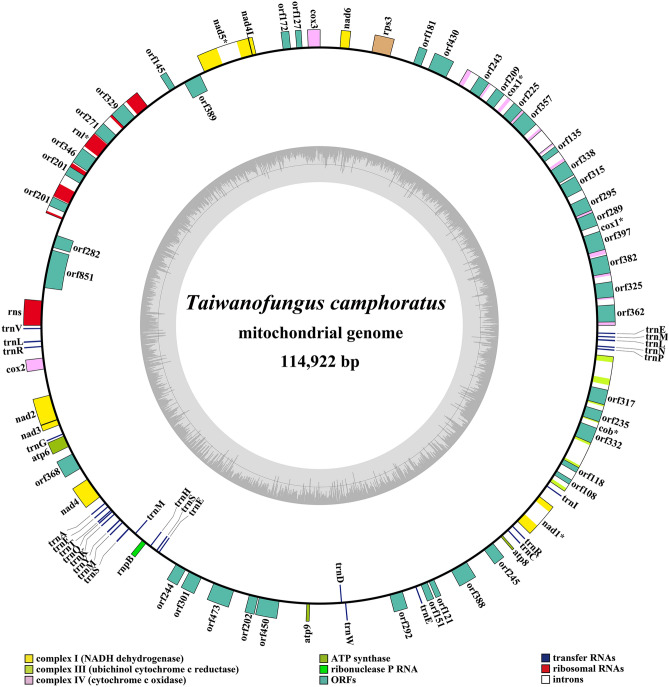
Figure 1
Circular map of the mitochondrial…
Figure 1
Circular map of the mitochondrial genome of Taiwanofungus camphoratus . Genes are represented…
Figure 1 Circular map of the mitochondrial genome of Taiwanofungus camphoratus. Genes are represented by different colored blocks. Colored blocks outside each ring indicate that the genes are on the direct strand, while colored blocks within the ring indicates that the genes are located on the reverse strand.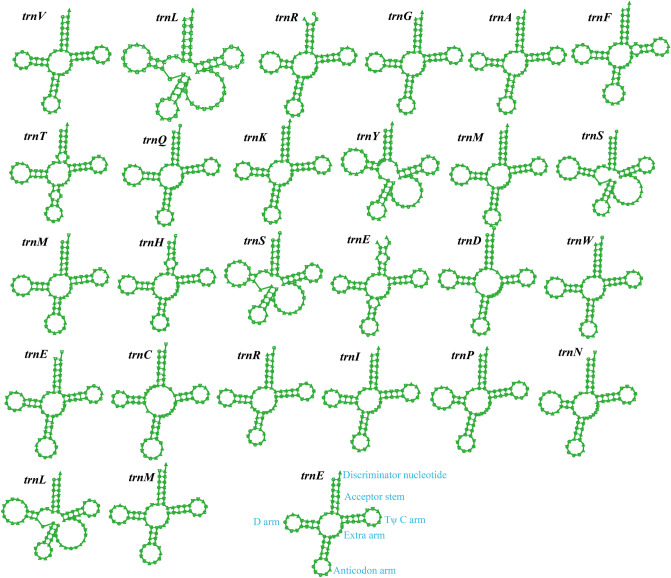
Figure 2
Putative secondary structures of the…
Figure 2
Putative secondary structures of the 27 tRNA genes identified in the mitochondrial genome…
Figure 2 Putative secondary structures of the 27 tRNA genes identified in the mitochondrial genome of Taiwanofungus camphoratus. All genes are shown in order of occurrence in the mitochondrial genome of Taiwanofungus camphoratus, starting from trnV. tRNA structures were determined using MITOS.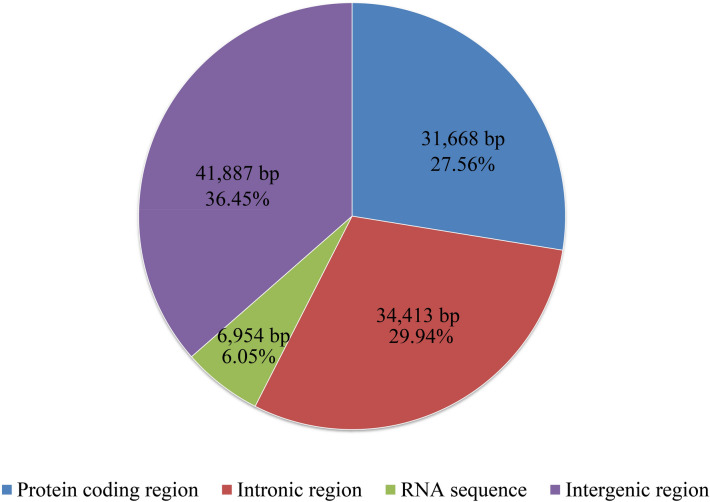
Figure 3
The protein-coding, intronic, intergenic, and…
Figure 3
The protein-coding, intronic, intergenic, and RNA gene region proportions of the entire mitochondrial…
Figure 3 The protein-coding, intronic, intergenic, and RNA gene region proportions of the entire mitochondrial genome of Taiwanofungus camphoratus.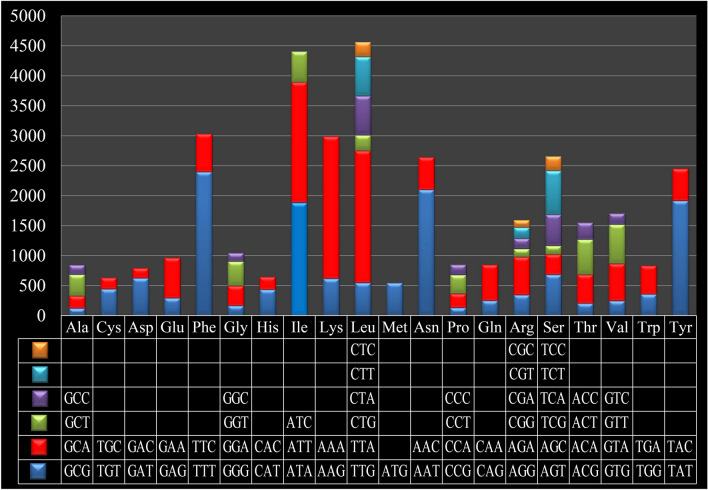
Figure 4
Codon usage in the mitochondrial…
Figure 4
Codon usage in the mitochondrial genome of Taiwanofungus camphoratus . Count of codon…
Figure 4 Codon usage in the mitochondrial genome of Taiwanofungus camphoratus. Count of codon usage is plotted on the y-axis.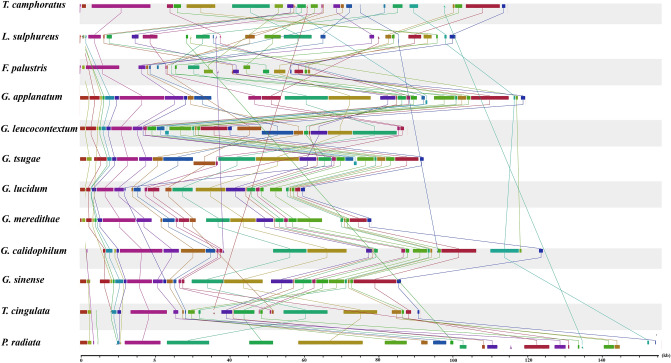
Figure 5
Co-linearity analysis of 12 Polyporales…
Figure 5
Co-linearity analysis of 12 Polyporales mitogenomes. Homologous regions were connected with straight lines…
Figure 5 Co-linearity analysis of 12 Polyporales mitogenomes. Homologous regions were connected with straight lines of the same color. The sizes and relative positions of the homologous regions varied among the mitogenomes.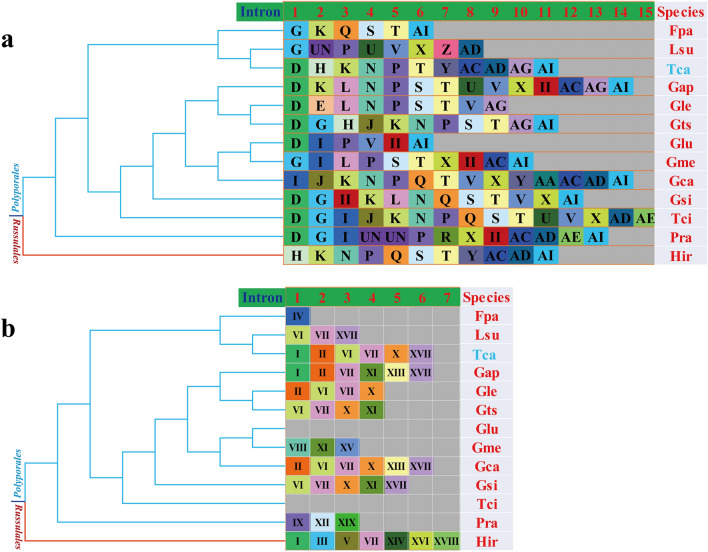
Figure 6
Pcl information of cox1 gene…
Figure 6
Pcl information of cox1 gene ( a ) and cob gene ( b…
Figure 6 Pcl information of cox1 gene (a) and cob gene (b) of the 12 Polyporales species. The same Pcl (orthologous intron) is represented by the same letter or the same roman numeral. The phylogenetic positions of 12 Polyporales species were established using the Bayesian inference (BI) method and Maximum Likelihood (ML) method based on 15 concatenated mitochondrial core proteins and 2 rRNA genes. UN indicates that the intron is different from the known introns in insertion site and sequence similarity. The II in the figure above shows that the intron belongs to the group II intron. Species ID are shown in Supplementary Table S8.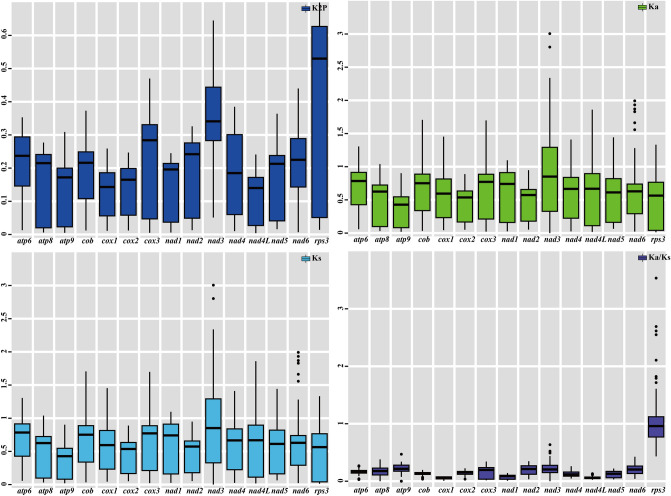
Figure 7
Genetic analysis of 15 protein…
Figure 7
Genetic analysis of 15 protein coding genes conserved in 12 Polyporales mitogenomes. K2P…
Figure 7 Genetic analysis of 15 protein coding genes conserved in 12 Polyporales mitogenomes. K2P the Kimura-2-parameter distance, Ka the mean number of nonsynonymous substitutions per nonsynonymous site, Ks the mean number of synonymous substitutions per synonymous site.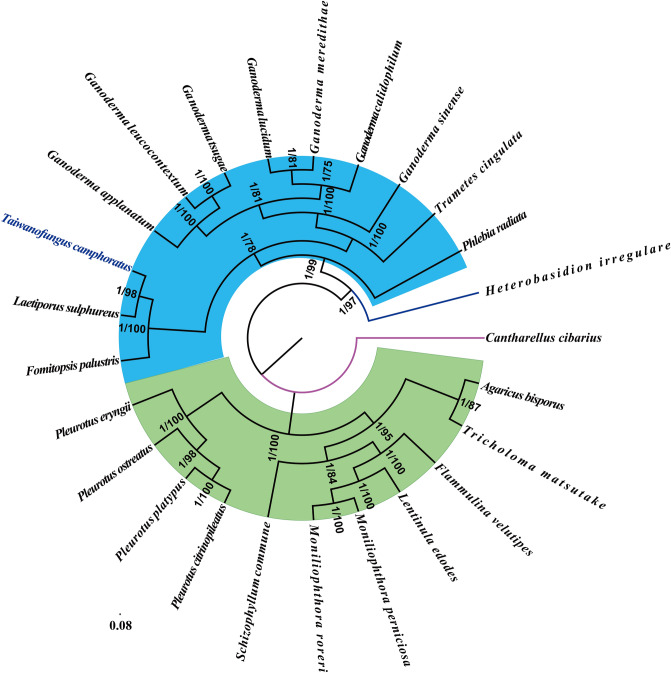
Figure 8
Molecular phylogeny of 25 Agaricomycetes…
Figure 8
Molecular phylogeny of 25 Agaricomycetes species based on Bayesian inference (BI) and Maximum…
Figure 8 Molecular phylogeny of 25 Agaricomycetes species based on Bayesian inference (BI) and Maximum Likelihood (ML) analyses of 15 protein coding genes and two rRNA genes. Support values are bayesian posterior probabilities (before slash) and bootstrap values (after slash). Species and NCBI accession numbers for genomes used in the phylogenetic analysis are provided in Supplementary Table S8. All figures (8)