Targeting cancer initiating cells by promoting cell differentiation and restoring chemosensitivity via dual inactivation of STAT3 and src activity using an active component of antrodia cinnamomea mycelia
Abstract
Cancer initiating cells (CICs) represent a subpopulation of cancer cells, which are responsible for tumor growth and resistance to chemotherapy. Herein, we first used a cell-based aldehyde dehydrogenase (ALDH) activity assay to identify that YMGKI-2 (also named as Ergone), an active component purified from Antrodia cinnamomea Mycelia extract (ACME), effectively abrogated the ALDH activity and abolished the CICs in head and neck squamous cell carcinoma cells (HNSCCs). Consequently, YMGKI-2 treatment suppressed self-renewal ability and expression of stemness signature genes (Oct-4 and Nanog) of sphere cells with enriched CICs. Moreover, YMGKI-2 treated sphere cells displayed reduction of CICs properties and promotion of cell differentiation, but not significant cytotoxicity. YMGKI-2 treatment also attenuated the tumorigenicity of HNSCC cells in vivo. Mechanistically, treatment of YMGKI-2 resulted in inactivation of STAT3 and Src. Lastly, combinatorial treatments with YMGKI-2 and standard chemotherapeutic drugs (cisplatin or Fluorouracil) restored the chemosensivity on sphere cells and cisplatin-resistant HNSCC cells. Together, we demonstrate that YMGKI-2 treatment effectively induces differentiation and reduces tumorigenicity of CICs. Further, combined treatment of YMGKI-2 and conventional chemotherapy can overcome chemoresistance. These results suggest that YMGKI-2 treatment may be used to improve future clinical responses in head and neck cancer treatment through targeting CICs.
Figures 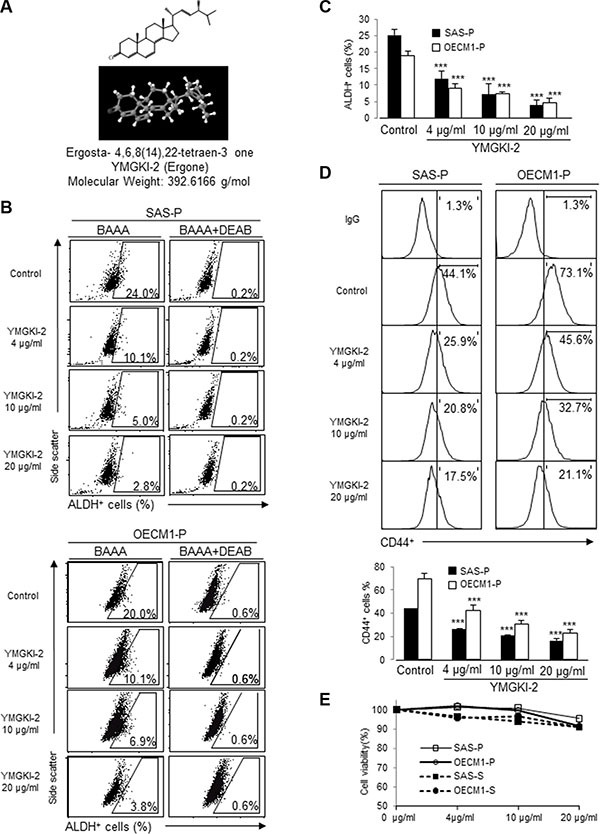
Figure 1. Reduced CICs subpopulation but not…
Figure 1. Reduced CICs subpopulation but not cytotoxic effect of YMGKI-2 treated HNSCC cells or…
Figure 1. Reduced CICs subpopulation but not cytotoxic effect of YMGKI-2 treated HNSCC cells or sphere cells (A) Chemical structure of YMGKI-2 (Ergone) isolated from the mycelium of Antrodia cinnamomea. (B) HNSCC cells (SAS-P and OECM1-P) were treated with YMGKI-2 for 24 hrs, afterward; the intracellular ALDH activity was examined by ALDEFLUOR™ flow cytometry-based assay. BODIPY-aminoacetaldehyde (BAAA): BAAA is a fluorescent substrate for ALDH. DEAB, a specific inhibitor of ALDH1 enzyme, was used as negative control. (C) The bar graph shows quantification of ALDH-positive cells from panel (B). (D) Expression profile of CD44-positive cells of YMGKI-2 treated HNSCC cells was analyzed by flow cytometry. The bar graph shows quantification of CD44-positive cells. (E) Parental cells (SAS-P or OECM1-P) or sphere cells (SAS-S or OECM1-S) were treated with 0, 4, 10 or 20 μg/ml of YMGKI-2 for 24 hr, afterward, stained with propidium iodide (PI) and then examined by flow cytometry. The PI-negative cells were recorded as viable cells. The data are means ± SD of three independent experiments (*p < 0.05).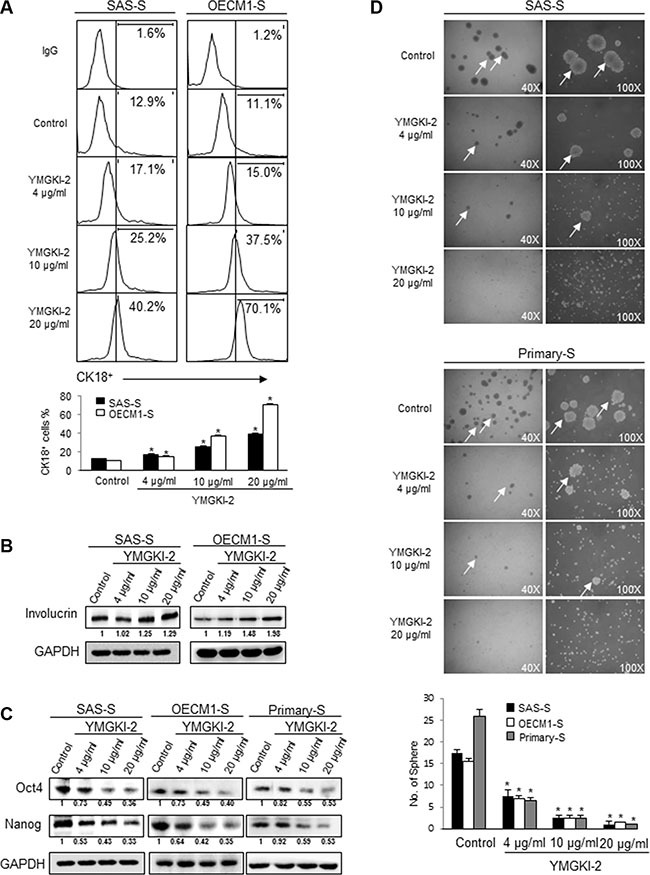
Figure 2. Diminished stemness properties and enhanced…
Figure 2. Diminished stemness properties and enhanced differentiation of sphere cells with YMGKI-2 treatment
(…
Figure 2. Diminished stemness properties and enhanced differentiation of sphere cells with YMGKI-2 treatment (A) Sphere cells (SAS-S and OECM1-S) were treated with YMGKI-2 at different concentration for 24 hrs, and then stained with anti-CK18 antibodies, secondary antibody conjugated with Cy5 fluorescence dye and detected by flow cytometry. The bar graph shows quantification of CK18-positive cells. (B) Immunoblots showing the expression of Involucrin and GAPDH in sphere cells with or without indicated treatments. (C) Crude cell extract proteins of YMGKI-2-treated sphere cells (SAS-S, OECM1-S and Primary-S) were collected and analyzed by immunoblotting against anti-Oct-4, anti-Nanog or anti-GAPDH antibodies as indicated. The immunoactive signal of GAPDH protein of different crude cell extracts was referred as loading control. (D) Sphere cells (SAS-S, OECM1-S and Primary-S) were treated with YMGKI-2 for 24 hrs, and the sphere formation ability of YMGKI-2 treated cells was examined. White arrows indicate the sphere body. The bar graph shows quantification of sphere number. Data are means ± SD of triplicate samples from three experiments (*P < 0.05).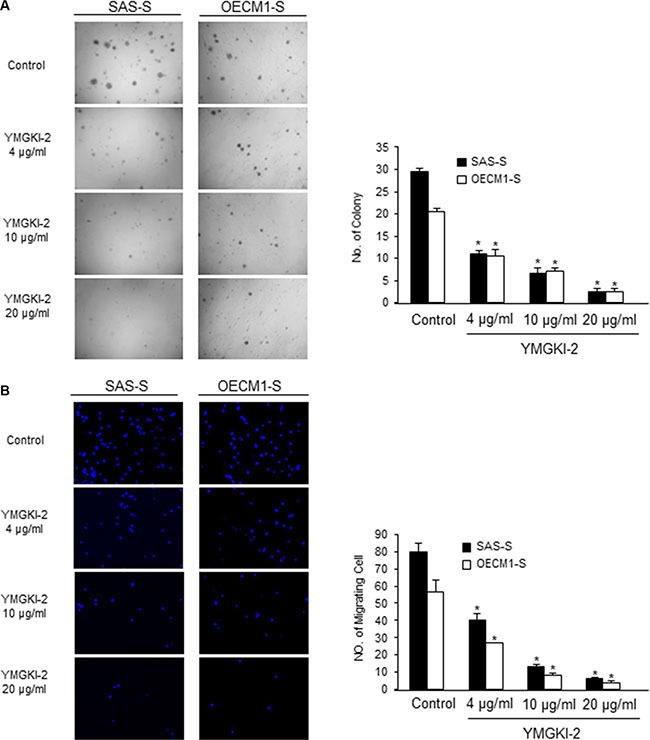
Figure 3. Reduced in vitro malignancy of…
Figure 3. Reduced in vitro malignancy of sphere cells treated with YMGKI-2
( A )…
Figure 3. Reduced in vitro malignancy of sphere cells treated with YMGKI-2 (A) Sphere cells (SAS-S, OECM-1-S and Primary-S) treated with different concentration of YMGKI-2 for 24 hrs, then, were plated onto soft agar and grew for 12 day. The colony formation ability of the YMGKI-2 treated cells was examined. Data are means ± SD of triplicate samples from three experiments (P < 0.05). (B) Sphere cells (SAS-S, OECM1-S and Primary-S) treated with different concentration of YMGKI-2 for 24 hrs, afterwards, were plated onto Transwell. The migratory ability of YMGKI-2 treated cells was analyzed as described in Materials and Methods.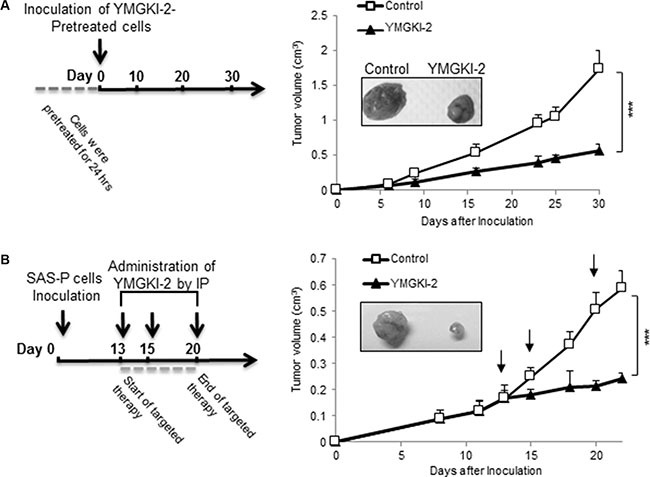
Figure 4. Attenuation on xenograft tumor growth…
Figure 4. Attenuation on xenograft tumor growth of YMGKI-2 treated HNSCC in vivo
( A…
Figure 4. Attenuation on xenograft tumor growth of YMGKI-2 treated HNSCC in vivo (A) SAS cells pretreated with 10 μg/ml of YMGKI-2 for 24 hours were inoculated subcutaneously into nude mice. The curve of tumor growth and the representative image of dissected tumors 30 days afterward inoculation were recorded. (B) SAS cells (1 × 10⁶ cells) were subcutaneously inoculated into nude mice. When tumors became palpable, 20 mg/kg of YMGKI-2 was injected intraperitoneally on days 13, 15 and 20. Consequently, the tumor growth curves were recorded. Error bars correspond to SD. (n = 3; *P < 0.05).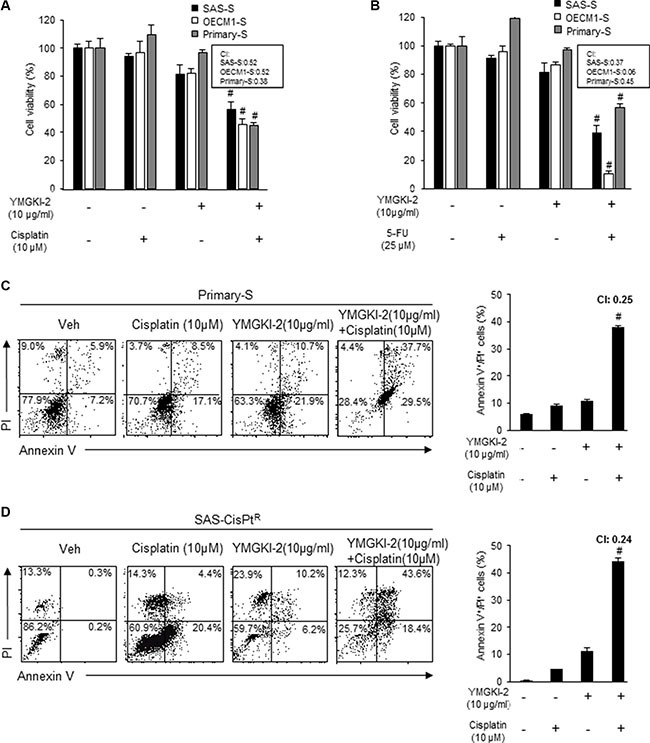
Figure 5. Restored chemosensitivity in YMGKI-2 treated…
Figure 5. Restored chemosensitivity in YMGKI-2 treated sphere cells and cisplatin resistant cells
Sphere cells…
Figure 5. Restored chemosensitivity in YMGKI-2 treated sphere cells and cisplatin resistant cells Sphere cells (SAS-S, OECM1-S and Primary-S) were either singly treated with 10 μg/ml of YMGKI-2 or co-treated with (A) cisplatin (10 μM) or (B) 5-FU (25 μM). The cell viability was determined by MTT assay. The (C) sphere cells (Primary-S) or (D) SAS-cisplatin resistance cells (SAS-CisPtR) were either singly treated or co-treated with YMGKI-2 (10 μg/ml) and cisplatin (10 μM). The drug treated cells were co-stained with Annexin V and PI, then, the expression profile of the co-staining was collected (left panels). The percentage of cells positively stained with Annexin V and PI (Annexin V+/PI+) was plotted to indicate the dying cells (right panels). (#CI < 0; Combination index (CI)). Data are means ± SD of triplicate samples from three experiments (*P < 0.05).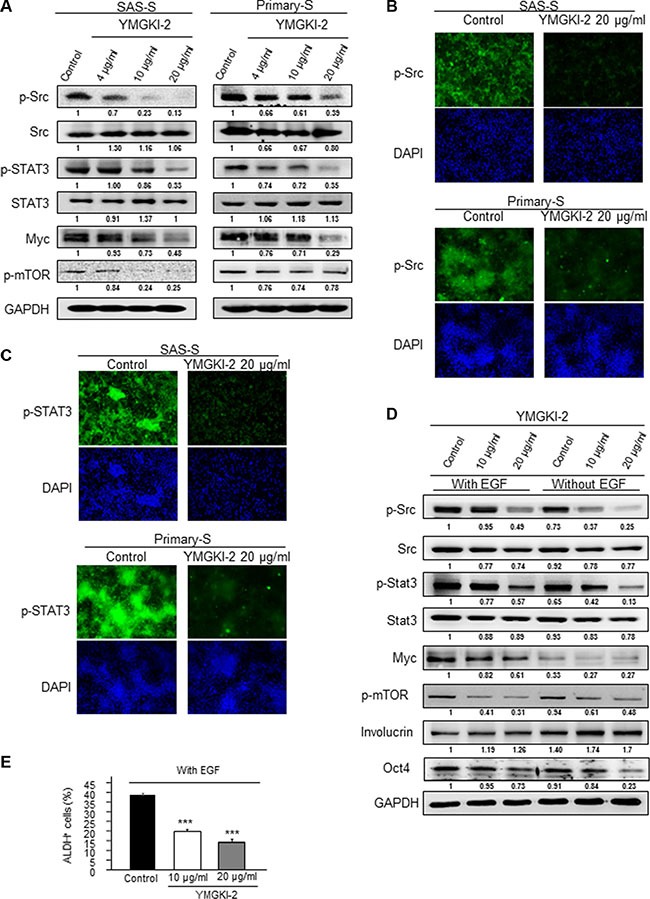
Figure 6. Inactivation of STAT3 and Src…
Figure 6. Inactivation of STAT3 and Src activity by YMGKI-2 treatment
( A ) Crude…
Figure 6. Inactivation of STAT3 and Src activity by YMGKI-2 treatment (A) Crude cell extract proteins of YMGKI-2 treated sphere cells (SAS-S, OECM1-S and Primary-S) were collected and analyzed by immunoblotting against anti-p-Src, anti-Src, anti-p-STAT3, anti-STAT3, Myc, p-mTOR or anti-GAPDH antibodies as indicated. The immunoactive signal of GAPDH protein of different crude cell extracts was referred as loading control. Immunofluorescent photograph of SAS-S and Primary-S stained with the primary antibody p-Src (B) or p-STAT3 (C) and secondary antibody conjugated with FITC fluorescence dye. Blue fluorescence indicates DAPI nuclear staining. (D) SAS cells treated with the YMGKI-2 (10 or 20 μM) or control cells (ethanol) in the absence or presence of 20 ng/ml EGF were cultivated under serum free medium, then, the crude cell lysates were collected and analyzed by immunoblotting with the indicated antibodies (The primary antibodies are listed in Supplementary Table S1). (E) SAS cells treated with the YMGKI-2 (10 or 20 μM) or control cells (ethanol) in the absence or presence of 20 ng/ml EGF were cultivated under serum free medium; afterwards; the intracellular ALDH activity was examined by ALDEFLUOR™ flow cytometry-based assay. The bar graph quantitating the ALDH-positive cells.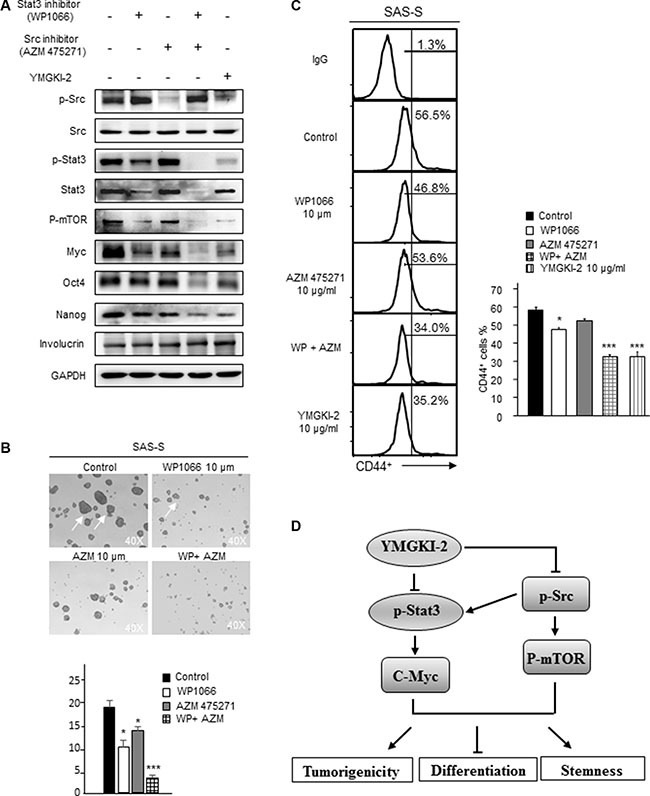
Figure 7. Combined treatment with Src and…
Figure 7. Combined treatment with Src and STAT3 inhibitors diminished the sphere formation ability and…
Figure 7. Combined treatment with Src and STAT3 inhibitors diminished the sphere formation ability and CIC marker expression of HN-CICs (A) SAS-Sphere cells were either singly treated or co-treated with Src (AZM 475271; 10 μM) and STAT3 inhibitors (WP1066; 10 μM) for 24 hr. Afterwards; the crude cell lysates were collected, and the protein level of pluripotent stemness markers (Oct4 and Nanog) and epithelial differentiation marker (Involucrin) was assessed by western blot. (B) Single cell suspension of sphere cells was either singly treated or co-treated with Src and STAT3 inhibitors for 24 hr, then, the sphere formation ability of treated sphere cells was assessed after 14 days. Arrows indicating the sphere cells. (C) CD44 positive cells in drugs treated cells were measured by FACS analyses. (D) Hypothetical model of the effects of YMGKI-2 on inhibition of stemness properties and tumorigenicity, but promoting differentiation of head and neck cancer initiating cells (HN-CICs). YMGKI-2 directly or indirectly inhibits the Src/Stat3 pathways which play the important roles in maintaining CICs properties of head and neck cancer. All figures (7)