Suppression of Cell Growth, Migration and Drug Resistance by Ethanolic Extract of Antrodia cinnamomea in Human Lung Cancer A549 Cells and C57BL/6J Allograft Tumor Model
Abstract
The purpose of this study was to investigate the inhibitory activities of ethanolic extracts from Antrodia cinnamomea (EEAC) on lung cancer. Cell proliferation and cell cycle distribution were analyzed using (3-(4,5-Dimethylthiazol-2-yl)-2,5-diphenyltetrazolium bromide) (MTT) assay and flow cytometry, respectively. Wound-healing assay, Western blotting, and a murine tumor model were separately used to examine cell migration, protein expression, and tumor repression. Our results showed that EEAC induced cell cycle arrest at the G0/G1 phase resulting decreased cell viability in A549 cells. Moreover, EEAC up-regulated the growth-suppressing proteins, adenosine 5'-monophosphate-activated protein kinase (AMPK), p21 and p27, but down-regulated the growth-promoting proteins, protein kinase B (Akt), mammalian tarfet of rapamycin (mTOR), extracellular signal-regulating kinase 1/2 (ERK1/2), retinoblastoma protein (Rb), cyclin E, and cyclin D1. EEAC also inhibited A549 cell migration and reduced expression of gelatinases. In addition, our data showed that tumor growth was suppressed after treatment with EEAC in a murine allograft tumor model. Some bioactive compounds from EEAC, such as cordycepin and zhankuic acid A, were demonstrated to reduce the protein expressions of matrix metalloproteinase (MMP)-9 and cyclin D1 in A549 cells. Furthermore, EEAC enhanced chemosensitivity of A549 to paclitaxel by reducing the protein levels of caveolin-1. Our data suggests that EEAC has the potential to be an adjuvant medicine for the treatment of lung cancer.
Figures 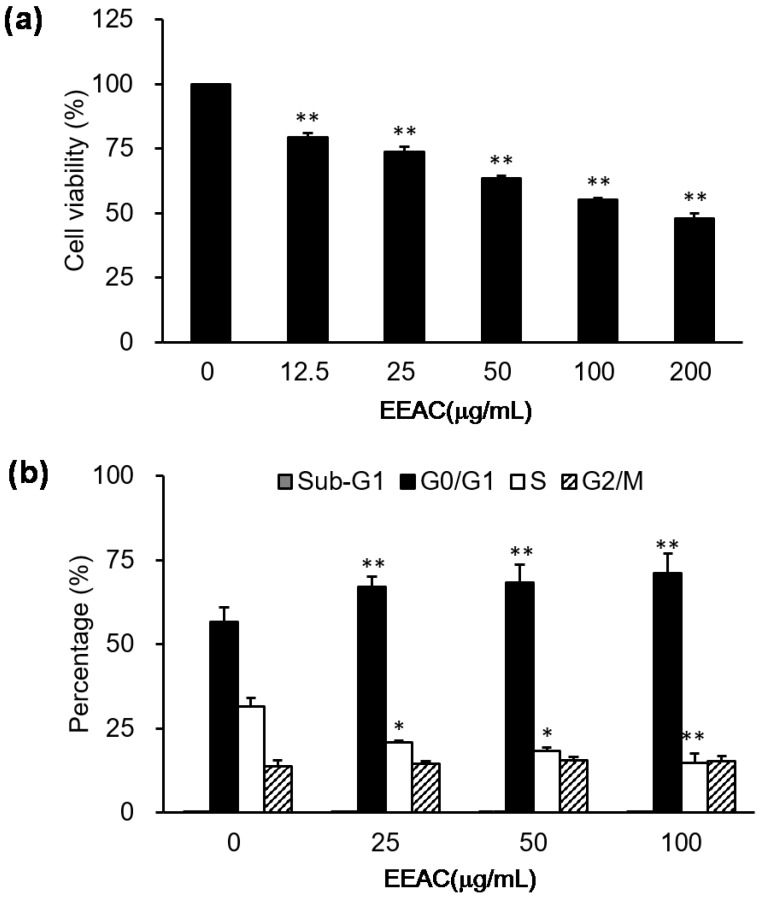
Figure 1
Growth regulation of ethanolic extracts…
Figure 1
Growth regulation of ethanolic extracts from Antrodia cinnamomea (EEAC) in A549 cells. Cell…
Figure 1 Growth regulation of ethanolic extracts from Antrodia cinnamomea (EEAC) in A549 cells. Cell viability and cell cycle distribution were, respectively, measured using an (3-(4,5-Dimethylthiazol-2-yl)-2,5-diphenyltetrazolium bromide) (MTT) assay (a) and a flow cytometer (b) in A549 cells treated with various concentrations of EEAC for 24 h.* p < 0.05 and ** p < 0.01 compared to the control group (without EEAC treatment), respectively.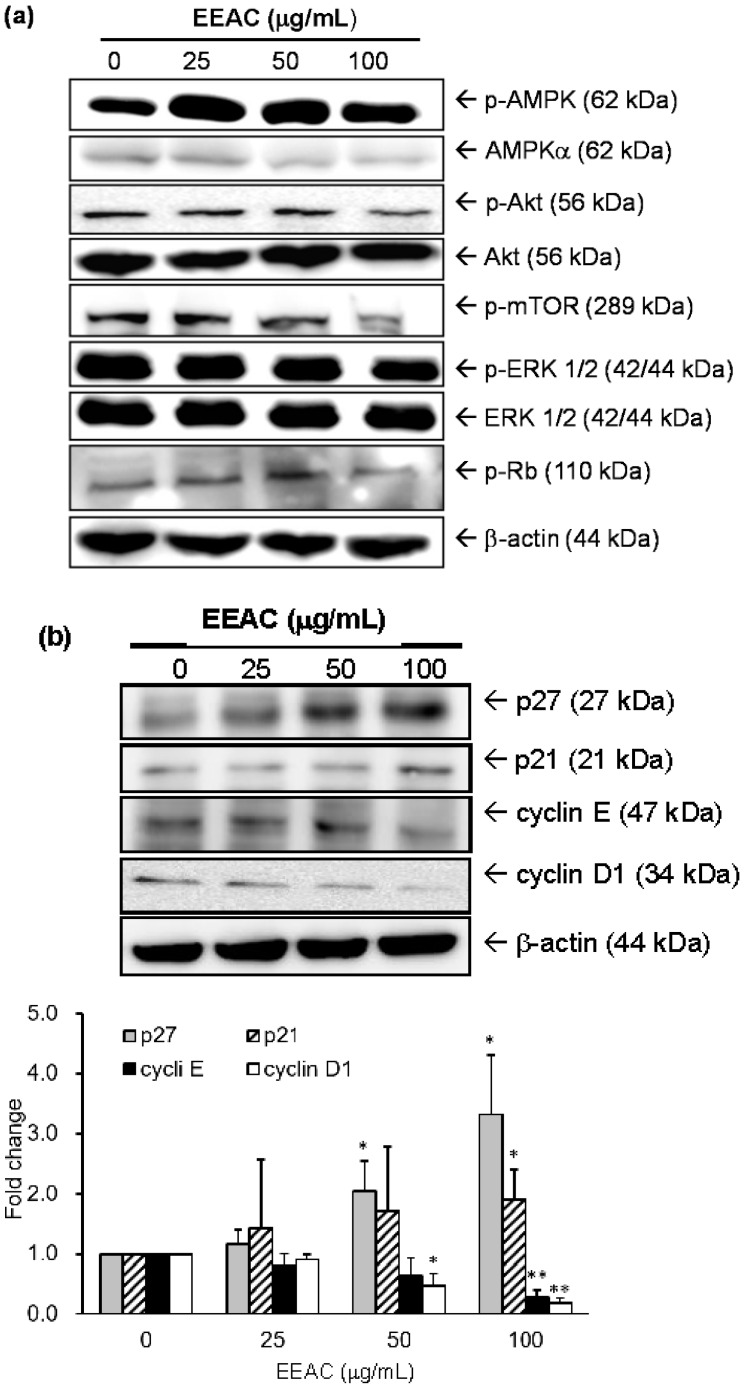
Figure 2
Effect of EEAC on cell…
Figure 2
Effect of EEAC on cell growth-associated proteins in A549 cells. Cells were treated…
Figure 2 Effect of EEAC on cell growth-associated proteins in A549 cells. Cells were treated with several concentrations of EEAC for 30 min to examine the expression and/or activation levels of AMPKα, Akt, mTOR, and ERK1/2 (a). Each value represents the average of three independent experiments in Table 1. Protein expressions of p21, p27, cyclin D1 and cyclin E were incubated with the indicated concentrations of EEAC for 24 h (b), and fold changes of individual proteins were shown as a histogram. * p < 0.05 and ** p < 0.01 compared to the control group (treated with vehicle alone), respectively.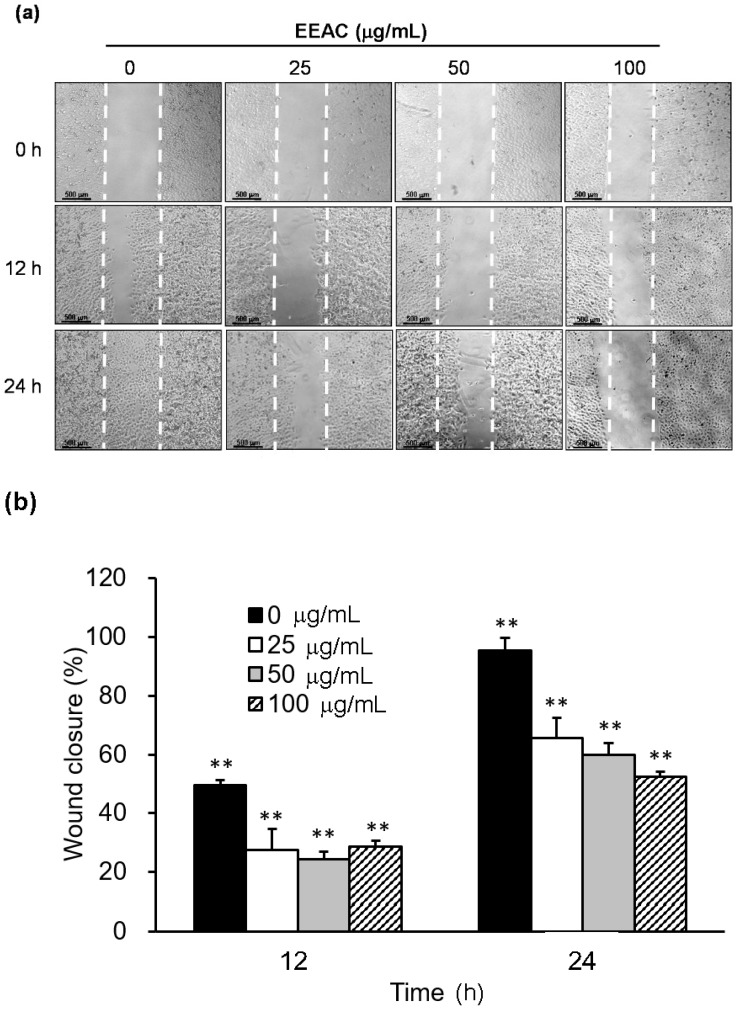
Figure 3
Inhibition of cell migration by…
Figure 3
Inhibition of cell migration by EEAC in A549 cells. Cells were stimulated with…
Figure 3 Inhibition of cell migration by EEAC in A549 cells. Cells were stimulated with 10% FBS to induce cell migration and co-incubated with various concentrations of EEAC. The pictures were acquired after 0, 12 and 24 h treatment of EEAC (a). Migration inhibition was presented as the percentage of wound closure by calculating the cell-free gap of each group compared to those at initial time (b). ** p < 0.01 compared to those of individual group at initial time.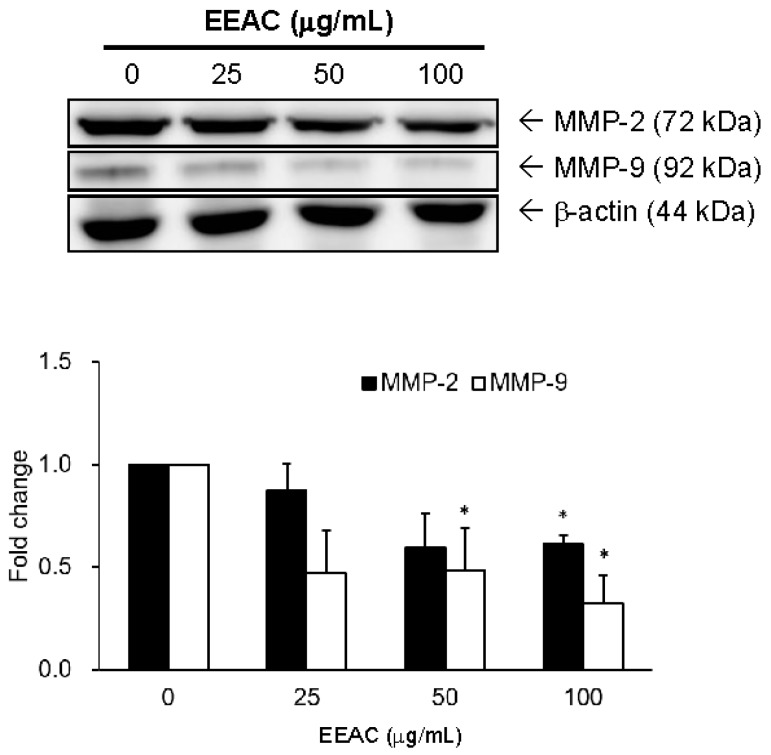
Figure 4
Suppression effect of EEAC on…
Figure 4
Suppression effect of EEAC on gelatinases in A549 cells. The expression levels of…
Figure 4 Suppression effect of EEAC on gelatinases in A549 cells. The expression levels of gelatinases, MMP-2 and MMP-9, were examined in A549 cells incubated with various concentrations of EEAC for 24 h. The band intensities of each group were quantified and normalized to the control group, and the relative expressions of gelatinases were presented as fold change in a histogram. * p < 0.05 compared to the control group (treated with vehicle alone).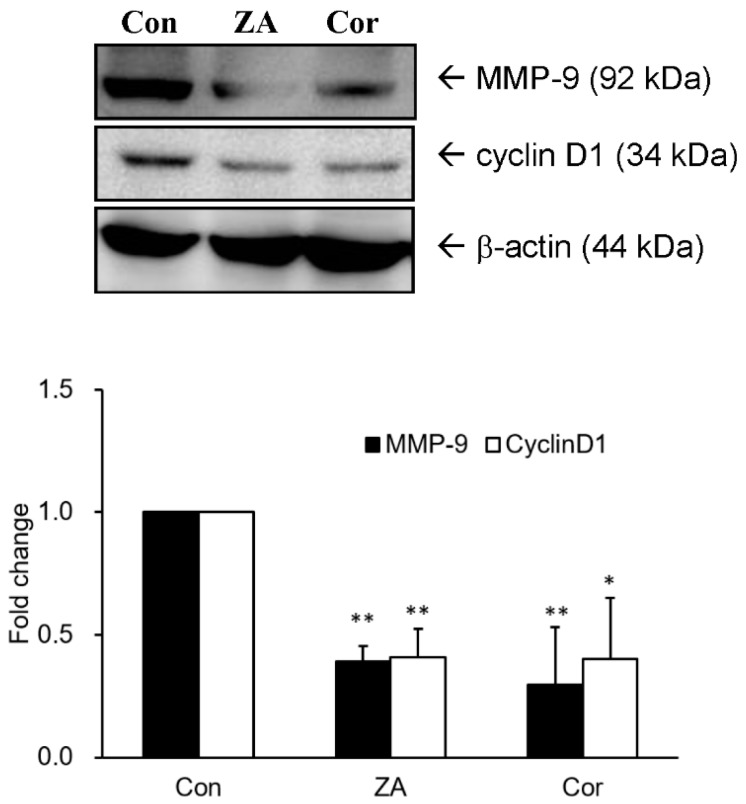
Figure 5
Effects of zhankuic acid A…
Figure 5
Effects of zhankuic acid A and cordycepin on the protein expressions of cyclin…
Figure 5 Effects of zhankuic acid A and cordycepin on the protein expressions of cyclin D1 and MMP-9 in A549 cells. The expression levels of cyclin D1 and MMP-9 were examined in A549 cells incubated with zhankuic acid A or cordycepin for 24 h. The band intensities of each group were quantified and normalized to the control group, and the relative expressions of gelatinases were presented as fold change in a histogram. * p < 0.05 and ** p < 0.01 compared to the control group (treated with vehicle alone), respectively. Con, control; ZA, zhankuic acid A; Cor, cordycepin.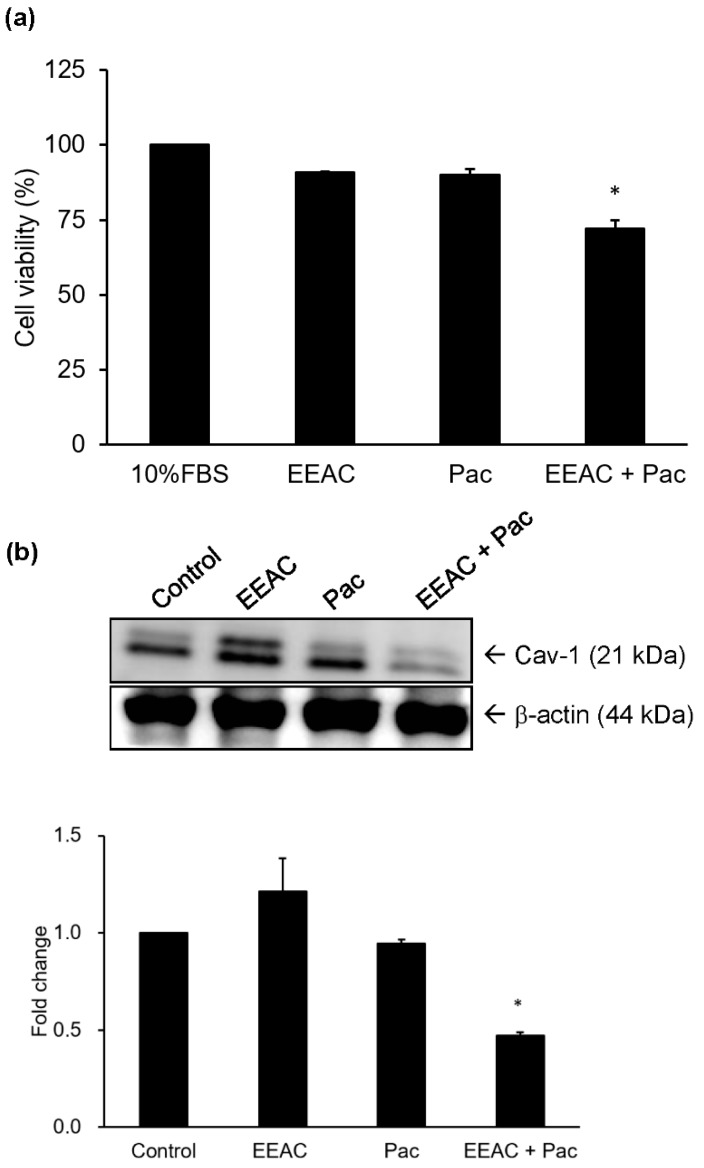
Figure 6
EEAC enhanced chemosensitivity of A549…
Figure 6
EEAC enhanced chemosensitivity of A549 cell to paclitaxel. Cells were incubated with EEAC…
Figure 6 EEAC enhanced chemosensitivity of A549 cell to paclitaxel. Cells were incubated with EEAC (6.25 μg/mL), paclitaxel (0.156 μM; Pac) or EEAC combined with paclitaxel for 24 h to examine the change of cell viability (a). Under the same experimental condition, the expression level of cav-1 protein was examined using Western blot (b). The band intensities of each group were quantified and normalized to the control group, and the relative expression of cav-1 protein was presented as fold change in a histogram. * indicates p < 0.05 as compared with paclitaxel alone group. Pac, paclitaxel; Cav-1, caveolin-1.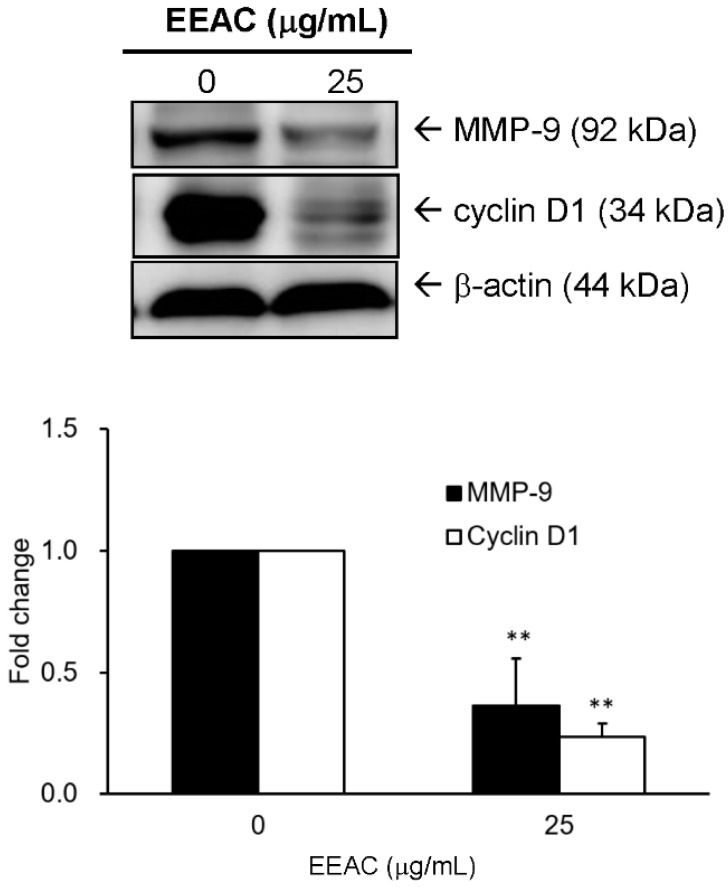
Figure 7
Effect of EEAC on cyclin…
Figure 7
Effect of EEAC on cyclin D1 and MMP-9 expressions in LLC cells. Cells…
Figure 7 Effect of EEAC on cyclin D1 and MMP-9 expressions in LLC cells. Cells were incubated with 25 μg/mL EEAC for 24 h to analyze translational levels of cyclin D1 and MMP-9 proteins. The band intensities of each group were quantified and normalized to the control group (treated with vehicle alone), and the relative expressions of detected proteins were presented as fold change in a histogram. ** indicates p <0.01 as compared with control group, respectively.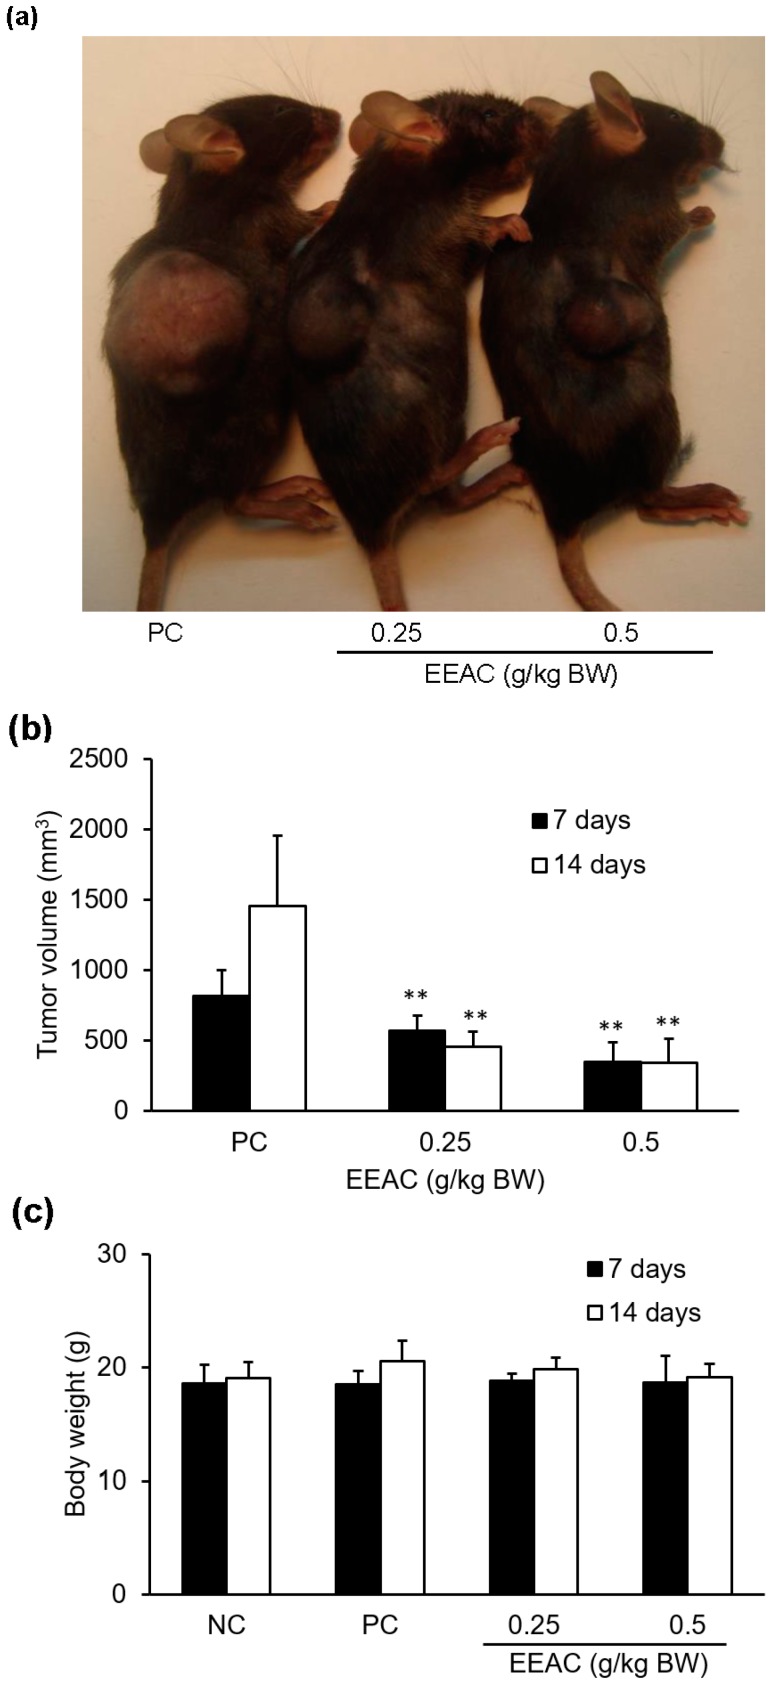
Figure 8
EEAC inhibited tumor growth in…
Figure 8
EEAC inhibited tumor growth in the Lewis lung carcinoma allograft model. The tumor…
Figure 8 EEAC inhibited tumor growth in the Lewis lung carcinoma allograft model. The tumor tissue denoted by a dashed line was photographed at the end of the study. (a) Tumor volume (b) and bodyweight (c) of each group are shown as a histogram. NC: normal control, PC: LLC group. ** p < 0.01 compared to the PC group (treated with vehicle alone). All figures (8)