Renoprotective Effects of Solid-State Cultivated Antrodia cinnamomea in Juvenile Rats with Chronic Kidney Disease
Abstract
Antrodia cinnamomea (AC), a medicinal mushroom, has multiple beneficial actions, such as acting as a prebiotic. The incidence of chronic kidney disease (CKD) in children has steadily increased year by year, and CKD is related to gut microbiota dysbiosis. Herein, we investigated the renoprotection of solid-state cultivated AC in adenine-induced CKD juvenile rats. CKD was induced in 3-week-old male rats by feeding with adenine (0.5%) for three weeks. Treated groups received oral administration of AC extracts at either a low (10 mg/kg/day) or high dose (100 mg/kg/day) for six weeks. At nine weeks of age, the rats were sacrificed. Renal outcomes, blood pressure, and gut microbiome composition were examined. Our results revealed that AC treatment, either low- or high-dose, improved kidney function, proteinuria, and hypertension in CKD rats. Low-dose AC treatment increased plasma concentrations of short-chain fatty acids (SCFAs). Additionally, we observed that AC acts like a prebiotic by enriching beneficial bacteria in the gut, such as Akkermansia and Turicibacter. Moreover, the beneficial action of AC against CKD-related hypertension might also be linked to the inhibition of the renin-angiotensin system. This study brings new insights into the potential application of AC as a prebiotic dietary supplement in the prevention and treatment of pediatric CKD.
Figures 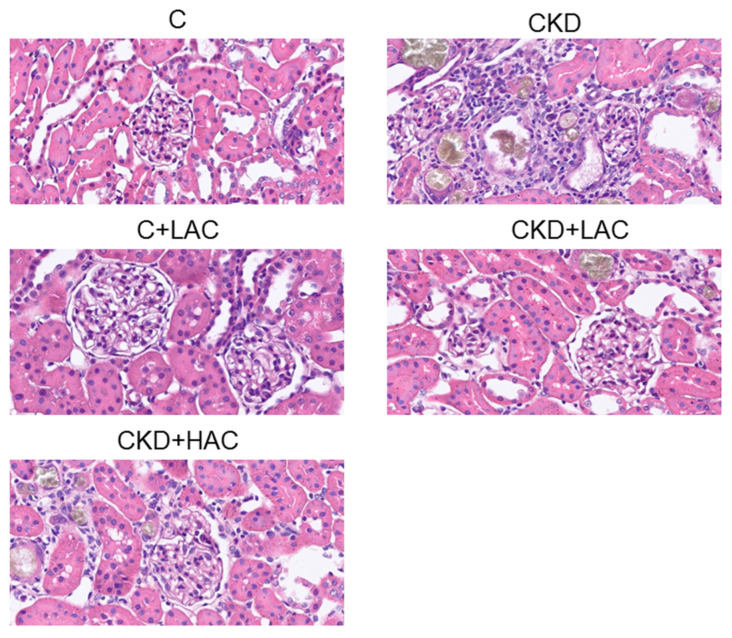
Figure 1
Representative hematoxylin and eosin (H&E)…
Figure 1
Representative hematoxylin and eosin (H&E) staining of kidney tissue from rats at 9…
Figure 1 Representative hematoxylin and eosin (H&E) staining of kidney tissue from rats at 9 weeks of age.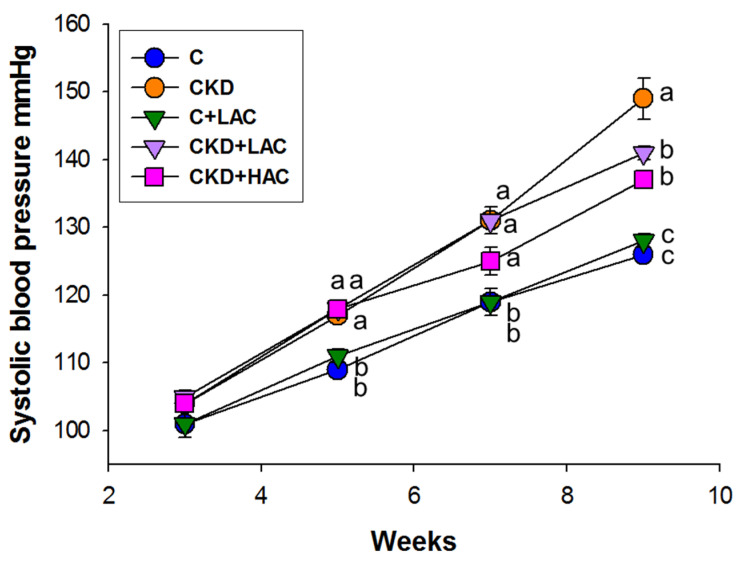
Figure 2
Systolic blood pressure at age…
Figure 2
Systolic blood pressure at age 3 to 9 weeks. N = 7–8/group; statistical…
Figure 2 Systolic blood pressure at age 3 to 9 weeks. N = 7–8/group; statistical analysis by one-way ANOVA, p < 0.05. Letters represent the differences between groups.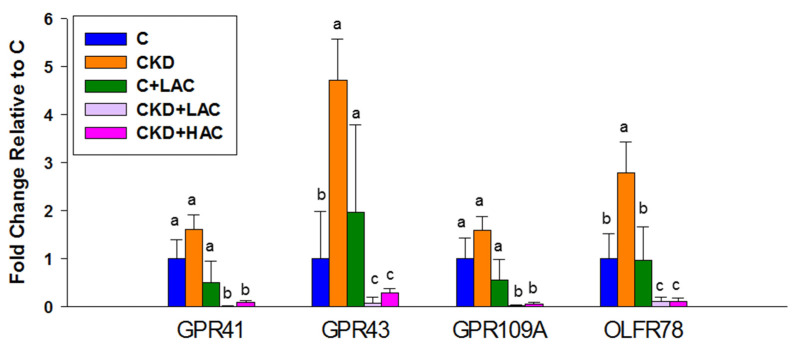
Figure 3
Renal gene expression of G…
Figure 3
Renal gene expression of G protein-coupled receptor 41 (GPR41), GPR43, GPR109A, and olfactory…
Figure 3 Renal gene expression of G protein-coupled receptor 41 (GPR41), GPR43, GPR109A, and olfactory receptor 78 (OFLR78) of rats at age 9 weeks. N = 7–8/group. Letters represent the differences between groups.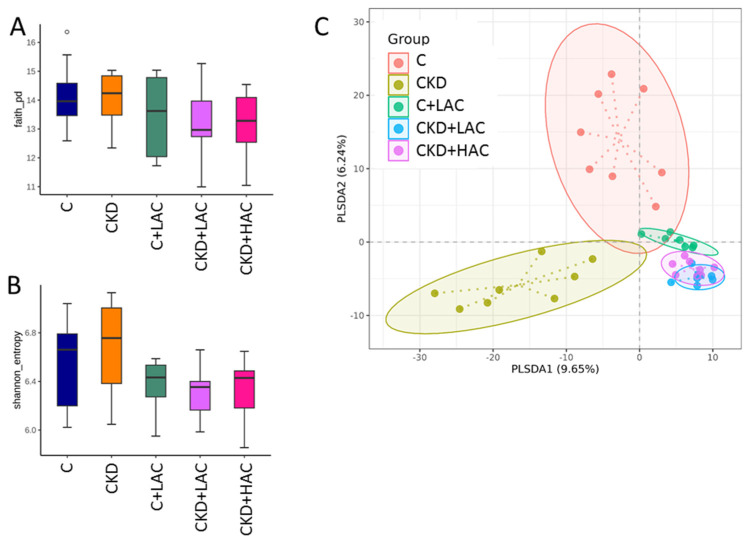
Figure 4
The two metrics of α-diversity:…
Figure 4
The two metrics of α-diversity: ( A ) Faith’s phylogenetic diversity (PD) index…
Figure 4 The two metrics of α-diversity: (A) Faith’s phylogenetic diversity (PD) index and (B) Shannon index are presented. (C) β-diversity analysis using partial least squares discriminant analysis (PLS-DA). Each dot is a sample, and the dot color represents the grouping for that sample. N = 7–8/group.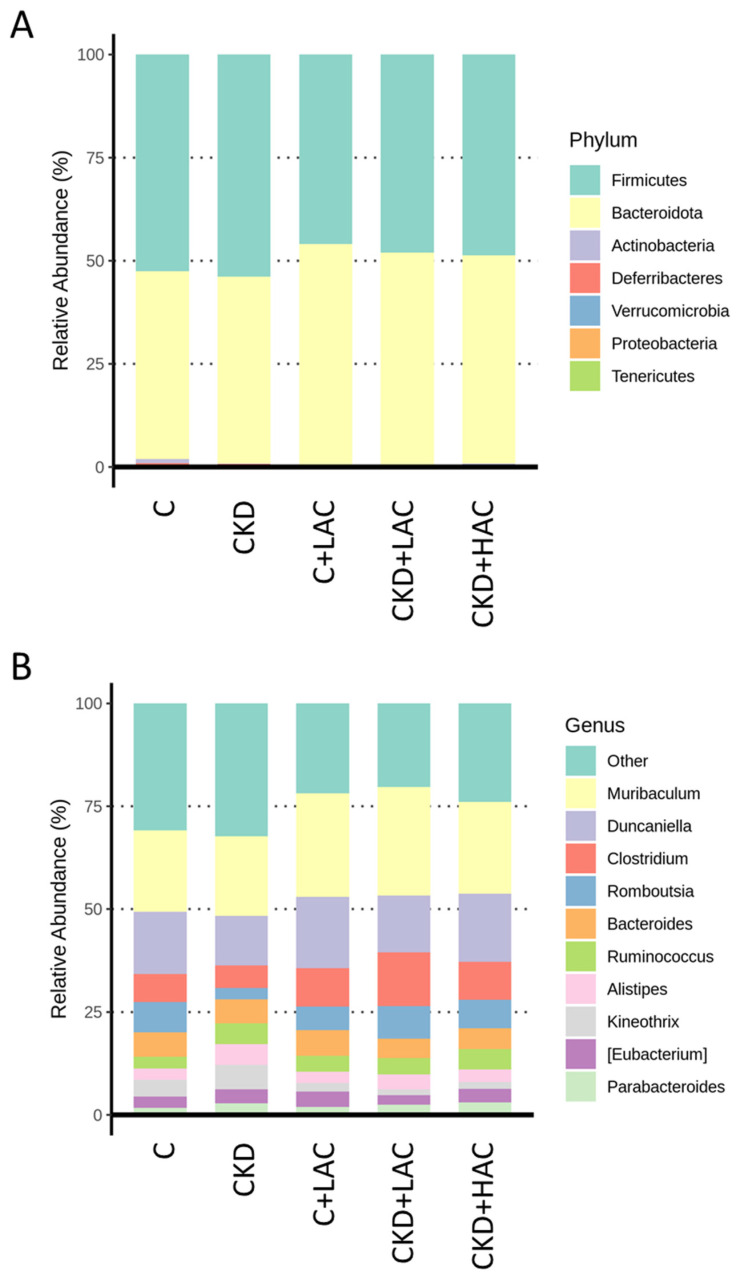
Figure 5
Relative abundance of dominant intestinal…
Figure 5
Relative abundance of dominant intestinal microflora in rats at ( A ) phylum…
Figure 5 Relative abundance of dominant intestinal microflora in rats at (A) phylum and (B) genus levels.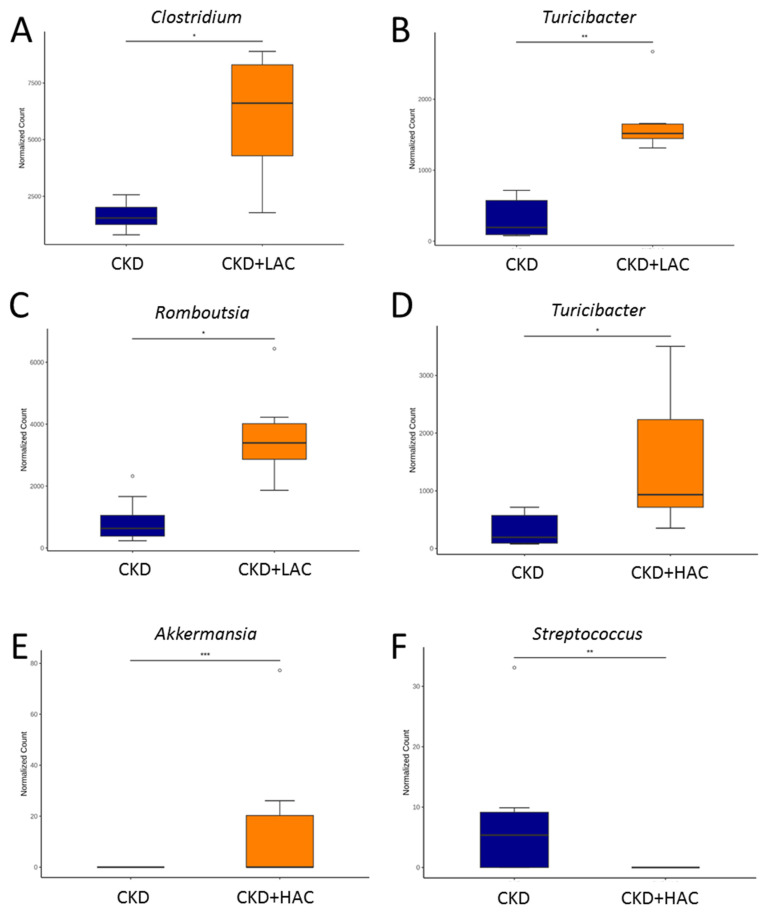
Figure 6
The comparison of the genera…
Figure 6
The comparison of the genera ( A ) Clostridium , ( B )…
Figure 6 The comparison of the genera (A) Clostridium, (B) Turicibacter, and (C) Romboutsia between the CKD group and CKD + LAC group. The comparison of the genera (D) Turicibacter, (E) Akkermansia, and (F) Streptococcus between the CKD group and CKD + HAC group. N = 7–8/group. The outliers are shown as dots. * p < 0.05; ** p < 0.01; *** p < 0.005.
Figure 7
Linear discriminant analysis effect size…
Figure 7
Linear discriminant analysis effect size (LEfSe) analyzed differentially abundant microbiota between five different…
Figure 7 Linear discriminant analysis effect size (LEfSe) analyzed differentially abundant microbiota between five different groups. The threshold of linear discriminant analysis (LDA) score was set as 4.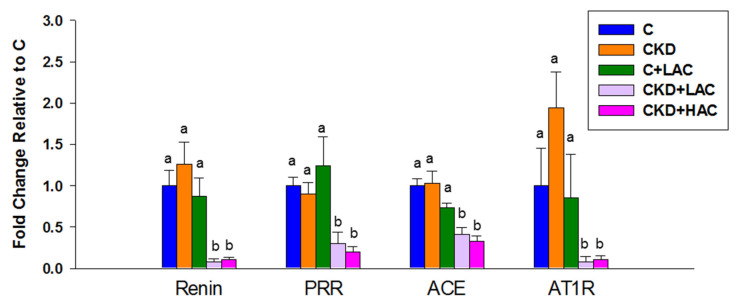
Figure 8
Renal gene expression of the…
Figure 8
Renal gene expression of the renin-angiotensin system of rats at age 9 weeks,…
Figure 8 Renal gene expression of the renin-angiotensin system of rats at age 9 weeks, containing renin, (pro)renin receptor (PRR), angiotensin converting enzyme (ACE), and angiotensin II type 1 receptor (AT1R). N = 7–8/group. Statistical analysis by one-way ANOVA, p < 0.05. Letters represent the differences between groups. All figures (8)