Protective Effect of Antrodia cinnamomea Extract against Irradiation-Induced Acute Hepatitis
Abstract
Radiotherapy for treatment of hepatocellular carcinoma causes severe side effects, including acute hepatitis and chronic fibrosis. Complementary and alternative medicine (CAM) has emerged as an important part of integrative medicine in the management of diseases. Antrodia cinnamomea (AC), a valuable medicinal fungus originally found only in Taiwan, has been shown to possess anti-oxidation, vaso-relaxtation, anti-inflammation, anti-hepatitis, and anti-cancer effects. In this paper we evaluate the protective effects of ethanol extract of Antrodia cinnamomea (ACE) against radiotoxicity both in normal liver cell line CL48 and in tumor-bearing mice. In CL48, ACE protects cells by eliminating irradiation-induced reactive oxygen species (ROS) through the induction of Nrf2 and the downstream redox system enzymes. The protective effect of ACE was also demonstrated in tumor-bearing mice by alleviating irradiation-induced acute hepatitis. ACE could also protect mice from CCl₄-induced hepatitis. Since both radiation and CCl₄ cause free radicals, these results indicate that ACE likely contains active components that protect normal liver cells from free radical attack and can potentially benefit hepatocellular carcinoma (HCC) patients during radiotherapy.
Figures 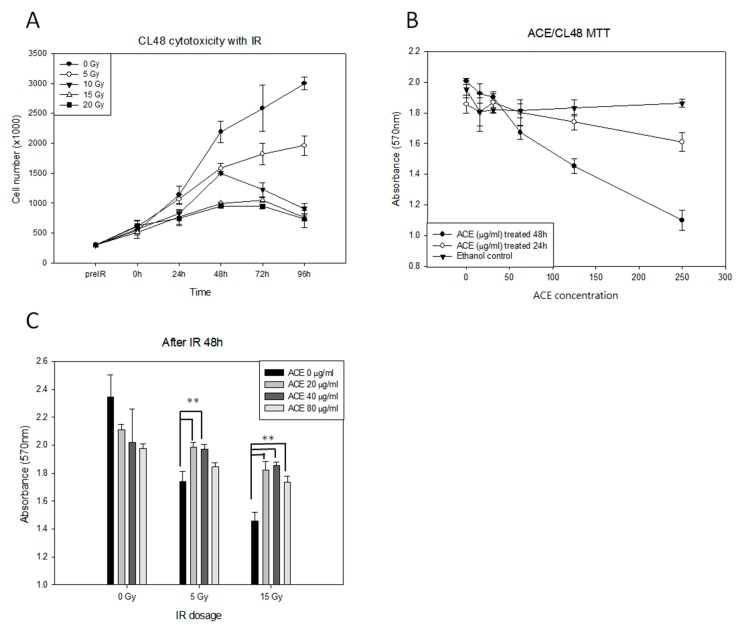
Figure 1
The protective effects of Antrodia…
Figure 1
The protective effects of Antrodia cinnamomea extract (ACE) against irradiation in human normal…
Figure 1 The protective effects of Antrodia cinnamomea extract (ACE) against irradiation in human normal liver CL48 cells. (A) Cytotoxicity of irradiation in CL48. Cells were treated with different dosages (0, 5, 10, 15, and 20 Gy) of irradiation and counted by hemocytometer at intervals as indicated. (B) Determination of the optimal ACE dosages. Cells were treated with different concentrations of ACE for 24 h or 48 h, followed by 3-(4,5-dimethylthiazol-2-yl)-2,5-diphenyltetrazolium bromide (MTT) assay for cell survival. For the control group, the same concentrations of ethanol were used for each ACE treatment experiment. (C) The protective effect of ACE against irradiation. Cells were pre-treated with different concentrations of ACE for 16 h followed by various dosages of irradiation; they were evaluated by MTT assay 48 h later. Cell survival was evaluated by MTT assay. Results were obtained from three independent experiments; each experiment was done in triplicate. **, p < 0.01, as compared with the control group.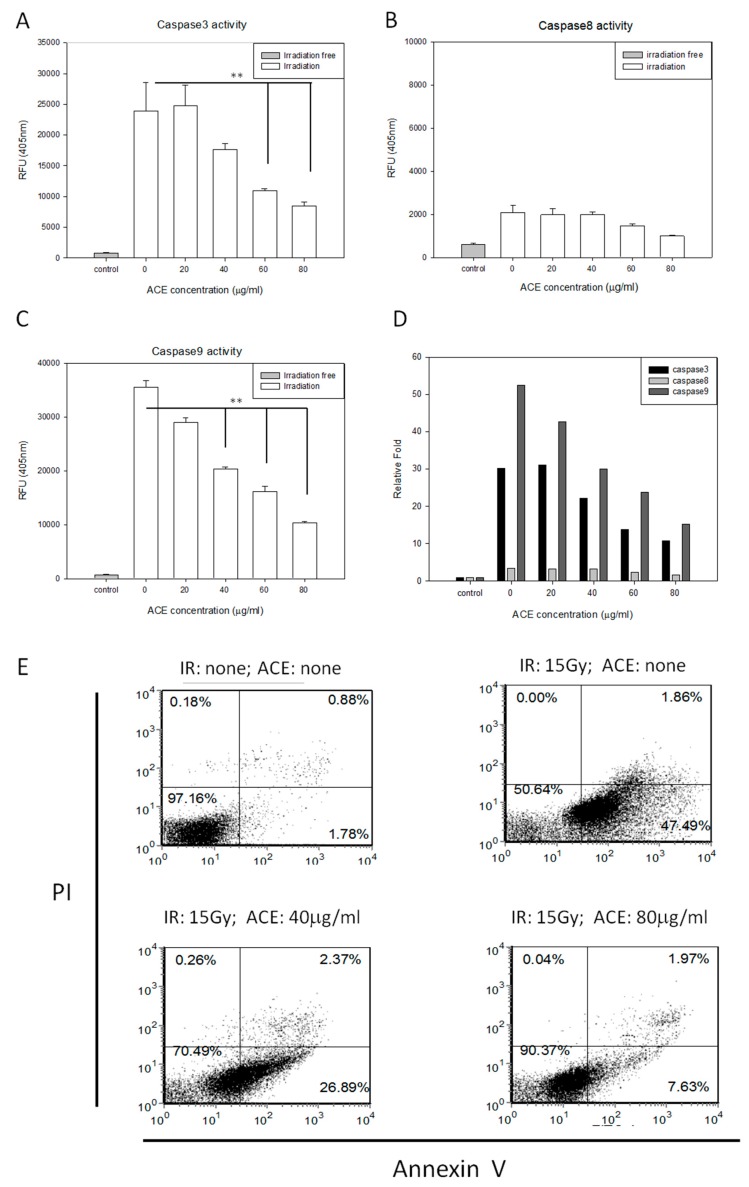
Figure 2
Protective effects of ACE against…
Figure 2
Protective effects of ACE against irradiation-induced apoptosis. CL48 cells were pre-treated with various…
Figure 2 Protective effects of ACE against irradiation-induced apoptosis. CL48 cells were pre-treated with various concentrations of ACE for 16 h followed by irradiation at 15 Gy. Cells were harvested 48 h later for determination of caspase-3 activity (A), caspase-8 activity (B), and caspase-9 activity (C). The fold differences of the three caspase activities relative to individual control groups were also presented (D). For apoptosis analysis, cells were harvested 30 h after treatment followed by staining with PI and Annexin V (E). Results are representative of three independent experiments. The statistical analysis of the percentages of early plus late apoptotic cells (F). *, p < 0.05; **, p < 0.01, as compared with the irradiated ACE 0 μg/mL control group.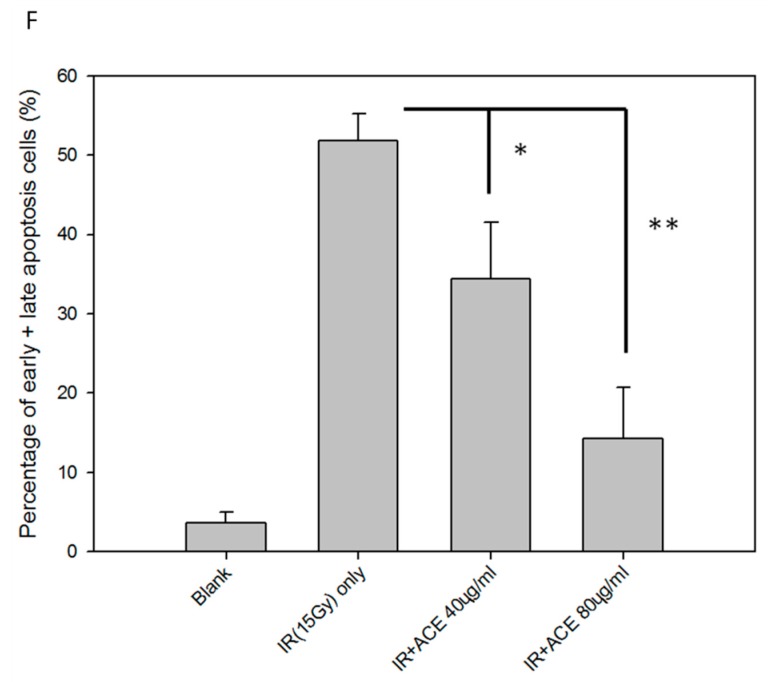
Figure 2
Protective effects of ACE against…
Figure 2
Protective effects of ACE against irradiation-induced apoptosis. CL48 cells were pre-treated with various…
Figure 2 Protective effects of ACE against irradiation-induced apoptosis. CL48 cells were pre-treated with various concentrations of ACE for 16 h followed by irradiation at 15 Gy. Cells were harvested 48 h later for determination of caspase-3 activity (A), caspase-8 activity (B), and caspase-9 activity (C). The fold differences of the three caspase activities relative to individual control groups were also presented (D). For apoptosis analysis, cells were harvested 30 h after treatment followed by staining with PI and Annexin V (E). Results are representative of three independent experiments. The statistical analysis of the percentages of early plus late apoptotic cells (F). *, p < 0.05; **, p < 0.01, as compared with the irradiated ACE 0 μg/mL control group.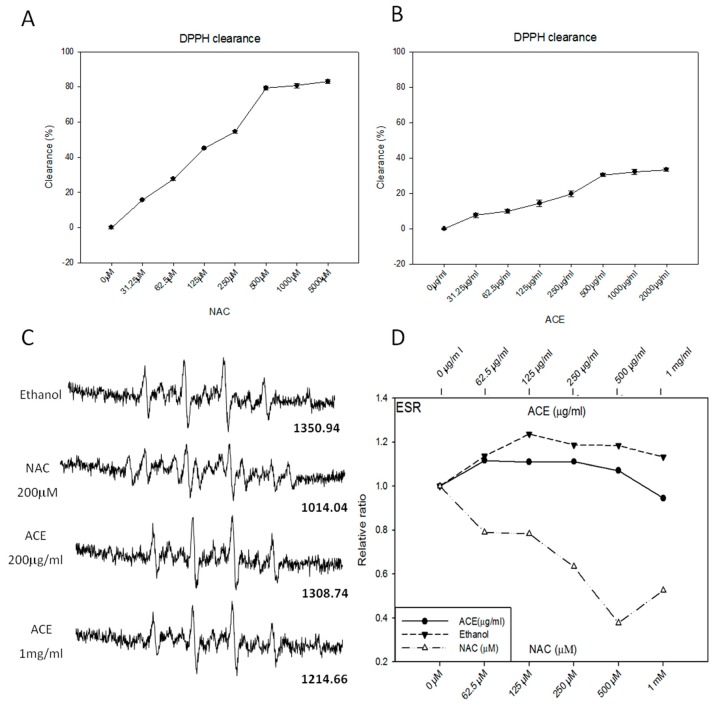
Figure 3
Examination of direct free radical-scavenging…
Figure 3
Examination of direct free radical-scavenging activities of ACE. DPPH free radical-scavenging activity of…
Figure 3 Examination of direct free radical-scavenging activities of ACE. DPPH free radical-scavenging activity of N-acetyl-l-cysteine (NAC) (A) and ACE (B) were analyzed. Results were obtained from three independent experiments, each experiment was done in triplicate. The ESR spectra of 5,5-dimethyl-1-pyrroline-N-oxide (DMPO) in phosphate buffered saline (PBS) were measured in the presence or absence of ACE or (N-acetyl-l-cysteine) (NAC) (200 μM) (C) and plotted and compared in a dose-dependent manner (D).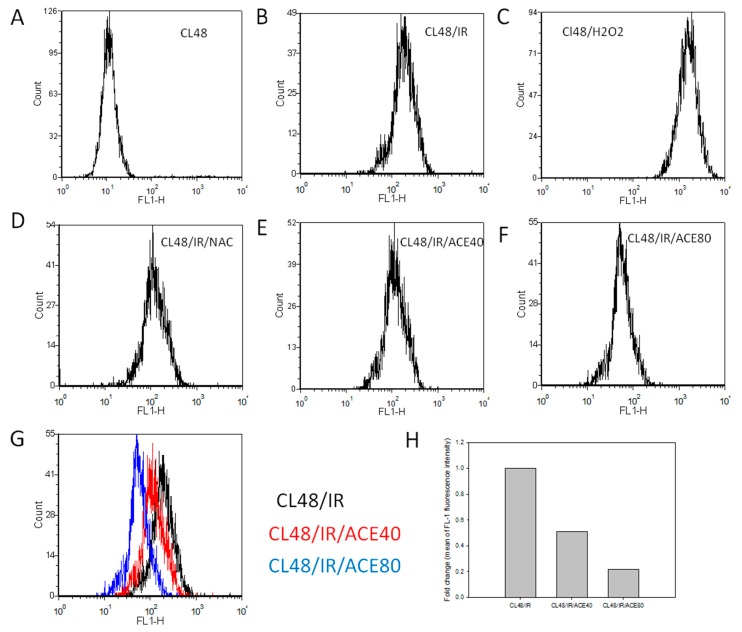
Figure 4
Reactive oxygen species (ROS) scavenging…
Figure 4
Reactive oxygen species (ROS) scavenging activity of ACE in CL48 cells. After being…
Figure 4 Reactive oxygen species (ROS) scavenging activity of ACE in CL48 cells. After being treated and harvested as described in the Materials and Methods section, cells were analyzed by flowcytometry after incubation with 2′,7′-dichlorofluorescin diacetate (DCFH-DA) for 15 min. (A) Control cells without treatment, (B) IR treated only, (C) H2O2 treated only, (D) pre-treated with NAC before IR, (E) pre-treated with ACE 40 μg/mL before IR, (F) pre-treated with ACE 80 μg/mL before IR. (G) Histograms of B, E, and F were combined to show the dose-dependent ROS scavenging activity of ACE. (H) Fold change of control fluorescence intensity by 40 μg/mL and 80 μg/mL of ACE, respectively.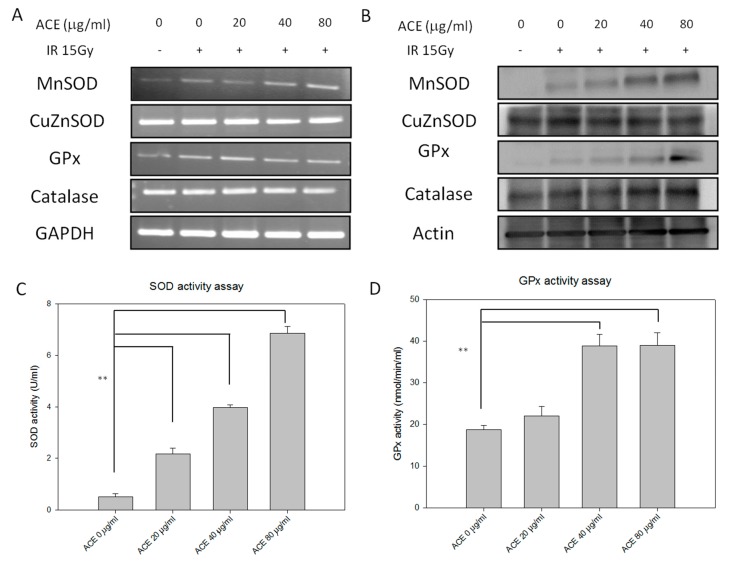
Figure 5
Redox-related enzymes expression and activity…
Figure 5
Redox-related enzymes expression and activity profiles of CL48 hepatocytes after IR and/or ACE…
Figure 5 Redox-related enzymes expression and activity profiles of CL48 hepatocytes after IR and/or ACE treatments. With or without ACE pre-treatment for 16 h, cells were irradiated with a dose of 15 Gy and harvested 24 h later for RT-PCR (A), Western blot (B), total superoxide dismutase (SOD) activity (C), and glutathione peroxidase (GPx) activity (D) analyses. Results were obtained from three independent experiments, each experiment was done in triplicate. **, p < 0.01, as compared with the control IR only group.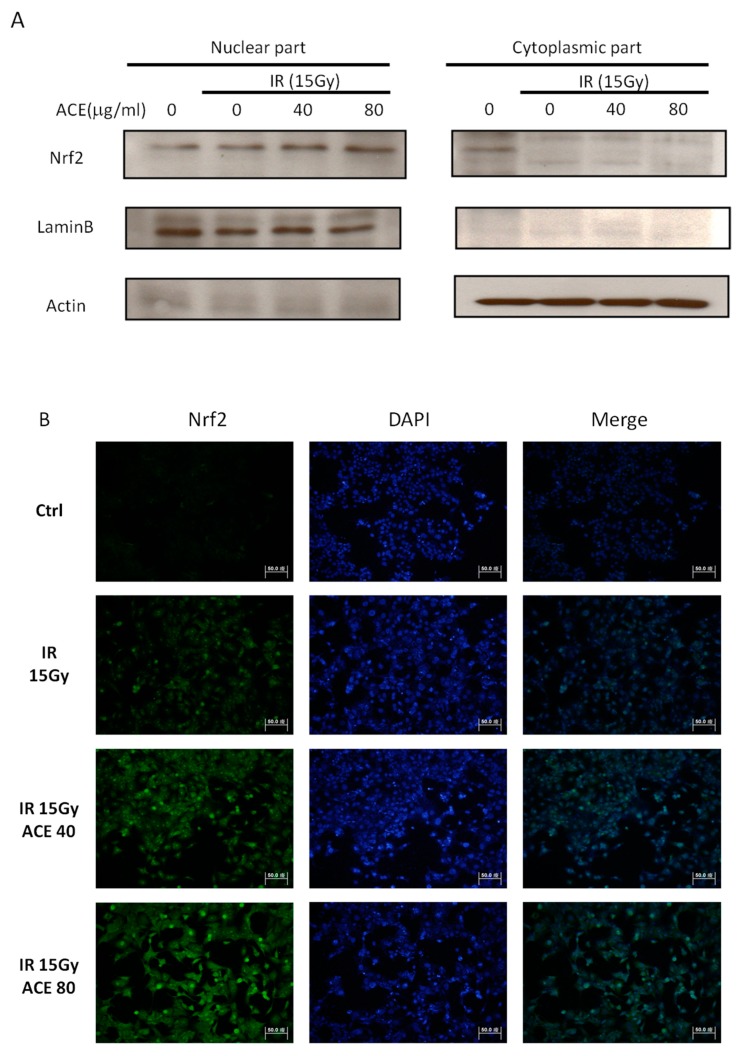
Figure 6
Enhancement of the irradiation-induced nuclear…
Figure 6
Enhancement of the irradiation-induced nuclear factor erythroid-2-related factor (Nrf2) expression and nuclear translocation…
Figure 6 Enhancement of the irradiation-induced nuclear factor erythroid-2-related factor (Nrf2) expression and nuclear translocation by ACE treatment. With or without ACE pre-treatment for 16 h, CL48 cells were irradiated with a dose of 15 Gy and harvested 24 h later for Western blot (A) and immunofluorescence staining (B, left) of Nrf2. The slides were counterstained with 4′,6-diamidino-2-phenylindole (DAPI) (300 nM in PBS) (B, middle) and merged images (B, right). (C) The nuclear Nrf2 positivity rates were plotted. Results were obtained from random fields of three independent experiments for each group. *, p < 0.05; **, p < 0.01, as compared with the IR only group.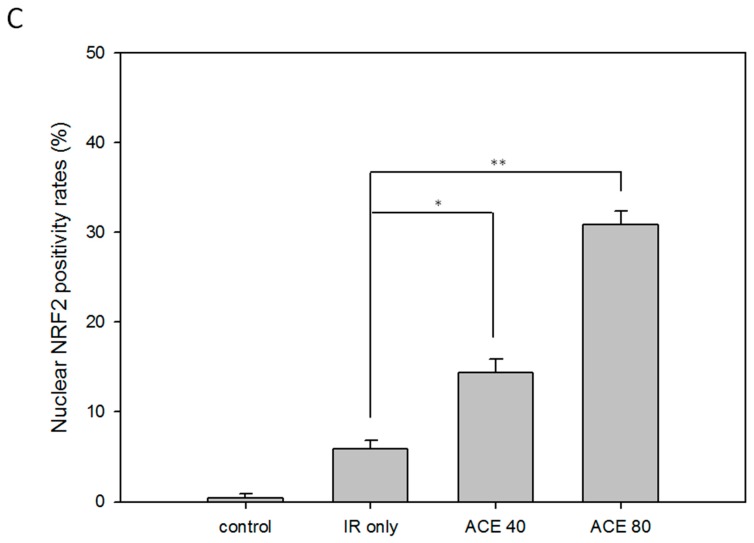
Figure 6
Enhancement of the irradiation-induced nuclear…
Figure 6
Enhancement of the irradiation-induced nuclear factor erythroid-2-related factor (Nrf2) expression and nuclear translocation…
Figure 6 Enhancement of the irradiation-induced nuclear factor erythroid-2-related factor (Nrf2) expression and nuclear translocation by ACE treatment. With or without ACE pre-treatment for 16 h, CL48 cells were irradiated with a dose of 15 Gy and harvested 24 h later for Western blot (A) and immunofluorescence staining (B, left) of Nrf2. The slides were counterstained with 4′,6-diamidino-2-phenylindole (DAPI) (300 nM in PBS) (B, middle) and merged images (B, right). (C) The nuclear Nrf2 positivity rates were plotted. Results were obtained from random fields of three independent experiments for each group. *, p < 0.05; **, p < 0.01, as compared with the IR only group.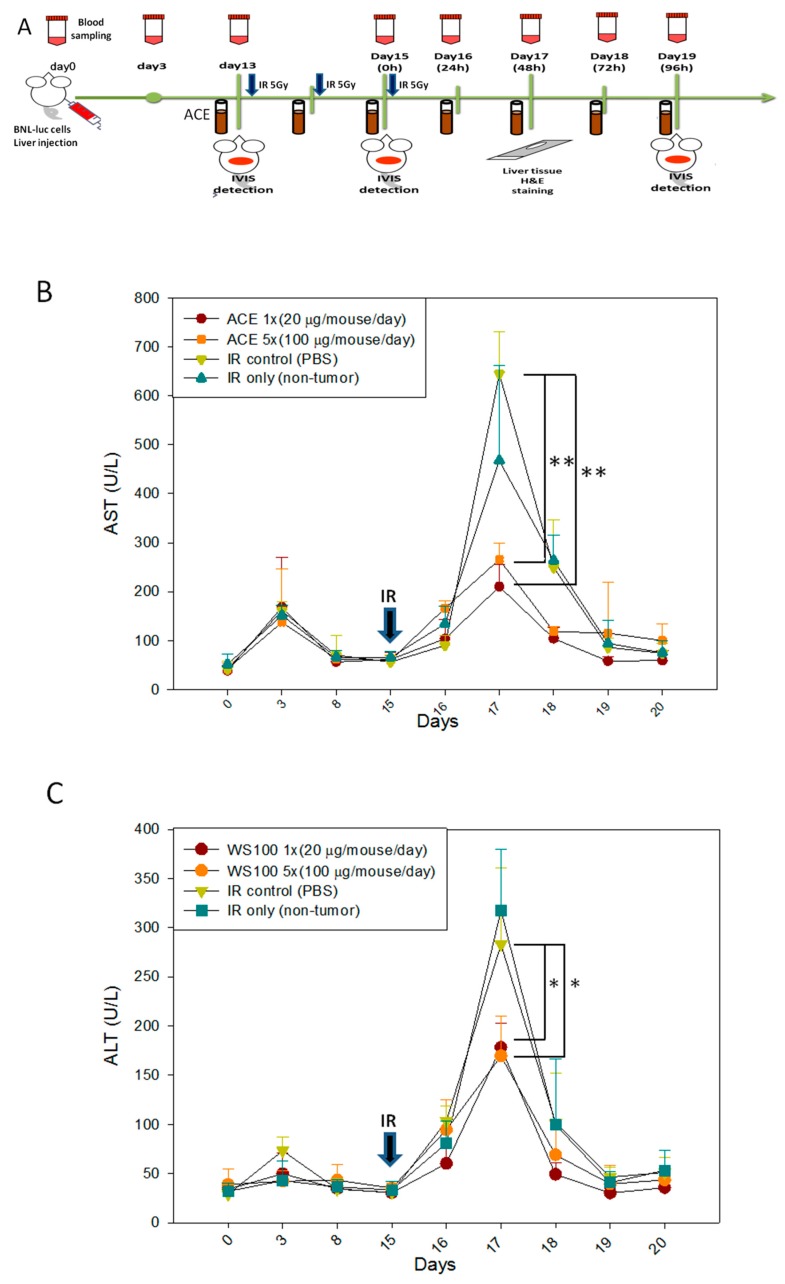
Figure 7
ACE alleviated the acute hepatitis…
Figure 7
ACE alleviated the acute hepatitis markers in irradiated induces acute liver damage. (…
Figure 7 ACE alleviated the acute hepatitis markers in irradiated induces acute liver damage. (A) Scheme of the orthotropic hepatoma bearing mice model experiments. 48 h after irradiation, serum samples were collected every 24 h for monitoring the hepatitis markers aspartate transaminase (AST) (B) and alanine transaminase (ALT) (C). Liver tissues were harvested 96 h, upon sacrifice, and haematoxylin and eosin (H&E) stained for morphological detection of hepatic inflammation extent (the areas within black lines and marked with asterisks) (D) and Immunohistochemical (IHC) stained for Nrf2 detection (E). (F) The nuclear Nrf2 positivity rates were plotted. Results were obtained from random fields of three mice liver tissue sections for each group. *, p < 0.05; **, p < 0.01, as compared with the IR15Gy group.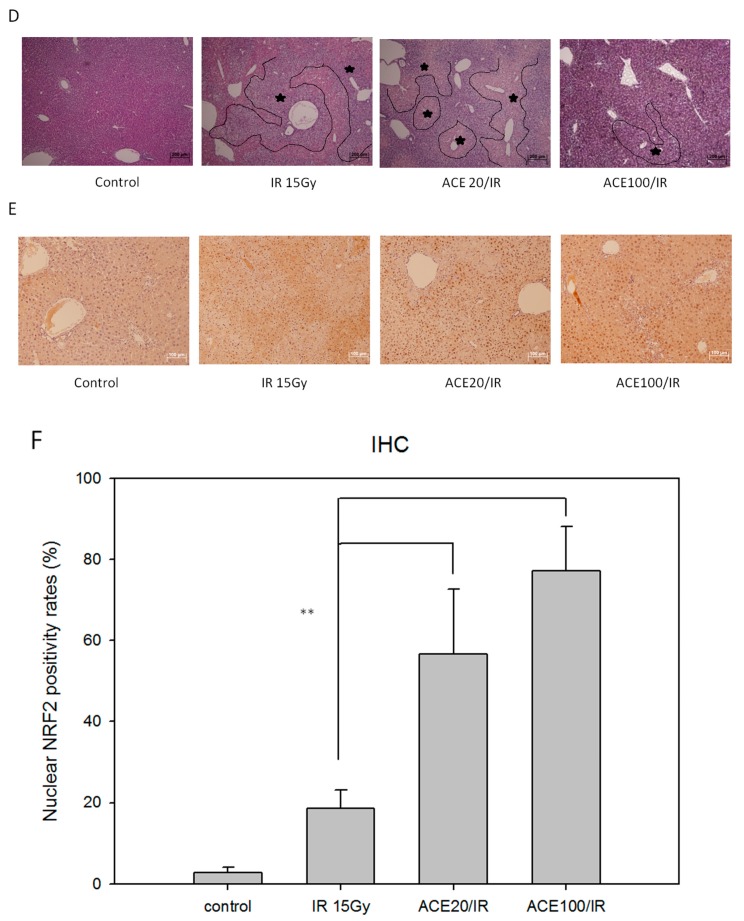
Figure 7
ACE alleviated the acute hepatitis…
Figure 7
ACE alleviated the acute hepatitis markers in irradiated induces acute liver damage. (…
Figure 7 ACE alleviated the acute hepatitis markers in irradiated induces acute liver damage. (A) Scheme of the orthotropic hepatoma bearing mice model experiments. 48 h after irradiation, serum samples were collected every 24 h for monitoring the hepatitis markers aspartate transaminase (AST) (B) and alanine transaminase (ALT) (C). Liver tissues were harvested 96 h, upon sacrifice, and haematoxylin and eosin (H&E) stained for morphological detection of hepatic inflammation extent (the areas within black lines and marked with asterisks) (D) and Immunohistochemical (IHC) stained for Nrf2 detection (E). (F) The nuclear Nrf2 positivity rates were plotted. Results were obtained from random fields of three mice liver tissue sections for each group. *, p < 0.05; **, p < 0.01, as compared with the IR15Gy group. All figures (10)