Metabolomic Profiling of Different Antrodia cinnamomea Phenotypes
Abstract
Antrodia cinnamomea (AC) is a precious medicinal fungus with numerous therapeutic benefits. Based on the color appearance of its fruiting bodies, AC can be divided into red AC (RAC), yellow AC (YAC), and white AC (WAC); however, the differences in their metabolomic profiles remain unknown. This study aimed to analyze the metabolomic profiles of three different AC phenotypes and examine their relationship to the color appearance of fruiting bodies. The results showed that although RAC, YAC, and WAC appear to have a relatively similar profile of index triterpenoids, their total triterpenoid contents were significantly different. Among the annotated triterpenoids, many of them were highly present in RAC but not in YAC and WAC, and the relative contents of the four ergostanes (antcamphin F, antcamphin L, antcin B, and antcin K) and one lanostane (versisponic acid D) were found to be significantly different among AC phenotypes. The metabolomic profiles of the AC fruiting bodies demonstrated a total of 140 metabolites, and 41 of them were very different among AC phenotypes. This study indicates that red, yellow, and white AC can biosynthesize the diverse structures of triterpenoids, and RAC possesses a relatively higher contents of triterpenoids and diverse unannotated metabolites than YAC and WAC.
Figures 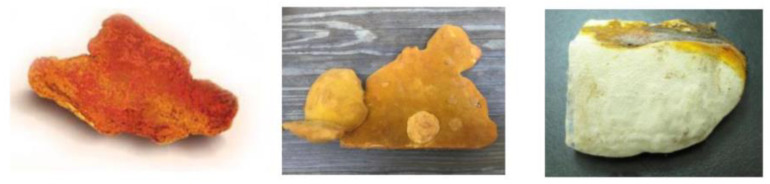
Figure 1
The appearance of fruiting bodies…
Figure 1
The appearance of fruiting bodies of different A. cinnamomea phenotypes. The images from…
Figure 1 The appearance of fruiting bodies of different A. cinnamomea phenotypes. The images from left to right are red AC, yellow AC, and white AC.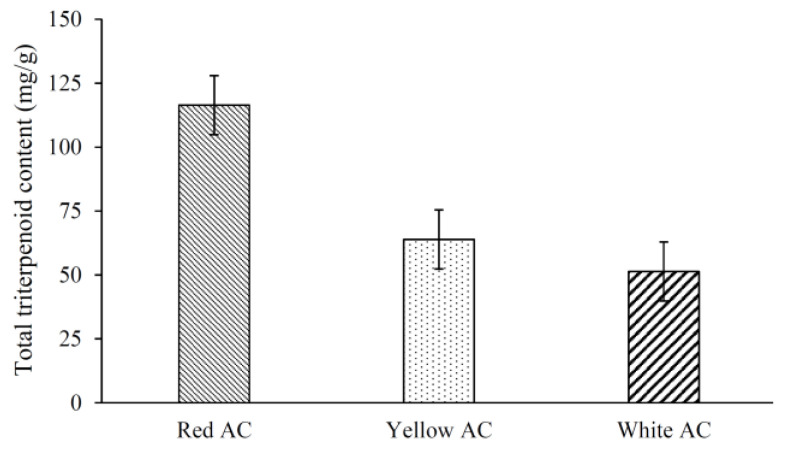
Figure 2
Total triterpenoid contents in fruiting…
Figure 2
Total triterpenoid contents in fruiting bodies of different A. cinnamomea phenotypes. Values are…
Figure 2 Total triterpenoid contents in fruiting bodies of different A. cinnamomea phenotypes. Values are mean ± SD (n = 4).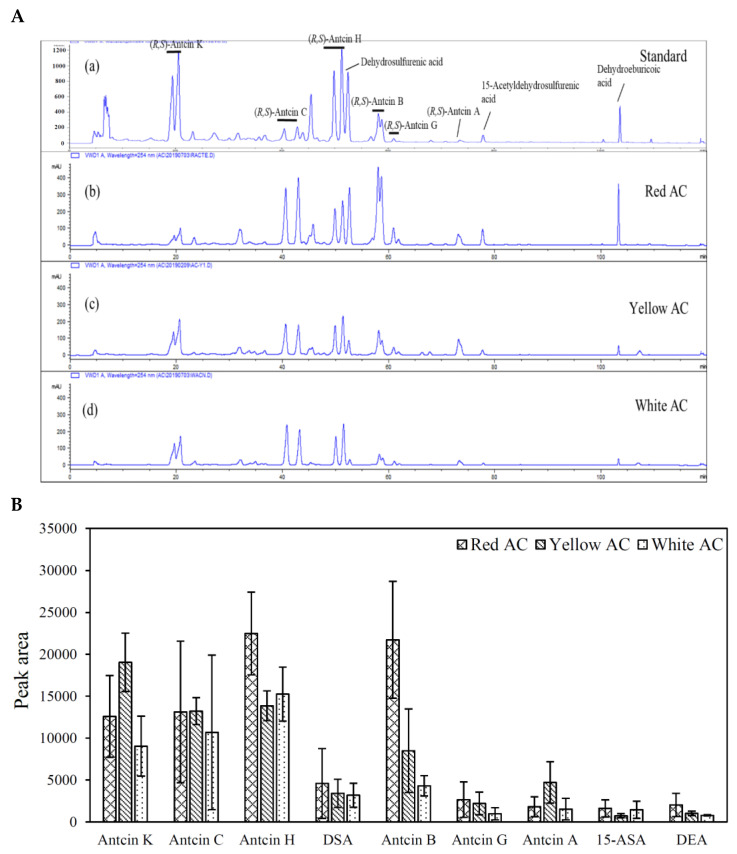
Figure 3
Representative HPLC profiles and peak…
Figure 3
Representative HPLC profiles and peak areas of bioactive triterpenoid (index) compounds in fruiting…
Figure 3 Representative HPLC profiles and peak areas of bioactive triterpenoid (index) compounds in fruiting bodies of different A. cinnamomea phenotypes collected from the wild. (A). Representative HPLC profiles: (a) standard, (b) red AC, (c) yellow AC, and (d) white AC. (B). The peak area represents the concentration of the compound integrated and calculated automatically by the computer of the HPLC system. DSA = Dehydrosulfurenic acid; 15-ASA = 15-Acetyldehydrosulfurenic acid; DEA = Dehydroeburicoic acid.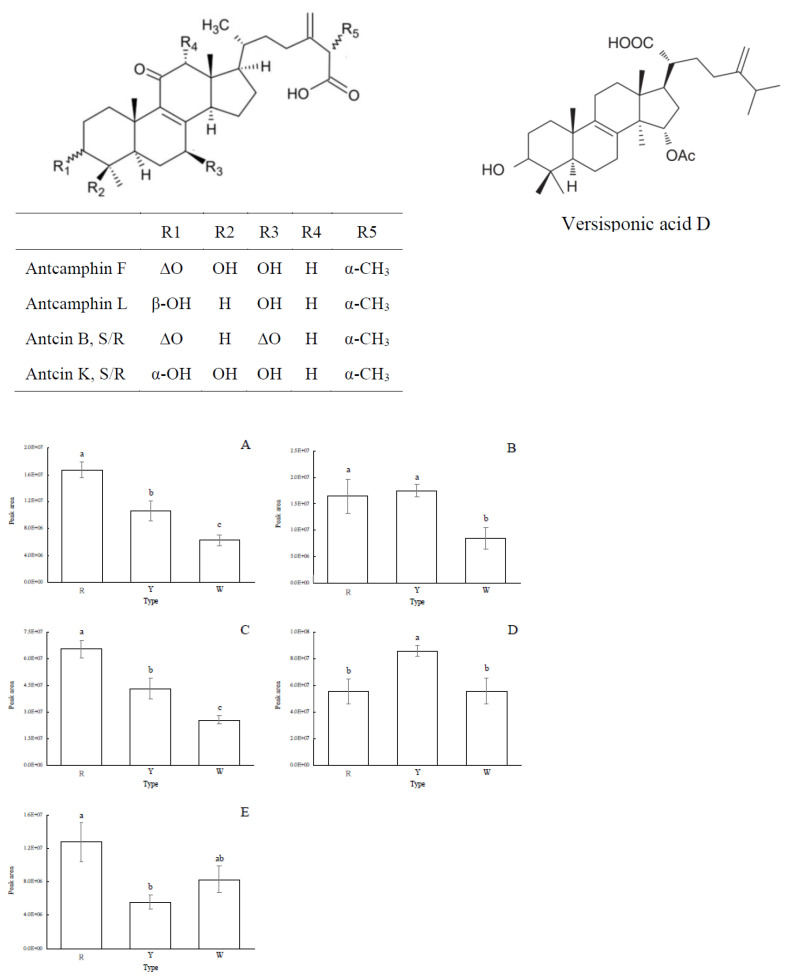
Figure 4
Differences in the relative content…
Figure 4
Differences in the relative content of the compounds with known structure in different…
Figure 4 Differences in the relative content of the compounds with known structure in different A. cinnamomea phenotypes. (A): antcamphin F, (B): antcamphin L, (C): antcin B, (D): antcin K, and (E): versisponic acid D. Values are mean ± SD (n = 4). Different letters in the same figure indicate significant differences between different AC phenotypes (p < 0.05 as analyzed by LSD tests). R = red AC; Y = yellow AC; W = white AC. The peak area represents the amount of a compound present in the sample as integrated and calculated automatically by the LC-MS chromatographic system.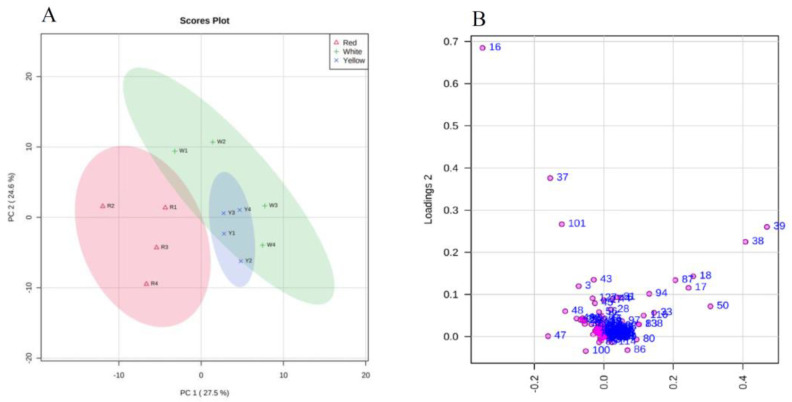
Figure 5
Principal component analysis of fruiting…
Figure 5
Principal component analysis of fruiting bodies of different A. cinnamomea phenotypes. ( A…
Figure 5 Principal component analysis of fruiting bodies of different A. cinnamomea phenotypes. (A): Score plot; Component 1 = 27.5%; component 2 = 24.6%. Different color represents different AC phenotypes as indicated in the legend. (B): Principal component analysis (PCA)-derived loading plot of the two principal components (PC1 and PC2) of 140 metabolites from different AC phenotypes.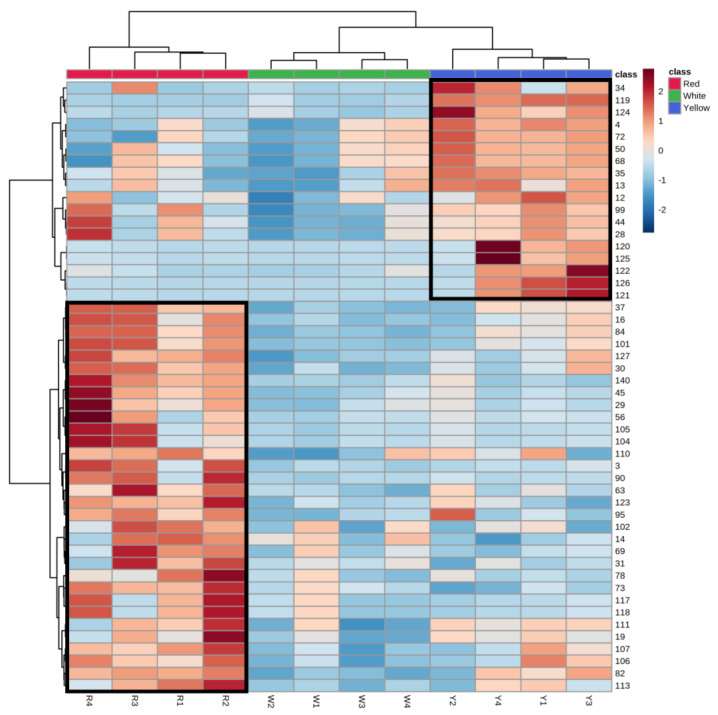
Figure 6
Heatmap of top 50 differential…
Figure 6
Heatmap of top 50 differential metabolites. The class with a different number of…
Figure 6 Heatmap of top 50 differential metabolites. The class with a different number of each row represents the compound ID. The class red (R), white (W), and yellow (Y) represent red AC, white AC, and yellow AC, respectively. The relative abundance of metabolites (which ranges from −2 to +2) in different A. cinnamomea phenotypes are calculated by the mean-centered and divided by the standard deviation of each variable (metabolites).