Hepatoprotective Effects of Antrodia cinnamomea: The Modulation of Oxidative Stress Signaling in a Mouse Model of Alcohol-Induced Acute Liver Injury
Figures
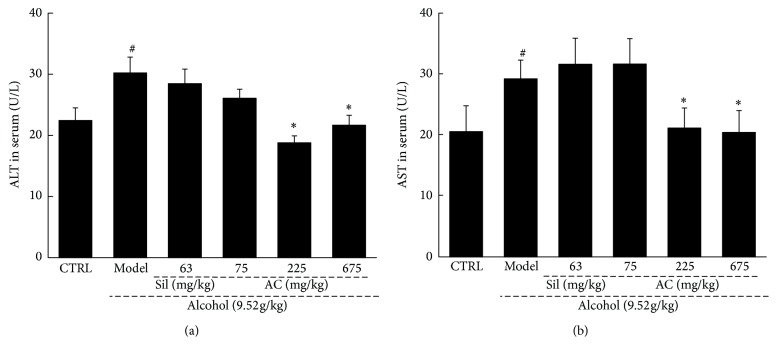
Figure 1
Two-week AC and Sil treatment…
Figure 1
Two-week AC and Sil treatment reduced the levels of (a) ALT and (b)…
Figure 1 Two-week AC and Sil treatment reduced the levels of (a) ALT and (b) AST in the serum of mice with acute alcohol-induced liver injury. The data were analyzed using a one-way ANOVA and they are expressed as means SEMs (n = 10). #P < 0.05 in a comparison with the no-alcohol control group; ∗P < 0.05 in a comparison with the alcohol-only control group. AC: A. cinnamomea mycelia; Sil: silymarin; ALT: alanine aminotransferase; AST: aspartate aminotransferase; ANOVA: analysis of variance; SEM: standard error of the mean.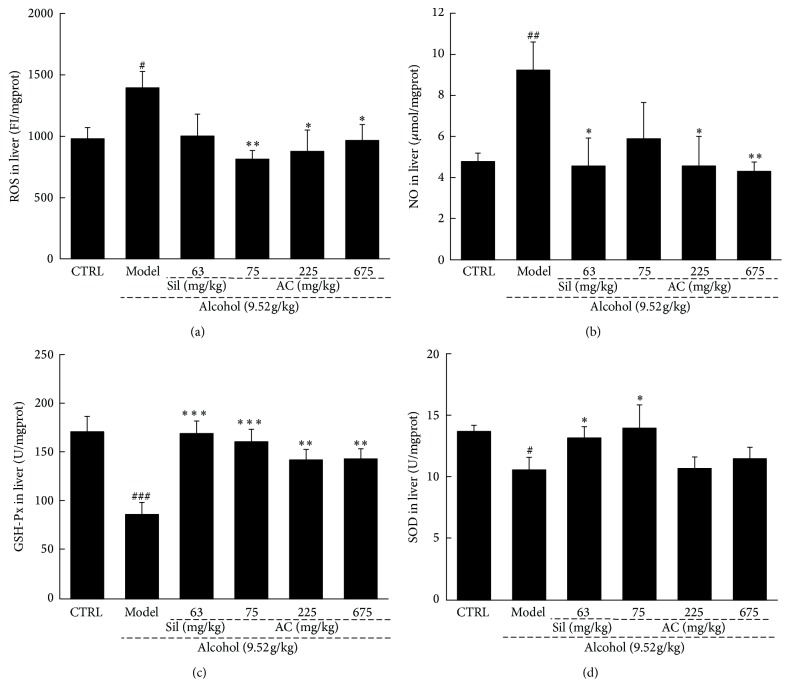
Figure 2
Two-week AC and Sil treatments…
Figure 2
Two-week AC and Sil treatments affected the levels of (a) ROS, (b) NO,…
Figure 2 Two-week AC and Sil treatments affected the levels of (a) ROS, (b) NO, (c) GSH-Px, and (d) SOD in the livers of mice with acute alcohol-induced liver injury. The data were analyzed using a one-way ANOVA and they are expressed as means SEMs (n = 10). #P < 0.05, ##P < 0.01, and ###P < 0.001 in a comparison with the no-alcohol control group; ∗P < 0.05, ∗∗P < 0.01, and ∗∗∗P < 0.001 in a comparison with the alcohol-only control group. AC: A. cinnamomea mycelia; Sil: silymarin; ANOVA: analysis of variance; GSH-Px: glutathione peroxidase; NO: nitric oxide; ROS: reactive oxygen species; SOD: superoxide dismutase; SEM: standard error of the mean.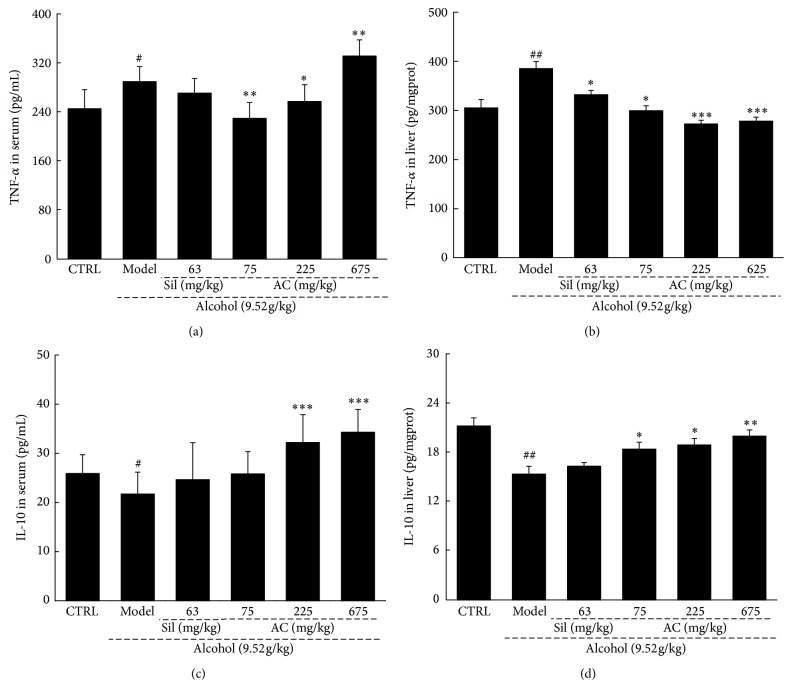
Figure 3
Two-week AC and Sil treatment…
Figure 3
Two-week AC and Sil treatment (a and b) reduced the levels of TNF-…
Figure 3 Two-week AC and Sil treatment (a and b) reduced the levels of TNF-α and (c and d) increased the levels of IL-10 in the serum and liver of mice with acute alcohol-induced liver injury. The data were analyzed using a one-way ANOVA and they are expressed as means SEMs (n = 10). #P < 0.05 and ##P < 0.01 in a comparison with the no-alcohol control group; ∗P < 0.05, ∗∗P < 0.01, and ∗∗∗P < 0.001 in a comparison with the alcohol-only control group. AC: A. cinnamomea mycelia; Sil: silymarin; ANOVA: analysis of variance; SEM: standard error of the mean; IL-10: interleukin-10; TNF-α: tumor necrosis factor-α.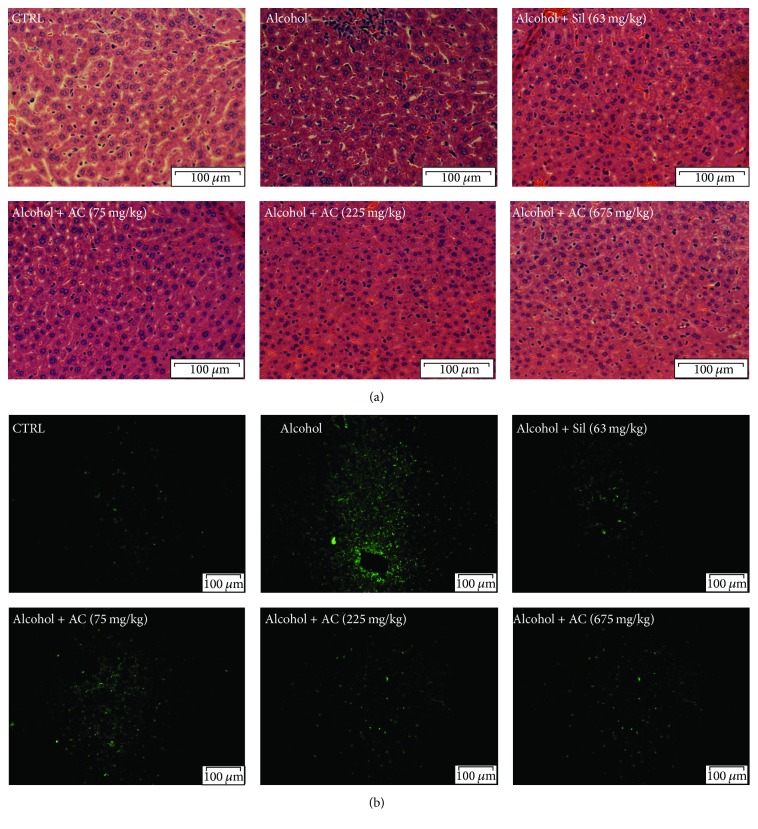
Figure 4
(a) Histopathological analysis in liver…
Figure 4
(a) Histopathological analysis in liver shown by H&E staining (scale bar: 100 μ…
Figure 4 (a) Histopathological analysis in liver shown by H&E staining (scale bar: 100 μm; magnification: 40x). (b) Apoptosis rate detection shown by TUNEL-positive cells with green fluorescence (scale bar: 100 μm; magnification: 20x). AC: A. cinnamomea mycelia; Sil: silymarin; H&E: Hematoxylin and eosin; TUNEL: terminal deoxynucleotidyl transferase-mediated dUTP nick end-labeling.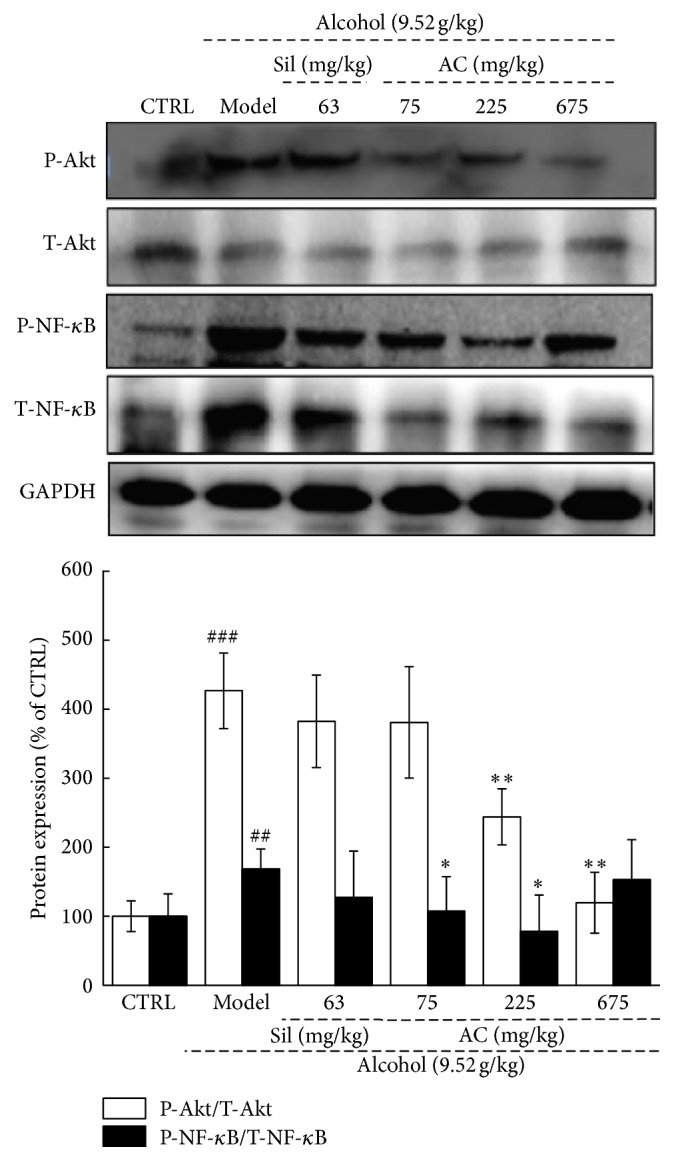
Figure 5
Two-week AC and Sil treatment…
Figure 5
Two-week AC and Sil treatment suppressed the levels of phosphor-NF- κ B and…
Figure 5 Two-week AC and Sil treatment suppressed the levels of phosphor-NF-κB and phosphor-Akt in the livers of mice with acute alcohol-induced liver injury. The data on quantified protein expression were normalized to the levels of GAPDH. The data were analyzed using a one-way ANOVA and they are expressed as means SEMs (n = 10). ##P < 0.01 and ###P < 0.001 in a comparison with the no-alcohol control group; ∗P < 0.05 and ∗∗P < 0.01 in a comparison with the alcohol-only control group. AC: A. cinnamomea mycelia; Sil: silymarin; Akt: protein kinase B; ANOVA: analysis of variance; SEM: standard error of the mean; GAPDH: glyceraldehyde-3-phosphate dehydrogenase; NF-κB: nuclear factor-κB.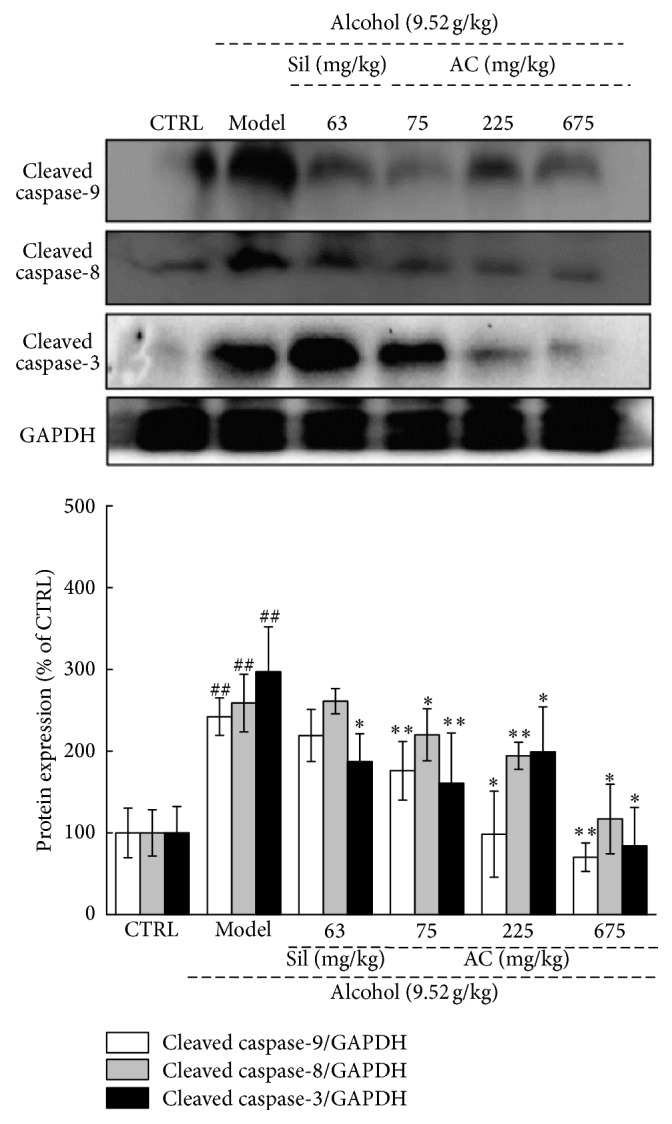
Figure 6
Two-week AC and Sil treatments…
Figure 6
Two-week AC and Sil treatments suppressed the expression of cleaved caspase-3, -8, and…
Figure 6 Two-week AC and Sil treatments suppressed the expression of cleaved caspase-3, -8, and -9 in the livers of mice with acute alcohol-induced liver injury. The data on quantified protein expression were normalized to the levels of GAPDH. The data were analyzed using a one-way ANOVA and they are expressed as means SEMs (n = 10). ##P < 0.01 in a comparison with the no-alcohol control group; ∗P < 0.05 and ∗∗P < 0.01 in a comparison with the alcohol-only control group. AC: A. cinnamomea mycelia; Sil: silymarin; ANOVA: analysis of variance; SEM: standard error of the mean; GAPDH: glyceraldehyde-3-phosphate dehydrogenase.