Hepatoprotective Effect of Wheat-Based Solid-State Fermented Antrodia cinnamomea in Carbon Tetrachloride-Induced Liver Injury in Rat
Figures
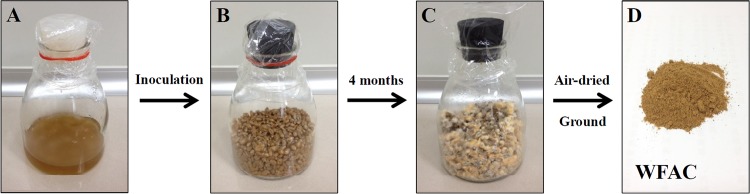
Fig 1. Preparation of WFAC.
(A) Liquid…
Fig 1. Preparation of WFAC.
(A) Liquid fermented A . cinnamomea . (B) Sterilized wheat…
Fig 1. Preparation of WFAC. (A) Liquid fermented A. cinnamomea. (B) Sterilized wheat before A. cinnamomea inoculation. (C) 4 months fermented A. cinnamomea in wheat. (D) Ground WFAC.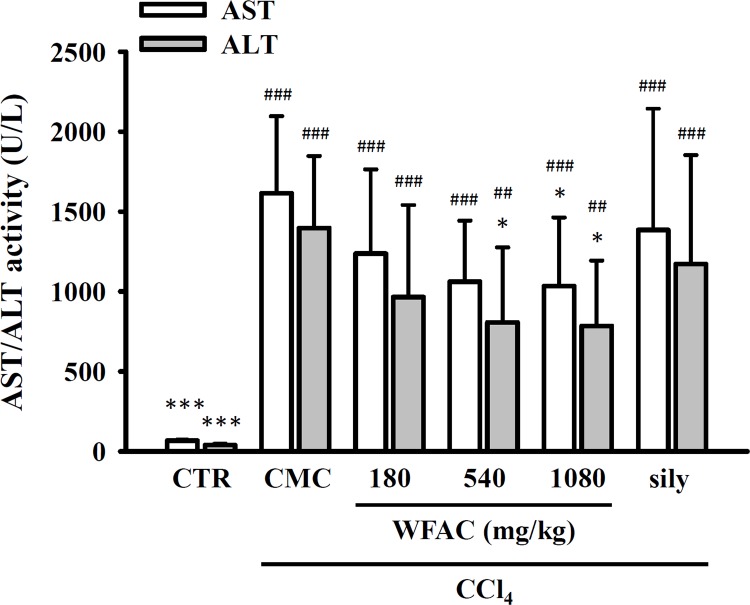
Fig 2. Effect of WFAC on plasma…
Fig 2. Effect of WFAC on plasma AST and ALT activities in CCl 4 -intoxicated…
Blood…
Fig 2. Effect of WFAC on plasma AST and ALT activities in CCl4-intoxicated rat. Blood samples collected at the end of the eighth weeks after CCl4 intoxication. All values are the means ± S.D. (n = 10). ## p < 0.01 and ### p < 0.001 compared with the control group. * p <0.05 and *** p <0.001 compared with the CCl4 + CMC group. CTR: control; Sily: silymarin (200 mg/kg).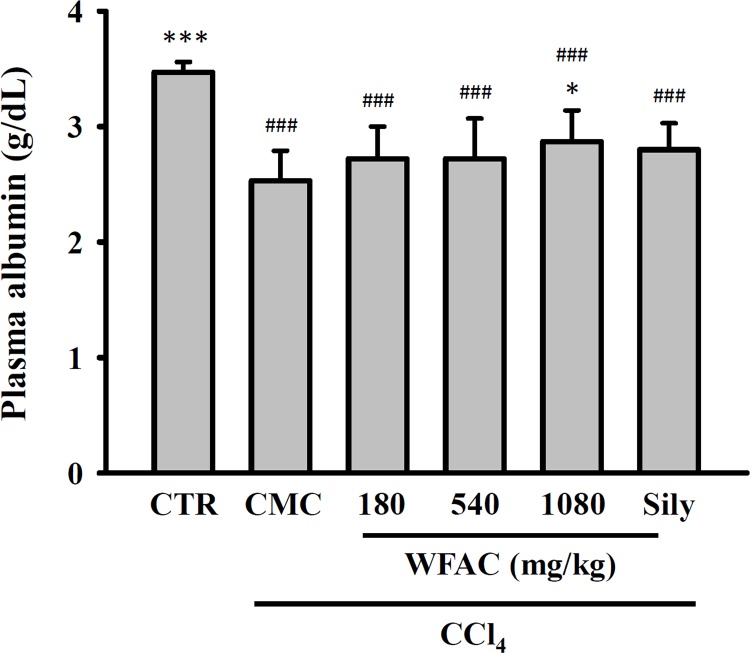
Fig 3. Effect of WFAC on plasma…
Fig 3. Effect of WFAC on plasma albumin concentration in CCl 4 -intoxicated rat.
Blood samples collected…
Fig 3. Effect of WFAC on plasma albumin concentration in CCl4-intoxicated rat. Blood samples collected at the end of the eighth weeks after CCl4 intoxication. All values are the means ± S.D. (n = 10). ### p < 0.001 compared with the control group. * p <0.05 and *** p <0.001 compared with the CCl4 + CMC group. CTR: control; Sily: silymarin (200 mg/kg).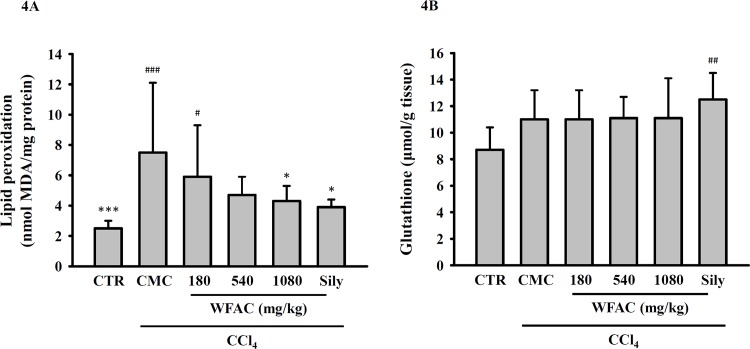
Fig 4. Effect of WFAC on the…
Fig 4. Effect of WFAC on the hepatic levels of lipid peroxidation and glutathione in…
Fig 4. Effect of WFAC on the hepatic levels of lipid peroxidation and glutathione in CCl4-intoxicated rat. Liver tissue samples collected at the end of the eighth weeks after CCl4 intoxication. (A) Levels of lipid peroxidation. (B) Levels of glutathione. All values are the means ± S.D. (n = 10). # p < 0.05, ## p < 0.01 and ### p < 0.001 compared with the control group. * p <0.05 and *** p <0.001 compared with the CCl4 + CMC group. CTR: control; Sily: silymarin (200 mg/kg).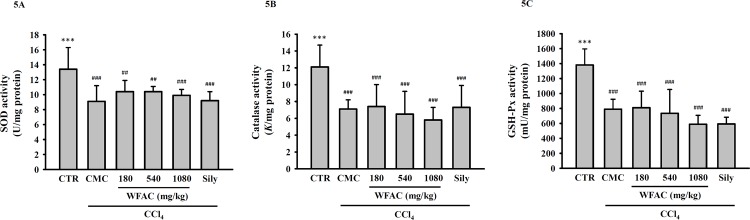
Fig 5. Effect of WFAC on hepatic…
Fig 5. Effect of WFAC on hepatic SOD, catalase and GSH-Px activities in CCl 4…
Fig 5. Effect of WFAC on hepatic SOD, catalase and GSH-Px activities in CCl4-intoxicated rat. Liver tissue samples collected at the end of the eighth weeks after CCl4 intoxication. (A) SOD activity. (B) Catalase activity. (C) GSH-Px activity. All values are the means ± S.D. (n = 10). ## p < 0.01 and ### p < 0.001 compared with the control group. *** p <0.001 compared with the CCl4 + CMC group. CTR: control; Sily: silymarin (200 mg/kg).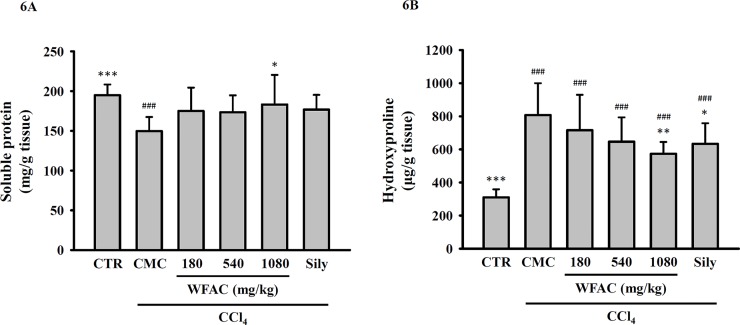
Fig 6. Effect of WFAC on hepatic…
Fig 6. Effect of WFAC on hepatic soluble protein levels and hydroxyproline contents in CCl…
Fig 6. Effect of WFAC on hepatic soluble protein levels and hydroxyproline contents in CCl4-intoxicated rat. Liver tissue samples collected at the end of the eighth weeks after CCl4 intoxication. (A) Soluble protein levels. (B) Hydroxyproline contents. All values are the means ± S.D. (n = 10). ### p < 0.001 compared with the control group. * p <0.05, ** p <0.01 and *** p <0.001 compared with the CCl4 + CMC group. CTR: control; Sily: silymarin (200 mg/kg).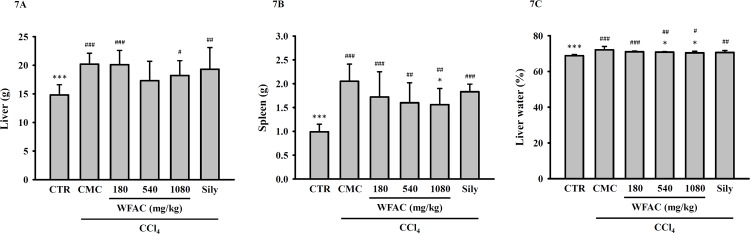
Fig 7. Effect of WFAC on the…
Fig 7. Effect of WFAC on the weights of the liver and spleen and the…
Fig 7. Effect of WFAC on the weights of the liver and spleen and the water content of livers in CCl4-intoxicated rat. Liver tissue samples collected at the end of the eighth weeks after CCl4 intoxication. (A) Liver. (B) Spleen. (C) Liver water content. All values are the means ± S.D. (n = 10). # p < 0.05, ## p < 0.01 and ### p < 0.001 compared with the control group. * p <0.05 and *** p <0.001 compared with the CCl4 + CMC group. CTR: control; Sily: silymarin (200 mg/kg).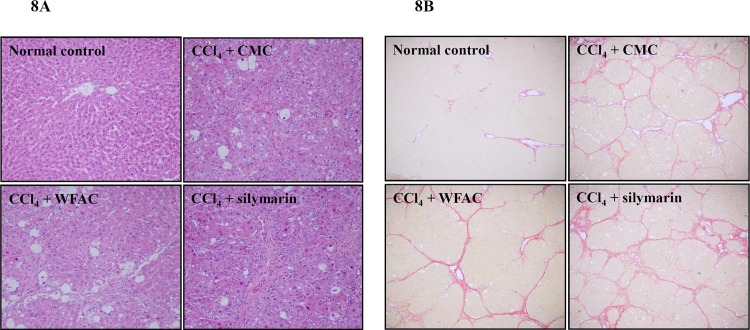
Fig 8. Hematoxylin/eosin and Sirius red staining…
Fig 8. Hematoxylin/eosin and Sirius red staining showing the effect of the WFAC on hepatic…
Fig 8. Hematoxylin/eosin and Sirius red staining showing the effect of the WFAC on hepatic histopathology in CCl4-intoxicated rat. Liver tissue samples collected at the end of the eighth weeks after CCl4 intoxication. (A) Hematoxylin and eosin staining of a representative liver tissue. (B) Sirius red staining of a representative liver tissue. All figures (8)