Genomic and transcriptomic analyses of the medicinal fungus Antrodia cinnamomea for its metabolite biosynthesis and sexual development
Abstract
Antrodia cinnamomea, a polyporus mushroom of Taiwan, has long been used as a remedy for cancer, hypertension, and hangover, with an annual market of over $100 million (US) in Taiwan. We obtained a 32.15-Mb genome draft containing 9,254 genes. Genome ontology enrichment and pathway analyses shed light on sexual development and the biosynthesis of sesquiterpenoids, triterpenoids, ergostanes, antroquinonol, and antrocamphin. We identified genes differentially expressed between mycelium and fruiting body and 242 proteins in the mevalonate pathway, terpenoid pathways, cytochrome P450s, and polyketide synthases, which may contribute to the production of medicinal secondary metabolites. Genes of secondary metabolite biosynthetic pathways showed expression enrichment for tissue-specific compounds, including 14-α-demethylase (CYP51F1) in fruiting body for converting lanostane to ergostane triterpenoids, coenzymes Q (COQ) for antroquinonol biosynthesis in mycelium, and polyketide synthase for antrocamphin biosynthesis in fruiting body. Our data will be useful for developing a strategy to increase the production of useful metabolites.
Figures 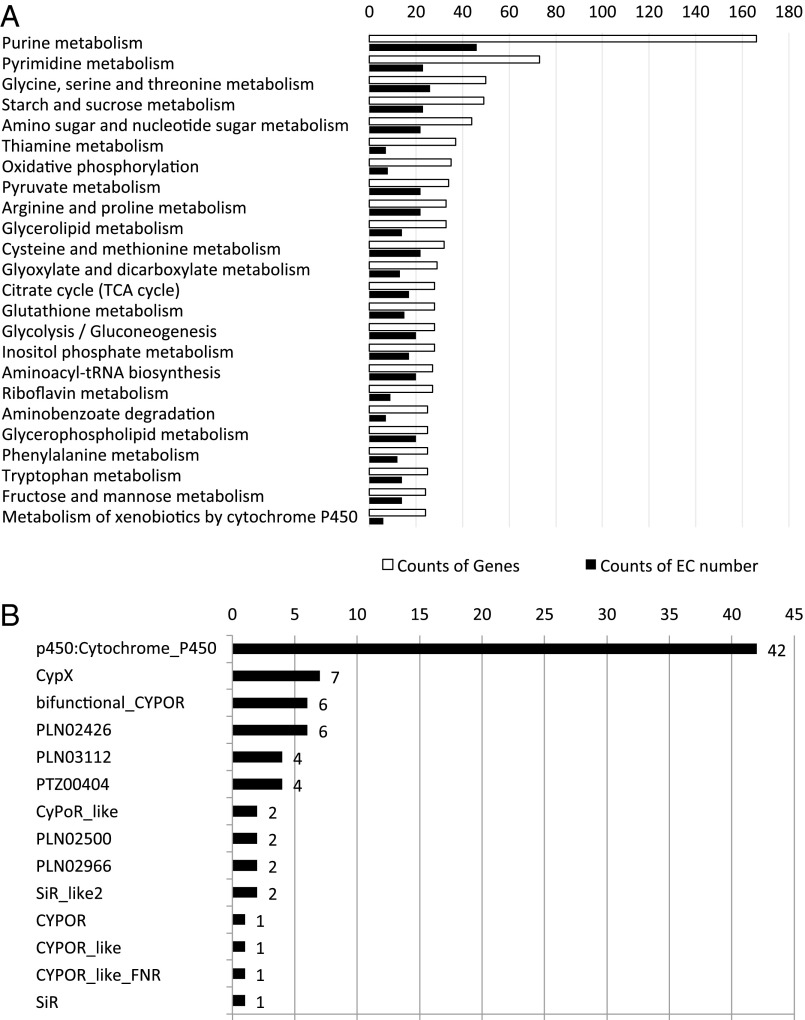
Fig. 1.
Functional categorization of A. cinnamomea…
Fig. 1.
Functional categorization of A. cinnamomea gene models. ( A ) Distribution of genes…
Fig. 1. Functional categorization of A. cinnamomea gene models.(A) Distribution of genes in different KEGG categories.White bars indicate counts of EC numbers and solid black bars indicate genecounts. (B) Distribution of P450 genes in different cytochromeP450 domain categories.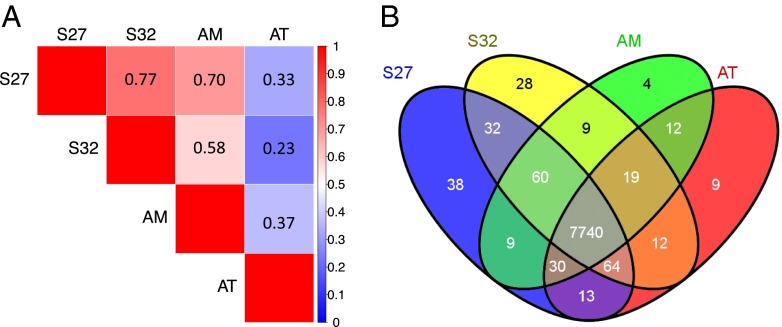
Fig. 2.
Relationships between the four transcriptomes…
Fig. 2.
Relationships between the four transcriptomes of A. cinnamomea . ( A ) Pairwise…
Fig. 2. Relationships between the four transcriptomes of A.cinnamomea. (A) Pairwise correlation of normalizedRPKMs between RNA samples. The Pearson correlation coefficient ranges from nocorrelation (blue) to perfect correlation (red). S27 and S32, single-nucleatedmycelia; AM, binucleated mycelium; AT, wood-grown fruiting body.(B) Venn diagram of 8,079 expressed genes in fourAntrodia transcriptomes.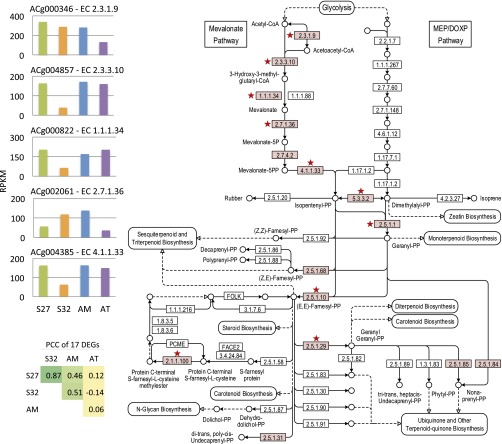
Fig. 3.
KEGG mapping of terpenoid backbone…
Fig. 3.
KEGG mapping of terpenoid backbone biosynthesis pathway and differential expression of the enzymes…
Fig. 3. KEGG mapping of terpenoid backbone biosynthesis pathway and differentialexpression of the enzymes identified in A. cinnamomea.(Right) KEGG map 00900. Red stars indicate the hits ofdifferentially expressed genes in this map. (Upper Left) Theexpression levels (RPKM values) of mapped genes (EC 2.3.1.9, EC 2.3.3.10, EC1.1.1.34, EC 2.7.1.36, EC 4.1.1.33) of different strains. (LowerLeft) Pearson correlation coefficients of the 17 mapped genes inthe terpenoid backbone biosynthesis pathway.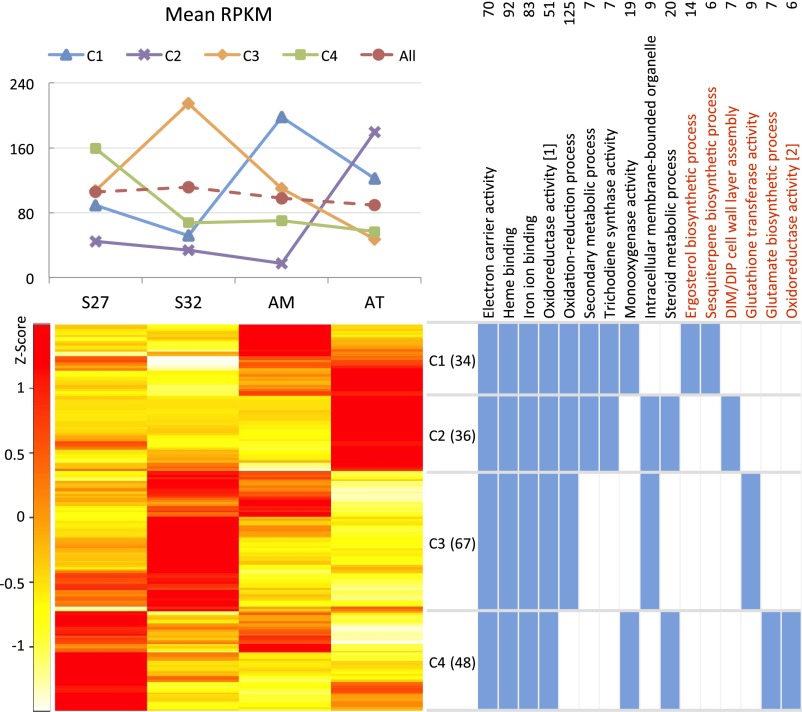
Fig. 4.
Expression profile clustering of triterpenoid…
Fig. 4.
Expression profile clustering of triterpenoid biosynthesis genes in A. cinnamomea . The four…
Fig. 4. Expression profile clustering of triterpenoid biosynthesis genes in A.cinnamomea. The four RNA samples were from the mycelia of S27 andS32 (two single-nucleated isolates), the mycelium of AM (a binucleatedisolate), and the fruiting body of AT (a wood-grown isolate). A total of 185differentially expressed genes are clustered into four groups: C1, C2, C3, andC4. (Lower Left) Clustering of expressed gene models (withRPKMs transformed to Z-values) by R script. (Upper Left)Median RPKM values of the genes in the four clusters. (UpperRight) GO categories enriched in the genome-wide annotation of S27.The two oxidoreductase activity categories are the following:(i) oxidoreductase activity, acting on paired donors, withincorporation or reduction of molecular oxygen, and (ii)oxidoreductase activity, acting on paired donors, with incorporation orreduction of molecular oxygen, reduced flavin or flavoprotein as one donor, andincorporation of one atom of oxygen. (Lower Right) Clustersshowing expression enrichment of the GO categories are shown in blue.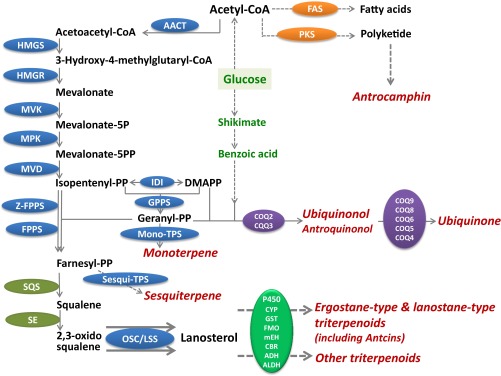
Fig. 5.
Representative secondary metabolites and biosynthesis…
Fig. 5.
Representative secondary metabolites and biosynthesis pathways of triterpenoids and antrocamphin of A. cinnamomea…
Fig. 5. Representative secondary metabolites and biosynthesis pathways of triterpenoidsand antrocamphin of A. cinnamomea. The enzymes are differentiallycolored by their corresponding pathways: blue, KEGG map00900; olive, map00909;purple, map00130; green, map00980 and map00982; orange, putative antrocamphinpathway; red, various modifying enzymes converting triterpenoid skeletons intodifferent bioactive compounds. Three enzymes, AACT, IDI, and GPPS, all showedsignificantly higher expression in the S27 mycelium than in the AT fruiting body.OSC/LSS showed the highest expression in AT among all four transcriptomes.