Ethanol extracts of fruiting bodies of Antrodia cinnamomea suppress CL1-5 human lung adenocarcinoma cells migration by inhibiting matrix metalloproteinase-2/9 through ERK, JNK, p38, and PI3K/Akt signaling pathways
Figures
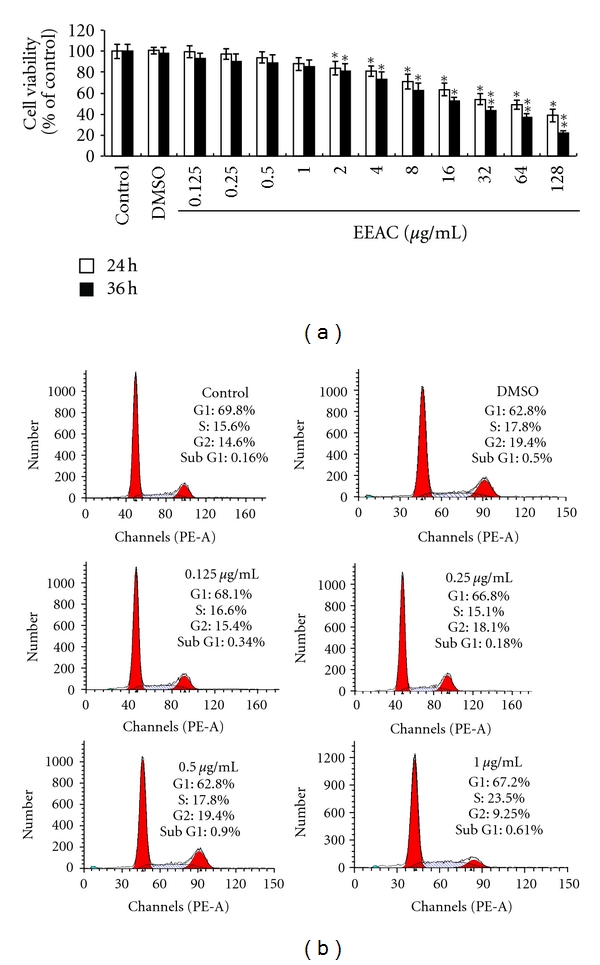
Figure 1
(a) Viability of CL1-5 cells…
Figure 1
(a) Viability of CL1-5 cells incubated with EEAC (0.125, 0.25, 0.5, 1.0, 2.0,…
Figure 1 (a) Viability of CL1-5 cells incubated with EEAC (0.125, 0.25, 0.5, 1.0, 2.0, 4.0, 8.0, 16, 32, 64, and 128 μg/mL) for 24 h and 36 h. Cell viability was measured using MTT assay and is expressed as % of cell survival relative to control. (b) Flow cytometric analysis of EEAC on the cell cycle of CL1-5. All the cells were treated with 1% fetal bovine serum with the addition of EEAC at 0.125 μg/mL, 0.25 μg/mL, 0.5 μg/mL, and 1.0 μg/mL for 36 h. The value on the x-axis represents the DNA content, while the shaded area indicates the percentage of cells at the S phase. Percentage of sub G1 contents in CL1-5 cells treated with EEAC. Values are means of three separate experiments, with standard deviation represented by vertical bars. *P < 0.05; **P < 0.01. Lower case for 24 h and upper case for 36 h.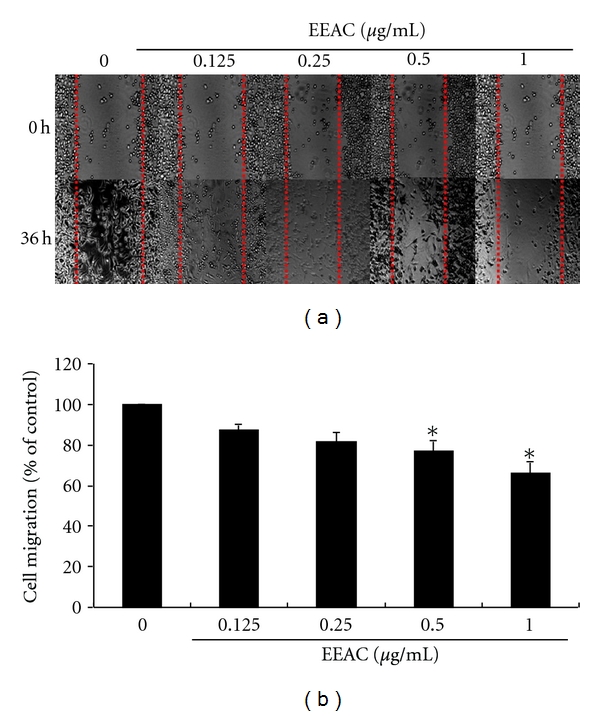
Figure 2
Effects of EEAC on wound…
Figure 2
Effects of EEAC on wound healing migration of CL1-5 cells. Wound was introduced…
Figure 2 Effects of EEAC on wound healing migration of CL1-5 cells. Wound was introduced by scraping confluent cell layers with a pipet tip. CL1-5 cells were incubated with EEAC (0.125, 0.25, 0.5, and 1.0 μg/mL) for 36 h, and the migration distances of cells were calculated. (a) Representative photographs of invading cells that received either control or EEAC treatment. (b) Migrated cells across the black lines were counted in six random fields from each treatment. The mean number of cells in the denuded zone is quantified by three independent experiments. Values (means ± SD, n = 3) differ significantly (P < 0.05).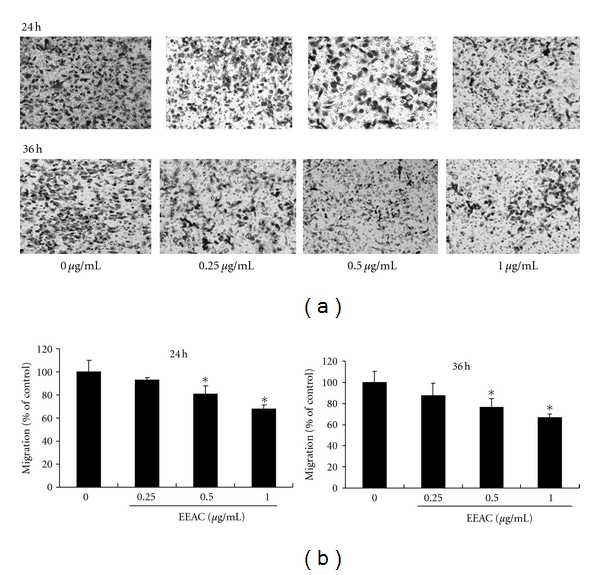
Figure 3
Effects of EEAC on (a)…
Figure 3
Effects of EEAC on (a) transwell migration assay of CL1-5 cells. CL1-5 cells…
Figure 3 Effects of EEAC on (a) transwell migration assay of CL1-5 cells. CL1-5 cells were incubated with EEAC (0.25, 0.5 and 1.0 μg/mL) for 24 h and 36 h, and the (b) transwell migration cells were calculated. Photos of the migration CL1-5 cells were taken under a microscope (200-fold magnification). Values (means ± SD, n = 3) differ significantly (P < 0.05).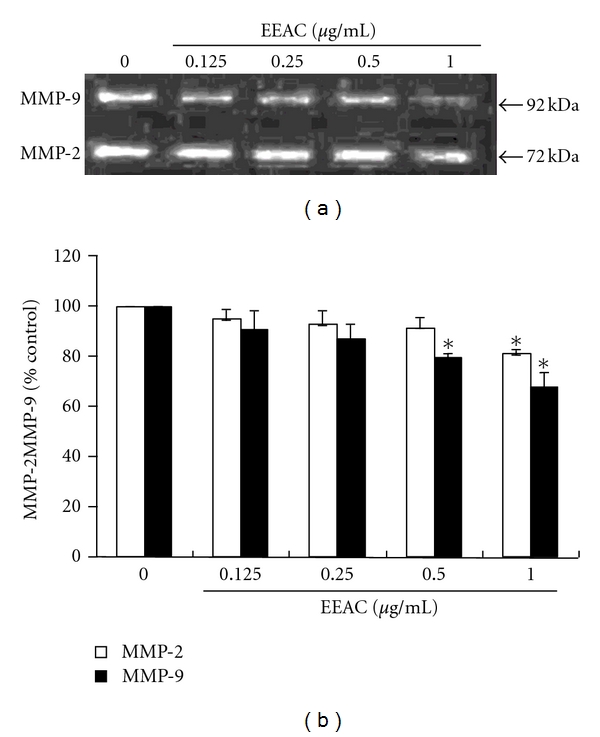
Figure 4
Effects of EEAC on MMP-2…
Figure 4
Effects of EEAC on MMP-2 and MMP-9 activities of CL1-5 cells. (a) Cells…
Figure 4 Effects of EEAC on MMP-2 and MMP-9 activities of CL1-5 cells. (a) Cells were treated with various concentrations (0.125, 0.25, 0.5, and 1.0 μg/mL) of EEAC for 36 h. The conditioned media were collected, and MMP-2, and MMP-9 activities were determined by gelatin zymography. (b) The activities of these proteins were subsequently quantified by densitometric analysis. Values (means ± SD, n = 3) differ significantly (P < 0.05) (lower case for MMP-2 and upper case for MMP-9).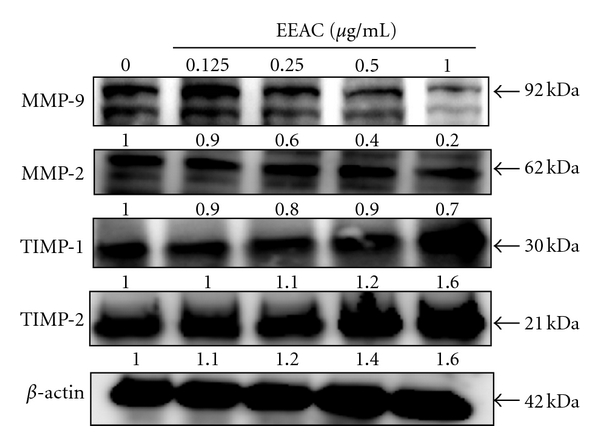
Figure 5
Effects of EEAC on TIMP-1,…
Figure 5
Effects of EEAC on TIMP-1, TIMP-2, MMP-9, and MMP-2 protein expression. CL1-5 cells…
Figure 5 Effects of EEAC on TIMP-1, TIMP-2, MMP-9, and MMP-2 protein expression. CL1-5 cells were treated with 0.125, 0.25, 0.5, and 1.0 μg/mL for 36 h, and cell lysates were subjected to SDS-PAGE followed by western blotting and subsequently quantified by densitometric analyses (using control as 100%). The values indicate the density proportion of each protein compared with control.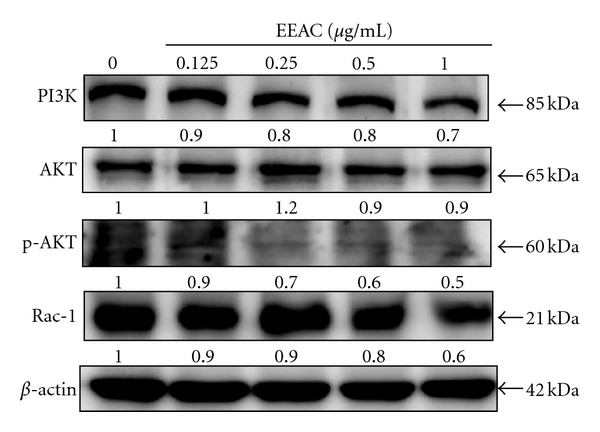
Figure 6
Concentration-dependent effects of EEAC on…
Figure 6
Concentration-dependent effects of EEAC on the protein expression level of PI3K, phosphorylated AKT…
Figure 6 Concentration-dependent effects of EEAC on the protein expression level of PI3K, phosphorylated AKT and Rac-1. In the concentration-dependent assay, CL1-5 cells were treated with 0.125, 0.25, 0.5, and 1.0 μg/mL of EEAC for 36 h. The expression of PI3K, phosphorylation of AKT and Rac-1 were analyzed by Western blotting. β-actin was used as a loading control. The values indicate the density proportion of each protein compared with control.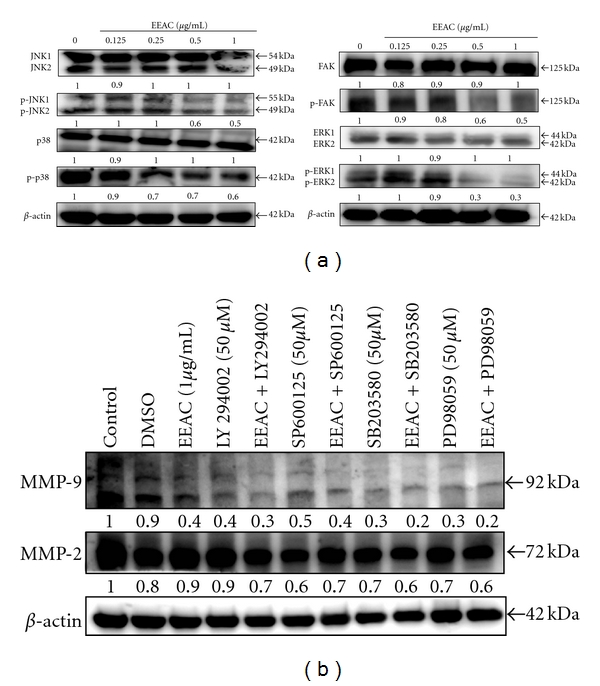
Figure 7
Effects of EEAC on protein…
Figure 7
Effects of EEAC on protein levels of MAPK signaling and phosphorylated focal adhesion…
Figure 7 Effects of EEAC on protein levels of MAPK signaling and phosphorylated focal adhesion kinase (p-FAK) in CL1-5 cells. (a) CL1-5 were treated with several different concentrations of EEAC (0.125, 0.25, 0.5, and 1.0 μg/mL) for 36 h. (b) Effects of PI3K inhibitor (LY294002; 50 μM), ERK1/2 inhibitor (PD98059; 50 μM), JNK inhibitor (SP600125; 50 μM), and p38 MAPK inhibitor (SB203580; 50 μM) on EEAC-induced protein expressions of MMP-2 and -9. Cells were pretreated with an inhibitor (50 μM) at 1 h prior to the treatment with 1.0 μg/mL EEAC for 36 h (total inhibitor exposure time was 37 h). Protein expressions of MMP-2 and -9 were determined by the western blotting assay.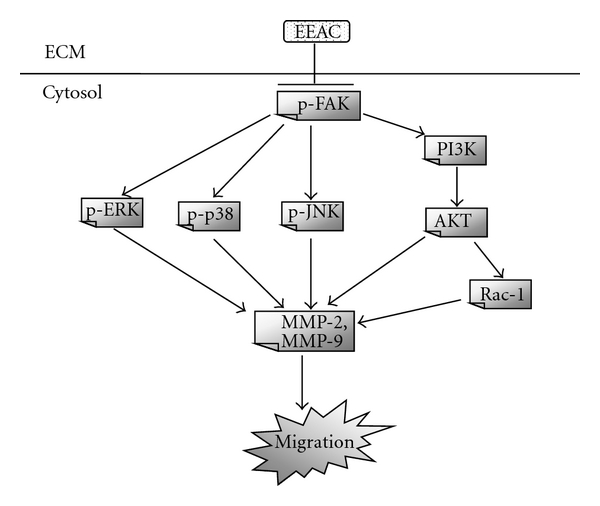
Figure 8
Proposed signaling pathways for EEAC-mediated…
Figure 8
Proposed signaling pathways for EEAC-mediated inhibition against migration of CL1-5 cells. The effect…
Figure 8 Proposed signaling pathways for EEAC-mediated inhibition against migration of CL1-5 cells. The effect of EEAC is achieved likely through the inhibition of FAK, which regulates Rac-1/MMP-9 expression through MAPK and PI3K/AKT signaling pathways. All figures (8)