Ergosta-7,9(11),22-trien-3β-ol Alleviates Intracerebral Hemorrhage-Induced Brain Injury and BV-2 Microglial Activation
Abstract
Intracerebral hemorrhage (ICH) is a devastating neurological disorder characterized by an exacerbation of neuroinflammation and neuronal injury, for which few effective therapies are available at present. Inhibition of excessive neuroglial activation has been reported to alleviate ICH-related brain injuries. In the present study, the anti-ICH activity and microglial mechanism of ergosta-7,9(11),22-trien-3β-ol (EK100), a bioactive ingredient from Asian medicinal herb Antrodia camphorate, were evaluated. Post-treatment of EK100 significantly attenuated neurobehavioral deficit and MRI-related brain lesion in the mice model of collagenase-induced ICH. Additionally, EK100 alleviated the inducible expression of cyclooxygenase (COX)-2 and the activity of matrix metalloproteinase (MMP)-9 in the ipsilateral brain regions. Consistently, it was shown that EK100 concentration-dependently inhibited the expression of COX-2 protein in Toll-like receptor (TLR)-4 activator lipopolysaccharide (LPS)-activated microglial BV-2 and primary microglial cells. Furthermore, the production of microglial prostaglandin E2 and reactive oxygen species were attenuated by EK100. EK100 also attenuated the induction of astrocytic MMP-9 activation. Among several signaling pathways, EK100 significantly and concentration-dependently inhibited activation of c-Jun N-terminal kinase (JNK) MAPK in LPS-activated microglial BV-2 cells. Consistently, ipsilateral JNK activation was markedly inhibited by post-ICH-treated EK100 in vivo. In conclusion, EK100 exerted the inhibitory actions on microglial JNK activation, and attenuated brain COX-2 expression, MMP-9 activation, and brain injuries in the mice ICH model. Thus, EK100 may be proposed and employed as a potential therapeutic agent for ICH.
Figures 
Figure 1
Effects of ergosta-7,9(11),22-trien-3β-ol (EK100) on…
Figure 1
Effects of ergosta-7,9(11),22-trien-3β-ol (EK100) on neurobehavioral deficits and neuroimaging abnormalities after intracerebral hemorrhage…
Figure 1 Effects of ergosta-7,9(11),22-trien-3β-ol (EK100) on neurobehavioral deficits and neuroimaging abnormalities after intracerebral hemorrhage (ICH) in vivo. C57BL/6 mice were post-ICH orally administered EK100 (30 mg/kg) or vehicle at 30 min after the intrastriatal injection of 0.02 U collagenase to induce ICH. (A) The chemical structure of EK100 was shown. (B) The neurobehavioral deficit evaluation scores were shown as all six individual test scores after 24 h (n = 8). The evaluations were described as details in the Methods section. (C) T2-weighted MRIs at 24 h after ICH treated with vehicle or EK100 (30 mg/kg) and their non-ICH control. (D) Bar graph demonstrating the lesion index expressed, as detailed in Materials and Methods. Values were expressed as the mean ± SD (n = 4). ###p < 0.001 compared with ipsilateral NS (normal saline)-intrastriatal injected with vehicle treatment group; * p < 0.05, *** p < 0.001 compared with ipsilateral collagenase-intrastriatal injected with vehicle treatment group (ICH). The gated-locus used for evaluation of brain injury was illustrated.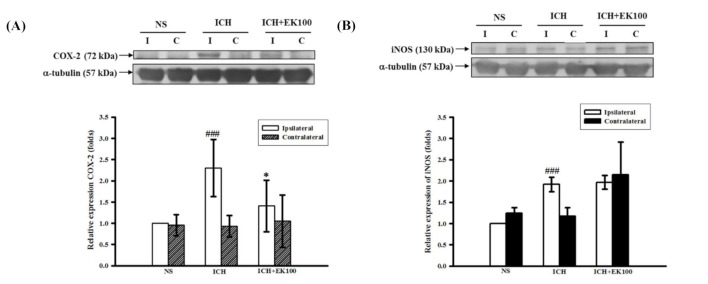
Figure 2
Effects of EK100 on the…
Figure 2
Effects of EK100 on the expression of brain COX-2 and iNOS proteins after…
Figure 2 Effects of EK100 on the expression of brain COX-2 and iNOS proteins after ICH. C57BL/6 mice were post-ICH orally administered EK100 (30 mg/kg) at 30 min after the intrastriatal injection of 0.02 U collagenase to induce ICH. Brain slices (3 mm) were obtained at 24 h after ICH, and their ipsilateral (I) and contralateral (C) regions were homogenated and analyzed for the expression of COX-2 (A, n = 6) and iNOS (B, n = 5) proteins by Western blots. The relative changes (folds) were represented as the mean ± SD. ###p < 0.001 compared with ipsilateral NS-intrastriatal injected with vehicle treatment group; * p < 0.05 compared with ipsilateral collagenase-intrastriatal injected with vehicle treatment group.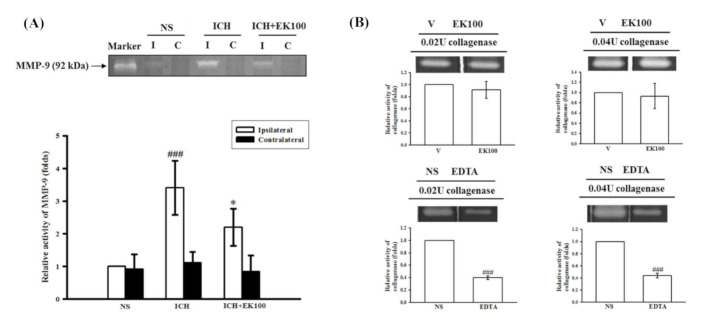
Figure 3
Effects of EK100 on the…
Figure 3
Effects of EK100 on the gelatinolytic activity of cerebral MMP-9 after ICH in…
Figure 3 Effects of EK100 on the gelatinolytic activity of cerebral MMP-9 after ICH in vivo and collagenase VII enzyme in vitro. (A) C57BL/6 mice were administered EK100 with an oral dosage of 30 mg/kg at 30 min after the intrastriatal injection of 0.02 U collagenase to induce ICH. Brain slices (3 mm) were obtained at 24 h after ICH, and their brain tissue homogenates of ipsilateral (I) and contralateral (C) regions were evaluated for MMP-9 activity using zymography. The relative changes (folds) were represented as the mean ± SD (n = 5). ###p < 0.001 compared with ipsilateral NS-intrastriatal injected with vehicle treatment group; * p < 0.05 compared with ipsilateral collagenase-intrastriatal injected with vehicle treatment group. The marker was represented as the positive control of MMP-9-mediated gelatinolysis from the medium of HT1080 cells. (B) The enzymatic units of collagenase VII (0.02 and 0.04 U) were used to evaluate the catalytic activity by gelatin zymography in vitro. EK100 (50 μM) and its vehicle (V) or the positive control (EDTA, 2 mM) and its vehicle (NS) were added to the reacting buffer with the manipulated gels as described in the Methods section. The relative changes (folds) were represented as the mean ± SD. ###p < 0.001 compared with the vehicle-treated condition in vitro.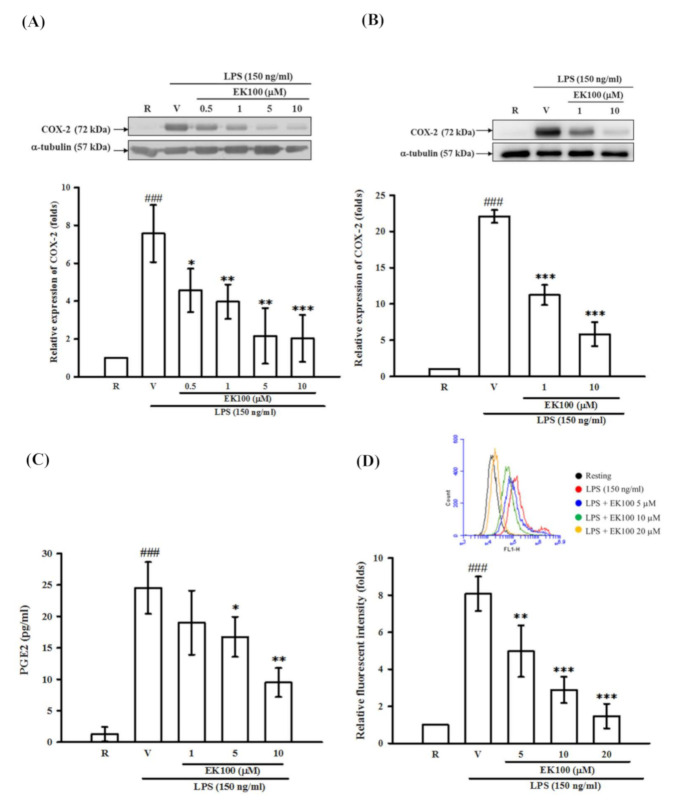
Figure 4
Effects of EK100 on the…
Figure 4
Effects of EK100 on the LPS-induced expression of the COX-2 protein in microglial…
Figure 4 Effects of EK100 on the LPS-induced expression of the COX-2 protein in microglial BV-2 and primary microglial cells, and productions of PGE2 and ROS. (A) BV-2 cells (2 × 10⁵ cells/mL) were dispensed on 6-well plates and treated with different concentrations of EK100 (0.5, 1, 5 and 10 μM) or vehicle (V) for 15 min before stimulation with LPS (150 ng/mL) for 24 h. Then, the cell lysates were obtained and analyzed for COX-2 protein expression by Western blots. The relative changes (folds) were represented as the mean ± SD (n = 3). (B) Primary microglial cells were dispensed on 6-well plates and treated with different concentrations of EK100 (1 and 10 μM) or vehicle for 15 min before stimulation with LPS (150 ng/mL) for 24 h. The relative changes (folds) of COX-2 protein expression were represented as the mean ± SD (n = 4). (C) PGE2 contents in conditioned media of BV-2 cells were evaluated by ELISA. The values were analyzed and represented as the mean ± SD (n = 3). (D) The BV-2 cells were pretreated with vehicle or EK100 (5, 10 and 20 μM) for 30 min, then stimulated with LPS (150 ng/mL) for 24 h. After stimulation, BV-2 cells were purchased and incubated with DCFH-DA for 40 min. Then, the cellular DCF fluorescent intensities were analyzed by flow cytometry (BD AccuriTM C6, NJ, USA). The results were analyzed and represented as the mean ± SD (n = 3). ###p < 0.001 compared with the resting group (R); * p < 0.05, ** p < 0.01, *** p < 0.001 compared with the vehicle under stimulation.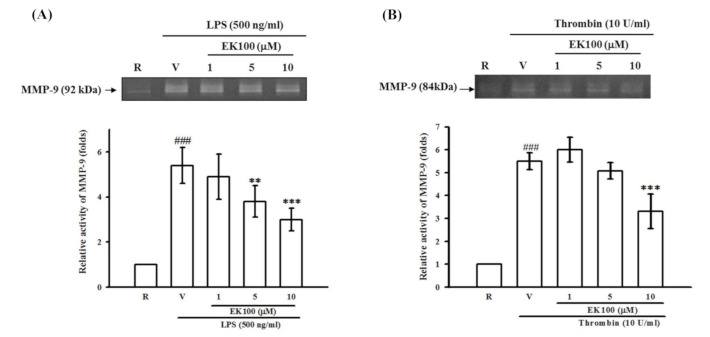
Figure 5
Effects of EK100 on LPS-…
Figure 5
Effects of EK100 on LPS- and thrombin-induced MMP-9 activation in astrocytes. Rat primary…
Figure 5 Effects of EK100 on LPS- and thrombin-induced MMP-9 activation in astrocytes. Rat primary astrocytes were pretreated with the vehicle (V) or EK100 (1, 5, and 10 μM), and stimulated with either (A) LPS (500 ng/mL) or (B) thrombin (10 U/mL) for 24 h as indicated. Cell-free supernatants were then assayed for MMP-9 activity by gelatin zymography. The relative multiples of densitometric data are shown as the mean ± SD (n = 3 and 4). ###p < 0.001 compared with the resting group (R); * p < 0.05, ** p < 0.01 compared with the vehicle under stimulation.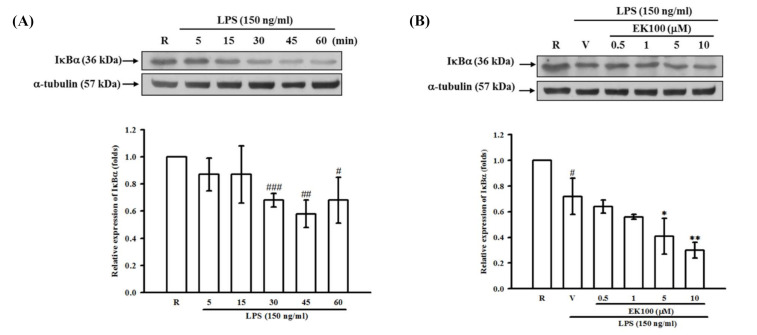
Figure 6
Effect of EK100 on the…
Figure 6
Effect of EK100 on the LPS-induced degradation of IκBα in BV-2 cells. Western…
Figure 6 Effect of EK100 on the LPS-induced degradation of IκBα in BV-2 cells. Western blot analyses were demonstrated (A) the time course of LPS-induced IκBα degradation in BV-2 cells. The cells (2 × 10⁵ cells/mL) were dispensed on 6-well plates and stimulated with LPS (150 ng/mL) for 5, 15, 30, 45, and 60 min as indicated, respectively. The data were shown as the mean ± SD (n = 3). #p < 0.05, ##p < 0.01, ###p < 0.001 compared with the resting group (R). (B) BV-2 cells (2 × 10⁵ cells/mL) were pretreated with EK100 (0.5, 1, 5 and 10 μM) or vehicle (V) for 15 min and stimulated with LPS (150 ng/mL) for 45 min. The cell lysates were obtained and analyzed with a specific IκBα antibody using Western blotting methods. The data were shown as the mean ± SD (n = 3). #p < 0.05 compared with the resting group (R); * p < 0.05, ** p < 0.01 compared with the vehicle under stimulation.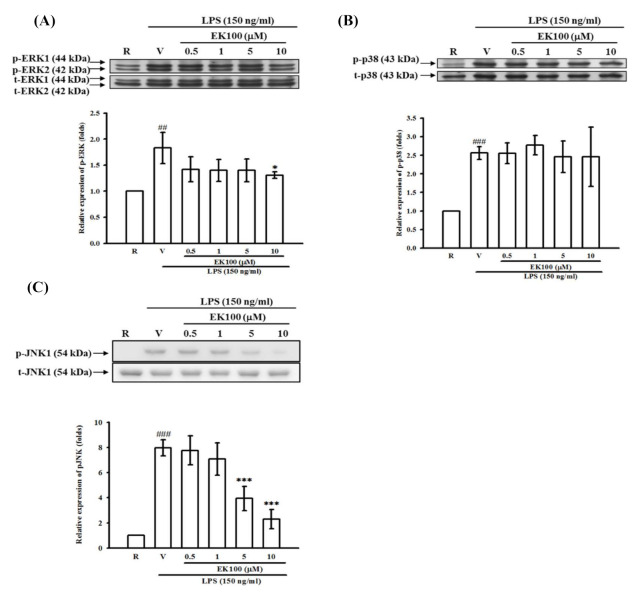
Figure 7
Effects of EK100 on LPS-induced…
Figure 7
Effects of EK100 on LPS-induced MAPK activation in BV-2 cells. BV-2 cells (2…
Figure 7 Effects of EK100 on LPS-induced MAPK activation in BV-2 cells. BV-2 cells (2 × 10⁵ cells/mL) were dispensed on 6-well plates and pretreated with EK100 (0.5, 1, 5, and 10 μM) or vehicle (V) for 15 min before stimulation with LPS (150 ng/mL) for the indicated time (30 min for ERK and p38; 45 min for JNK), respectively. The cell lysates were obtained and analyzed for phosphorylated ERK (1/2) (A), p38 (B), and JNK (C) MAPKs by Western blotting methods. The relative changes (folds) were represented as the mean ± SD (n = 4). ##p < 0.01, ###p < 0.001 compared with the resting group (R); * p < 0.05, ** p < 0.01 compared with the vehicle under stimulation.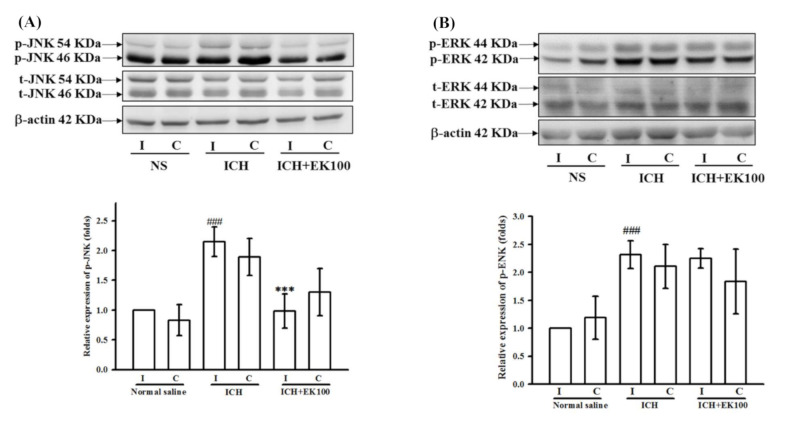
Figure 8
Effects of EK100 on the…
Figure 8
Effects of EK100 on the cerebral levels of p-JNK and p-ERK MAPK proteins…
Figure 8 Effects of EK100 on the cerebral levels of p-JNK and p-ERK MAPK proteins after ICH. C57BL/6 mice were administered vehicle or EK100 with an oral dosage of 30 mg/kg at 30 min after the intrastriatal injection of 0.02 U collagenase to induce ICH. Brain slices (3 mm) were obtained at 24 h after ICH, and their ipsilateral (I) and contralateral (C) regions were analyzed for the expression of p-JNK (A, n = 4) and p-ERK (B, n = 4) proteins by Western blots. The relative changes (folds) were represented as the mean ± SD. ###p < 0.001 compared with ipsilateral NS-intrastriatal injected with vehicle treatment group; *** p < 0.001 compared with ipsilateral collagenase-intrastriatal injected with vehicle treatment group (ICH). All figures (8)