Enhancing the Anticancer Activity of Antrodia cinnamomea in Hepatocellular Carcinoma Cells via Cocultivation With Ginger: The Impact on Cancer Cell Survival Pathways
Abstract
Antrodia cinnamomea (AC) is a medicinal fungal species that has been widely used traditionally in Taiwan for the treatment of diverse health-related conditions including cancer. It possesses potent anti-inflammatory and antioxidant properties in addition to its ability to promote cancer cell death in several human tumors. Our aim was to improve the anticancer activity of AC in hepatocellular carcinoma (HCC) through its cocultivation with ginger aiming at tuning the active ingredients. HCC cell lines, Huh-7 and HepG2 were used to study the in vitro anticancer activity of the ethanolic extracts of AC (EAC) alone or after the cocultivation in presence of ginger (EACG). The results indicated that the cocultivation of AC with ginger significantly induced the production of important triterpenoids and EACG was significantly more potent than EAC in targeting HCC cell lines. EACG effectively inhibited cancer cells growth via the induction of cell cycle arrest at G2/M phase and induction of apoptosis in Huh-7 and HepG2 cells as indicated by MTT assay, cell cycle analysis, Annexin V assay, and the activation of caspase-3. In addition, EACG modulated cyclin proteins expression and mitogen-activated protein kinase (MAPK) signaling pathways in favor of the inhibition of cancer cell survival. Taken together, the current study highlights an evidence that EACG is superior to EAC in targeting cancer cell survival and inducing apoptotic cell death in HCC. These findings support that EACG formula can serve as a potential candidate for HCC adjuvant therapy.
Figures 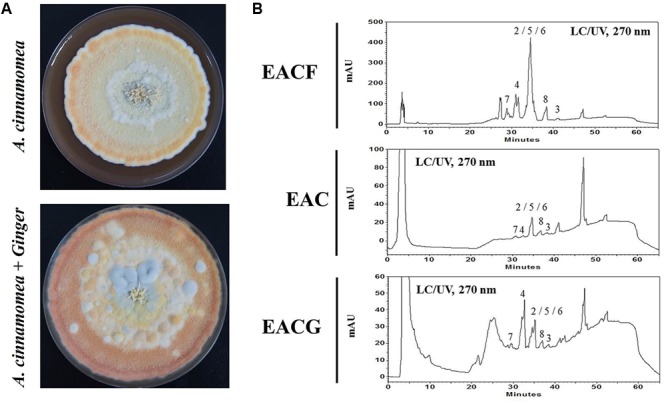
FIGURE 1
Antrodia cinnamomea incubation and LC–UV…FIGURE 1
Antrodia cinnamomea incubation and LC–UV chromatogram. (A) A. cinnamomea was incubated with or… FIGURE 1 Antrodia cinnamomea incubation and LC–UV chromatogram. (A)A. cinnamomea was incubated with or without 1% ginger for 50 days. The crude extracts were isolated using ethanol. (B) HPLC analysis of EACF, EAC and EACG extracts by UV at 270 nm. The peaks numbering corresponds to the natural products shown in Table 1.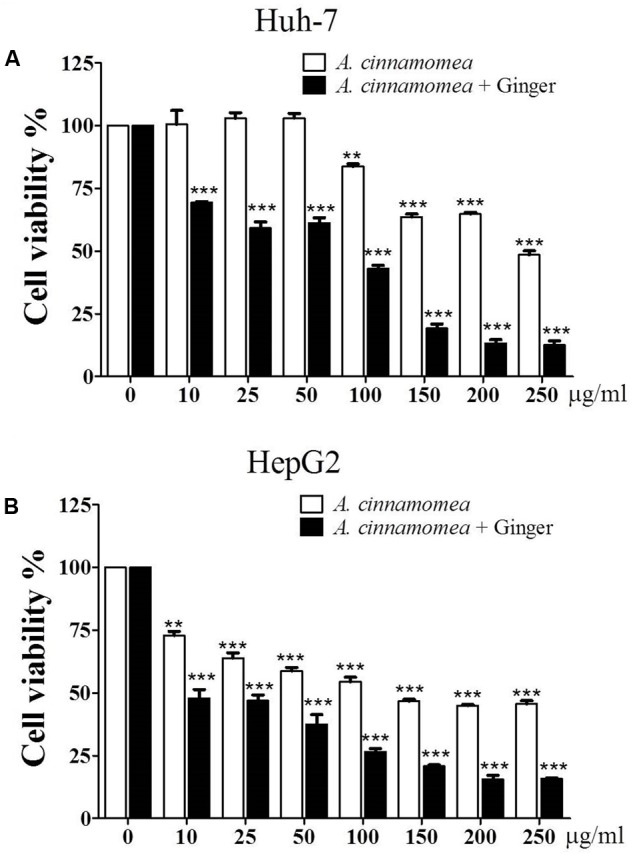
FIGURE 2
Effects of EAC and EACG…
FIGURE 2
Effects of EAC and EACG on the viability of Huh-7 and HepG2 cells.…
FIGURE 2 Effects of EAC and EACG on the viability of Huh-7 and HepG2 cells. (A,B) MTT assay results showing the inhibition of Huh-7 and HepG2 cell viability by EAC and EACG treatment. Cells were exposed to EAC and EACG in the indicated concentrations in 10% FBS-supplemented DMEM for 48 h. Data represent the mean ± SD (n = 6). Significant difference between the control and experimental groups are marked with asterisks (∗∗P < 0.01; ∗∗∗P < 0.001).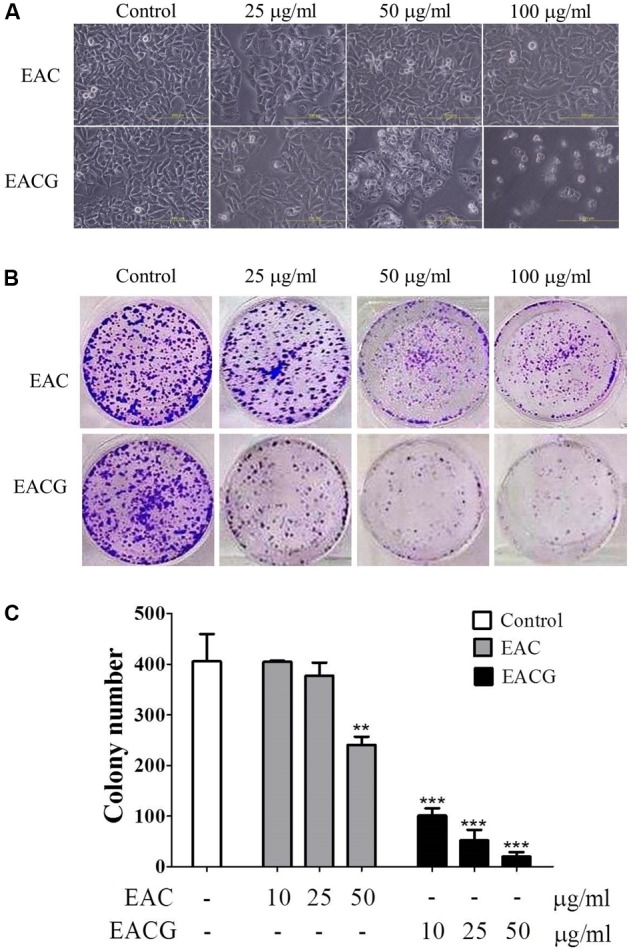
FIGURE 3
EACG changed cell morphology and…
FIGURE 3
EACG changed cell morphology and colony formation in Huh-7 cells. (A) Morphological changes…
FIGURE 3 EACG changed cell morphology and colony formation in Huh-7 cells. (A) Morphological changes in Huh-7 cells after treatment with EAC or EACG for 48h (photography under phase-contrast magnification). (B) Colony formation assay of Huh-7 cells treated with EAC and EACG. Cells were stained by crystal violet after 14 days. (C) Bar chart presenting the average number of colonies of three independent experiments. Bars are means ± SD (n = 3). Significant difference between the control and experimental groups are marked with asterisks (∗∗P < 0.01; ∗∗∗P < 0.001).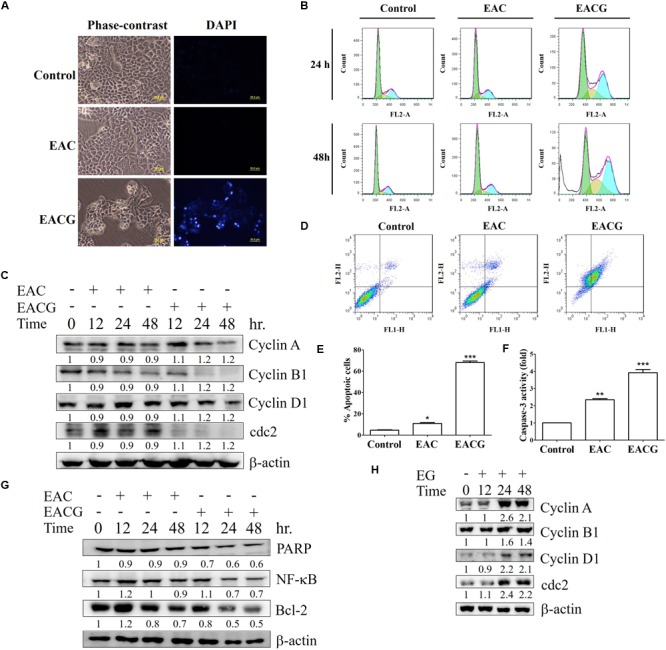
FIGURE 4
EACG induced G2/M arrest and…
FIGURE 4
EACG induced G2/M arrest and cell apoptosis Huh-7 cells. (A) Huh-7 cells were…
FIGURE 4 EACG induced G2/M arrest and cell apoptosis Huh-7 cells. (A) Huh-7 cells were treated with 50 μg/ml EAC or EACG for 48 h, the morphological changes were analyzed by fluorescence microscopy with DAPI staining. (B) Cell cycle analysis of Huh-7 cells treated with 50 μg/ml EAC or EACG in 10% FBS–containing DMEM for 24 and 48 h. The cells cycle was analyzed by flow cytometry after staining with propidium iodide. (C) Western blot analysis of Huh-7 cells treated with EAC or EACG for the indicated time points. Cell lysates were resolved and blotted with antibodies against cyclin A, cyclin B1, cyclin D1, cdc2, and β-actin. (D) Flow cytometric analysis of the apoptosis in Huh-7 cells treated with EAC or EACG at 50 μg/ml concentration after staining with fluorescein-conjugated Annexin V and propidium iodide. (E) Bar chart presenting the percent of cell numbers in the respective quadrants. (F) Caspase-3 activity in Huh-7 cells treated with EAC or EACG at 50 μg/ml concentration for 48 h. Columns, mean; bars, SD (n = 3). Significant difference between the control and experimental groups are marked with asterisks (∗P < 0.05; ∗∗P < 0.01; ∗∗∗P < 0.001). (G) The expression of apoptosis-associated protein was determined and blotted with antibodies against PARP, Bcl-2, Bax, MCL-1, Bcl-xL and β-actin. (H) Western blot analysis of Huh-7 cells treated with EG for the indicated time points. Cell lysates were resolved and blotted with antibodies against cyclin A, cyclin B1, cyclin D1, cdc2, and β-actin.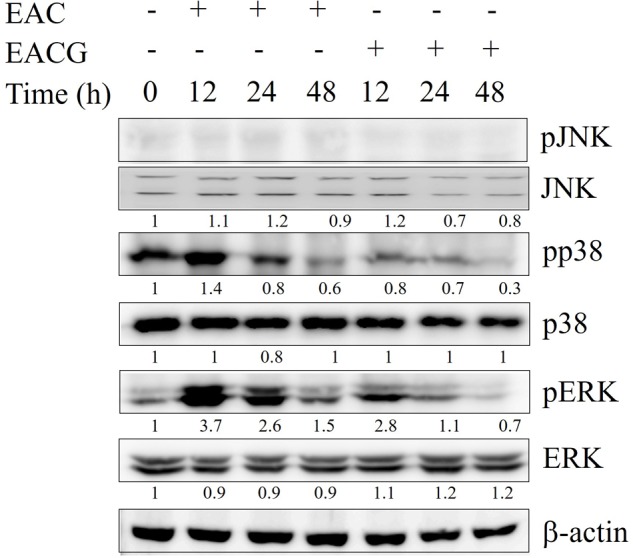
FIGURE 5
Modulation of MAPK signaling pathways…
FIGURE 5
Modulation of MAPK signaling pathways by EAC and EACG. Western blot analysis of…
FIGURE 5 Modulation of MAPK signaling pathways by EAC and EACG. Western blot analysis of the time-dependent effects of EAC or EACG on the MAPK signaling pathways. Huh-7 cells were exposed to 50 μg/ml EAC or EACG in 10% FBS–supplemented DMEM for the indicated time points. The total lysates were resolved and blotted by antibodies against ERK1/2, p-ERK1/2, p-JNK, JNK, p38 and pp38.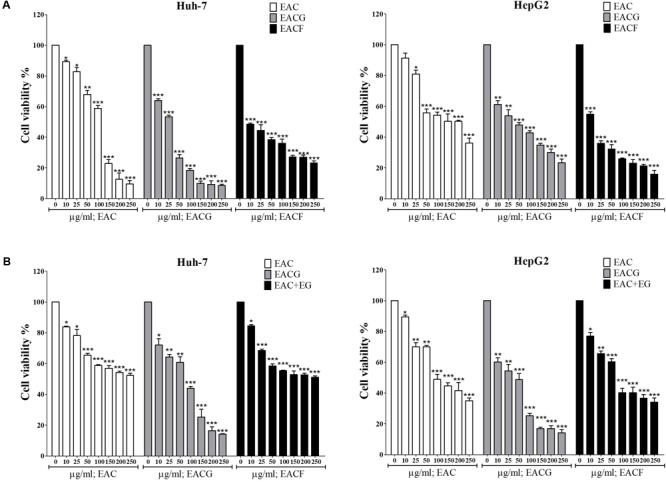
FIGURE 6
The effect of A. cinnamomea…
FIGURE 6
The effect of A. cinnamomea fruiting body (EACF) on cancer cell viability. (A)…
FIGURE 6 The effect of A. cinnamomea fruiting body (EACF) on cancer cell viability. (A) Huh-7 cells were exposed to EAC, EACG, and EACF at the indicated concentrations in 10% FBS-supplemented DMEM for 48 h, and cell viability was assessed by MTT assays. Points, mean; bars, SD (n = 6). (B) The effect of EAC combined with EG on Hhuh-7 and HepG2 cell viability. The cells were exposed to EAC, EACG or EAC with EG at 0, 10, 25, 50, 100, 150, 200, 250 μg/ml concentrations. The cell viability was determined by MTT assays. Significant difference between the control and experimental groups are marked with asterisks (∗P < 0.05; ∗∗P < 0.01; ∗∗∗P < 0.001).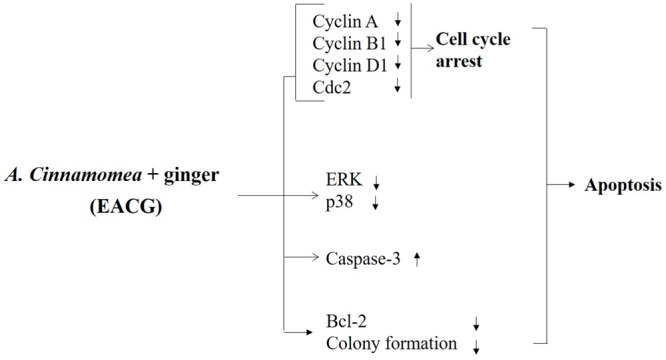
FIGURE 7
Proposed diagrams depicting effect of…
FIGURE 7
Proposed diagrams depicting effect of EACG on cell cycle, MAP kinases, and apoptosis…
FIGURE 7 Proposed diagrams depicting effect of EACG on cell cycle, MAP kinases, and apoptosis signaling pathway. The modification of secondary metabolites of AC was induced by co-incubation with ginger. The interplay between these signaling networks at different cellular levels results in the ability of EACG to induce subG1/G2M arrest and apoptosis in Huh-7 cells. All figures (7)