EK100 and Antrodin C Improve Brain Amyloid Pathology in APP/PS1 Transgenic Mice by Promoting Microglial and Perivascular Clearance Pathways
Abstract
Alzheimer's disease (AD) is characterized by the deposition of β-amyloid peptide (Aβ). There are currently no drugs that can successfully treat this disease. This study first explored the anti-inflammatory activity of seven components isolated from Antrodia cinnamonmea in BV2 cells and selected EK100 and antrodin C for in vivo research. APPswe/PS1dE9 mice were treated with EK100 and antrodin C for one month to evaluate the effect of these reagents on AD-like pathology by nesting behavior, immunohistochemistry, and immunoblotting. Ergosterol and ibuprofen were used as control. EK100 and antrodin C improved the nesting behavior of mice, reduced the number and burden of amyloid plaques, reduced the activation of glial cells, and promoted the perivascular deposition of Aβ in the brain of mice. EK100 and antrodin C are significantly different in activating astrocytes, regulating microglia morphology, and promoting plaque-associated microglia to express oxidative enzymes. In contrast, the effects of ibuprofen and ergosterol are relatively small. In addition, EK100 significantly improved hippocampal neurogenesis in APPswe/PS1dE9 mice. Our data indicate that EK100 and antrodin C reduce the pathology of AD by reducing amyloid deposits and promoting nesting behavior in APPswe/PS1dE9 mice through microglia and perivascular clearance, indicating that EK100 and antrodin C have the potential to be used in AD treatment.
Figures 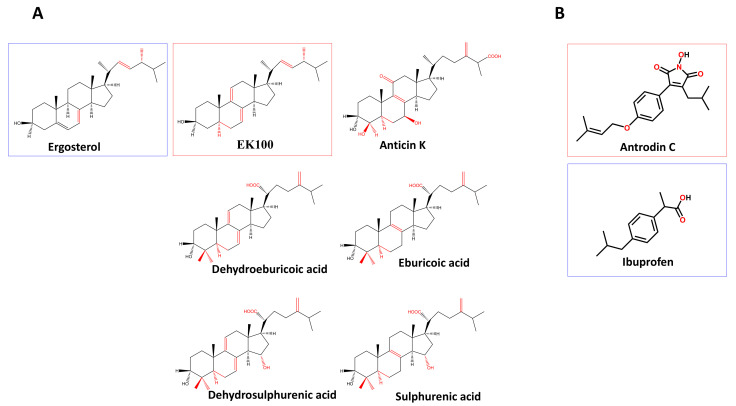
Figure 1
The structure of the compounds…
Figure 1
The structure of the compounds used in this study. ( A ) The…
Figure 1 The structure of the compounds used in this study. (A) The structure of EK100 (Ergosta-7,9(11),22-trien-3β-ol), ergosterol (Ergosta-5,7,22-trien-3β-ol), anticin K (3α,4β,7β-trihygroxy-4α-methylergosta-8,24(28)-dien-11-on-26-oic acid), dehydroeburicoic acid ((2R)-2-[(3S,5R,10S,13R,14R,17R)-3-hydroxy-4,4,10,13,14-pentamethyl-2,3,5,6,12,15,16,17-octahydro-1H-cyclopenta[a]phenanthren-17-yl]-6-methyl-5-methylideneheptanoic acid), eburicoic acid ((2R)-2-[(3S,5R,10S,13R,14R,17R)-3-hydroxy-4,4,10,13,14-pentamethyl-2,3,5,6,7,11,12,15,16,17-decahydro-1H-cyclopenta[a]phenanthren-17-yl]-6-methyl-5-methylideneheptanoic acid), dehydrosulfurenic acid ((2R)-2-[(3S,5R,10S,13R,14R,15S,17R)-3,15-dihydroxy-4,4,10, 13,14-pentamethyl-2,3,5,6,11,12,15,16,17-decahydro-1H-cyclopenta[a] phenanthren-17-yl]-6-methyl-5-methylideneheptanoic acid), and sulfurenic acid ((2R)-2-[(3S,5R,10S,13R,14R,15S,17R)-3,15-dihydroxy-4,4,10,13,14-pentamethyl-2,3,5,6,7, 11,12,15,16,17-decahydro-1H-cyclopenta[a]phenanthren-17-yl]-6-methyl-5-methyl-ideneheptanoic acid). (B) The structure of antrodin C (3-isobutyl-4-[4-(3-methyl-2-butenyloxy)phenyl]-1H-pyrrol-1-ol-2,5-dione) and ibuprofen (isobutylphenyl-propionic acid). The red squares indicate the bioactive compounds and the blue squares indicate the control compounds.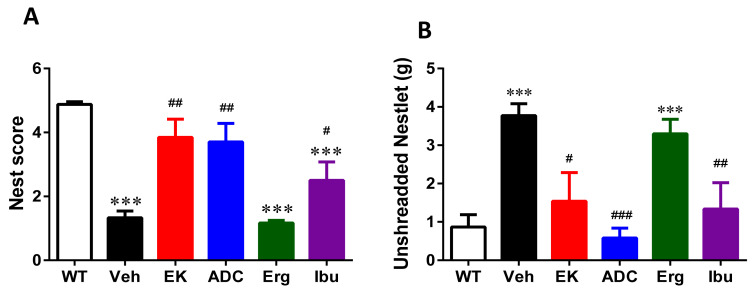
Figure 2
EK100, antrodin C, and ibuprofen…
Figure 2
EK100, antrodin C, and ibuprofen ameliorate nesting behavior deficits in APP/PS1 mice. APP/PS1…
Figure 2 EK100, antrodin C, and ibuprofen ameliorate nesting behavior deficits in APP/PS1 mice. APP/PS1 transgenic mice were orally administered with vehicle (Veh) or EK100 (EK), antrodin C (ADC), ergosterol (Erg), and ibuprofen (Ibu) (30 mg⋅kg−1⋅day−1, n = 6 each). Nesting tasks were performed at 30 days post administration. The image in wild-type (WT) mice (n = 6) is also compared. Bar graphs show the results from the nesting task’s nest score (A) and unshredded Nestlet (B) from nesting task. The results are the mean ± S.E.M. Significant differences between WT group and the other groups are indicated by ***, p < 0.001. Significant differences between Veh group and reagent-treated groups are indicated by #, p < 0.05; ##, p < 0.01; ###, p < 0.001.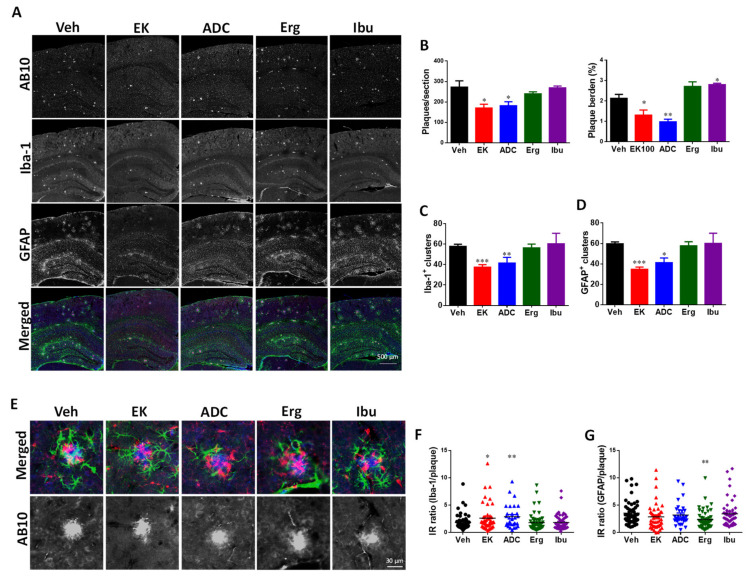
Figure 3
EK100 and antrodin C reduce…
Figure 3
EK100 and antrodin C reduce amyloid plaque load, number of glial clusters, and…
Figure 3 EK100 and antrodin C reduce amyloid plaque load, number of glial clusters, and plaque-related glial activation in APP/PS1 mice. APP/PS1 transgenic mice orally administered vehicle (Veh) or EK100 (EK), antrodin C (ADC), ergosterol (Erg), and ibuprofen (Ibu) (30 mg⋅kg−1⋅day−1, each n = 6) 1 months, and then amyloid plaques, microglia, and astrocytes were immunostained with AB10, Iba-1, and GFAP antibodies, respectively. (A). The representative fluorescent images of AB10 (blue in the merged panel), Iba-1 (red in the merged panel), and GFAP (green in the merged panel) are shown. Scale bar: 500 μm. (B–D), The number and burden of AB10-stained plaque (B) and the number of Iba-1+ clusters (C) and GFAP+ clusters (D) in cerebral hemisphere are counted and shown. The results are the mean ± S.E.M. Significant differences between the Veh group and reagent-treated groups are indicated by *, p < 0.05; **, p < 0.01; ***, p < 0.001. (E). The representative fluorescent images of glial clusters immunostained with AB10 (blue in the merged panel), Iba-1 (red in the merged panel), and GFAP (green in the merged panel) antibodies are shown. Scale bar: 30 μm. (F,G). The immunointensity (IR) ratio of Iba-1 to AB10 (F) and GFAP to AB10 (G) are calculated and shown. The results are the mean ± S.E.M. Significant differences between Veh group and reagent-treated groups are indicated by *, p < 0.05; **, p < 0.01.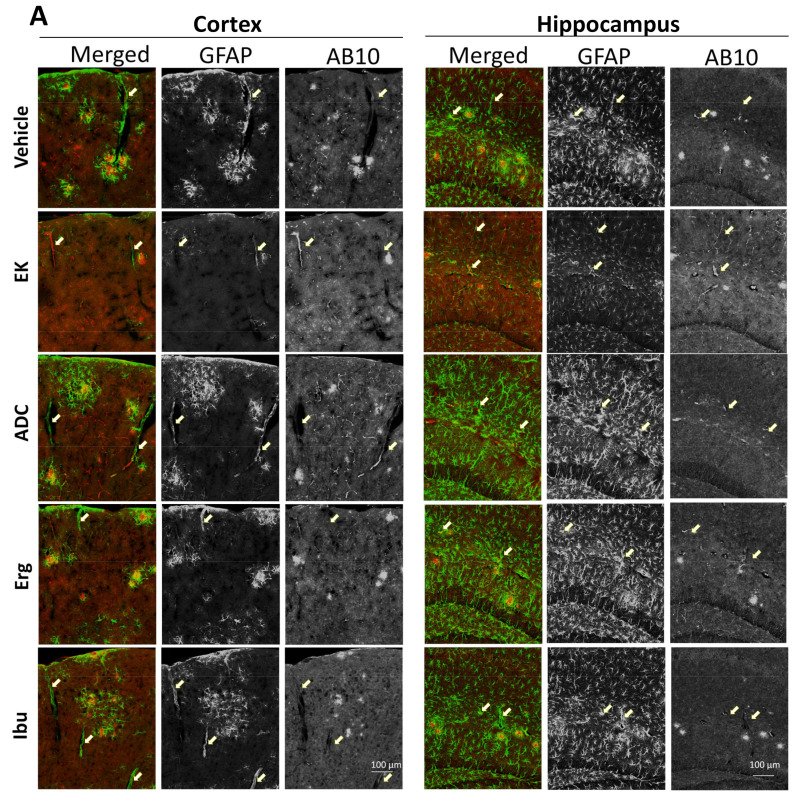
Figure 4
EK100 and antrodin C increase…
Figure 4
EK100 and antrodin C increase perivascular Aβ deposition in APP/PS1 mice. APP/PS1 transgenic…
Figure 4 EK100 and antrodin C increase perivascular Aβ deposition in APP/PS1 mice. APP/PS1 transgenic mice orally administered vehicle (Veh) or EK100 (EK), antrodin C (ADC), ergosterol (Erg), and ibuprofen (Ibu) (30 mg⋅kg−1⋅day−1, each n = 6) for 1 months, and then astrocytes and microglia were immunostained GFAP and Iba-1 antibodies, respectively. (A) The representative immunostaining images of GFAP and AB10 in the cortex and hippocampus are shown. Scale bar: 100 μm. Arrows indicate the representative perivascular area. (B). The percentage of perivascular Aβ deposition to total Aβ deposition is calculated by MetaMorph image analysis software and shown. The results are the mean ± S.E.M. Significant differences between the Veh group and the other groups are indicated by *, p < 0.05; **, p < 0.01.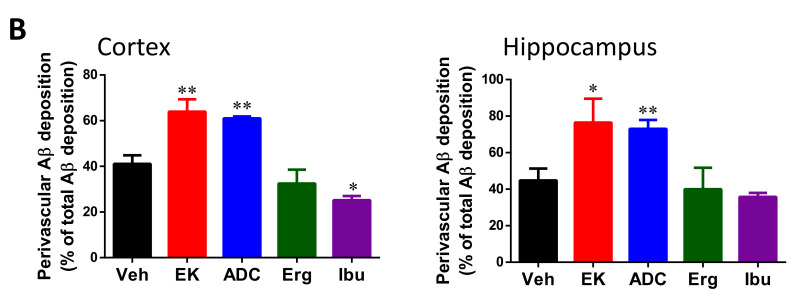
Figure 4
EK100 and antrodin C increase…
Figure 4
EK100 and antrodin C increase perivascular Aβ deposition in APP/PS1 mice. APP/PS1 transgenic…
Figure 4 EK100 and antrodin C increase perivascular Aβ deposition in APP/PS1 mice. APP/PS1 transgenic mice orally administered vehicle (Veh) or EK100 (EK), antrodin C (ADC), ergosterol (Erg), and ibuprofen (Ibu) (30 mg⋅kg−1⋅day−1, each n = 6) for 1 months, and then astrocytes and microglia were immunostained GFAP and Iba-1 antibodies, respectively. (A) The representative immunostaining images of GFAP and AB10 in the cortex and hippocampus are shown. Scale bar: 100 μm. Arrows indicate the representative perivascular area. (B). The percentage of perivascular Aβ deposition to total Aβ deposition is calculated by MetaMorph image analysis software and shown. The results are the mean ± S.E.M. Significant differences between the Veh group and the other groups are indicated by *, p < 0.05; **, p < 0.01.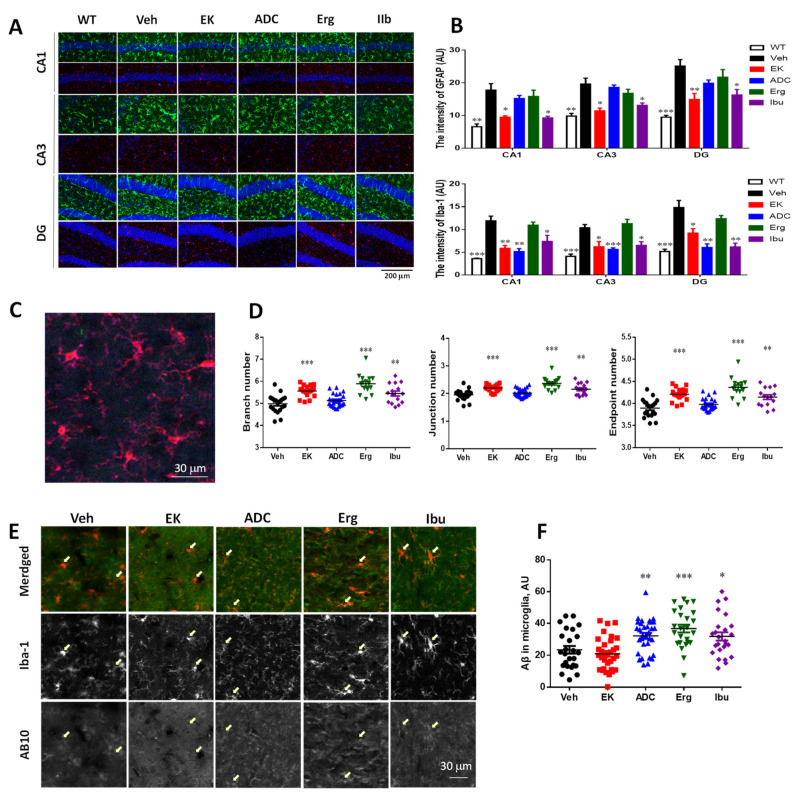
Figure 5
EK100 reduce non-clustered glial activation…
Figure 5
EK100 reduce non-clustered glial activation in APP/PS1 mice. APP/PS1 transgenic mice orally administered…
Figure 5 EK100 reduce non-clustered glial activation in APP/PS1 mice. APP/PS1 transgenic mice orally administered vehicle (Veh) or EK100 (EK), antrodin C (ADC), ergosterol (Erg), and ibuprofen (Ibu) (30 mg⋅kg−1⋅day−1, each n = 6) for 1 month, and then astrocytes and microglia were immunostained with GFAP and Iba-1 antibodies, respectively. (A,B) The representative immunostaining images of GFAP (green) and Iba-1 (red) without being associated with plaque in Cornu Amonis (CA)1, CA3, dentate gurus (DG) are shown in (A). The image in wild-type (WT) mice (n = 6) is also compared. Scale bar: 200 μm. The level of GFAP and Iba-1 in the CA1, CA3, and DG are calculated by MetaMorph image analysis software and shown in (B). The results are the mean ± S.E.M. Significant differences between the Veh group and the other groups are indicated by *, p < 0.05; **, p < 0.01; ***, p < 0.001. (C,D). The representative image of Iba-1 (red) not associated with plaque is shown in (C). The branch number, junction number, and end point number of Iba-1 immunostained microglia are calculated by FIJI ImageJ software. The results are the mean ± S.E.M. Significant differences between the Veh group and the other groups are indicated by **, p < 0.01; ***, p < 0.001. (E,F). The representative immunostaining images of Iba-1 (red) and Aβ not associated with plaque in the cortex are shown in (E). Arrows indicate the representative microglia. The intracellular Aβ in microglia are calculated by MetaMorph image analysis software and shown in (F). The results are the mean ± S.E.M. Significant differences between the Veh group and the other groups are indicated by *, p < 0.05; **, p < 0.01; ***, p < 0.001.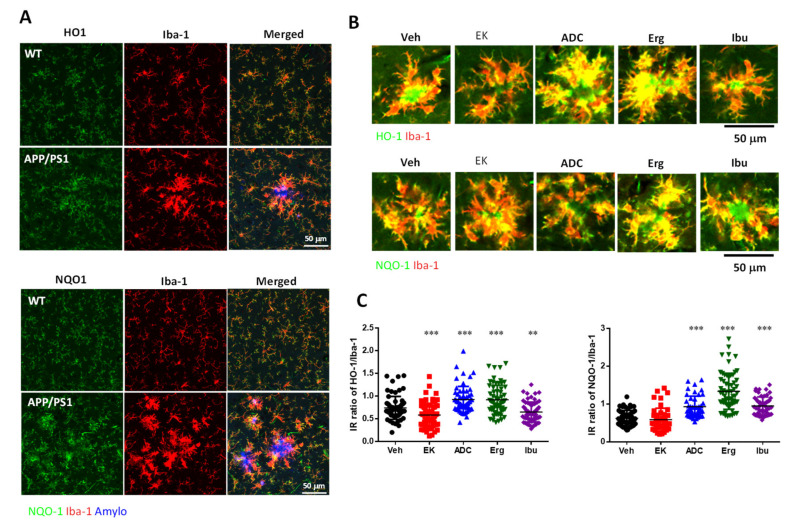
Figure 6
Antrodin C, but not EK100,…
Figure 6
Antrodin C, but not EK100, promotes HO-1 in APP/PS1 mice. ( A –…
Figure 6 Antrodin C, but not EK100, promotes HO-1 in APP/PS1 mice. (A–E). APP/PS1 transgenic mice orally administered vehicle (Veh) or EK100 (EK), antrodin C (ADC), ergosterol (Erg), and ibuprofen (Ibu) (30 mg⋅kg−1⋅day−1, each n = 6) for 1 month. The representative images of HO-1 (green in upper panel) and NQO1 (green in lower panel) in Iba-1+ microglia (red) of WT mice and APP/PS1 transgenic mice are shown in (A). Amyloid plaques were stained with Amylo-Glo (blue). Scale bar: 50 μm. The representative images of HO-1 (green in upper panel) and NQO1 (green in lower panel) in Iba-1+ microglia (red) of APP/PS1 transgenic mice are shown in (B). Immunointensity (IR) ratio of HO-1/Iba-1 and NQO-1/Iba-1 are calculated and shown in (C). Representative immunoblots of Nrf2 and HO-1 and β-actin of cortical homogenate are shown in (D). The protein level in wild-type (WT) mice (n = 6) is also compared. The ratio of Nrf2 and HO-1 to β-actin is presented as a percentage of the WT group (E). (F,G) APP/PS1 transgenic mice orally administered vehicle (Veh) or EK100 (EK) and antrodin C (ADC) (30 mg⋅kg−1⋅day−1, each n = 6) for 1 months. The representative images of Nrf2 (green in merged panel) and AB10 (red in merged panel) in neurons of WT mice and APP/PS1 transgenic mice are shown in (F). Nuclei staining using Hoechst 33258 (blue). Scale bar: 20 μm. Immunointensity (IR) of Nrf2 and AB10 were calculated and shown in (G). The results are the mean ± S.E.M. Significant differences between the Veh group and the other groups are indicated by *, p < 0.05; **, p < 0.01; ***, p < 0.001.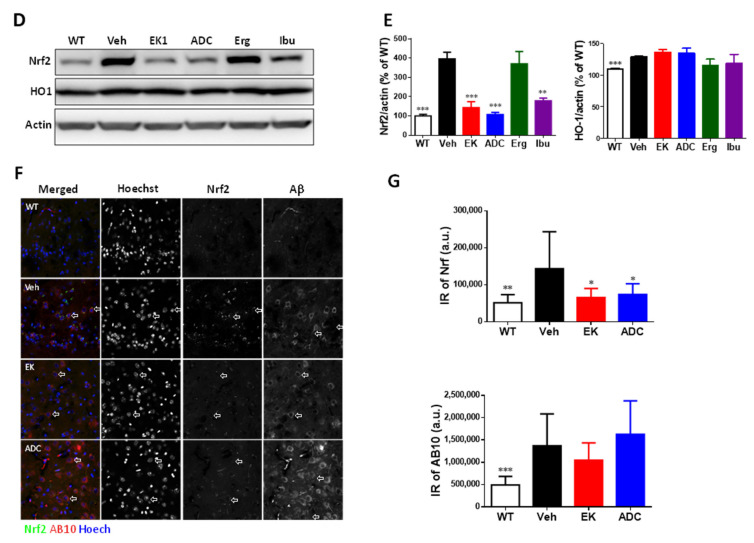
Figure 6
Antrodin C, but not EK100,…
Figure 6
Antrodin C, but not EK100, promotes HO-1 in APP/PS1 mice. ( A –…
Figure 6 Antrodin C, but not EK100, promotes HO-1 in APP/PS1 mice. (A–E). APP/PS1 transgenic mice orally administered vehicle (Veh) or EK100 (EK), antrodin C (ADC), ergosterol (Erg), and ibuprofen (Ibu) (30 mg⋅kg−1⋅day−1, each n = 6) for 1 month. The representative images of HO-1 (green in upper panel) and NQO1 (green in lower panel) in Iba-1+ microglia (red) of WT mice and APP/PS1 transgenic mice are shown in (A). Amyloid plaques were stained with Amylo-Glo (blue). Scale bar: 50 μm. The representative images of HO-1 (green in upper panel) and NQO1 (green in lower panel) in Iba-1+ microglia (red) of APP/PS1 transgenic mice are shown in (B). Immunointensity (IR) ratio of HO-1/Iba-1 and NQO-1/Iba-1 are calculated and shown in (C). Representative immunoblots of Nrf2 and HO-1 and β-actin of cortical homogenate are shown in (D). The protein level in wild-type (WT) mice (n = 6) is also compared. The ratio of Nrf2 and HO-1 to β-actin is presented as a percentage of the WT group (E). (F,G) APP/PS1 transgenic mice orally administered vehicle (Veh) or EK100 (EK) and antrodin C (ADC) (30 mg⋅kg−1⋅day−1, each n = 6) for 1 months. The representative images of Nrf2 (green in merged panel) and AB10 (red in merged panel) in neurons of WT mice and APP/PS1 transgenic mice are shown in (F). Nuclei staining using Hoechst 33258 (blue). Scale bar: 20 μm. Immunointensity (IR) of Nrf2 and AB10 were calculated and shown in (G). The results are the mean ± S.E.M. Significant differences between the Veh group and the other groups are indicated by *, p < 0.05; **, p < 0.01; ***, p < 0.001.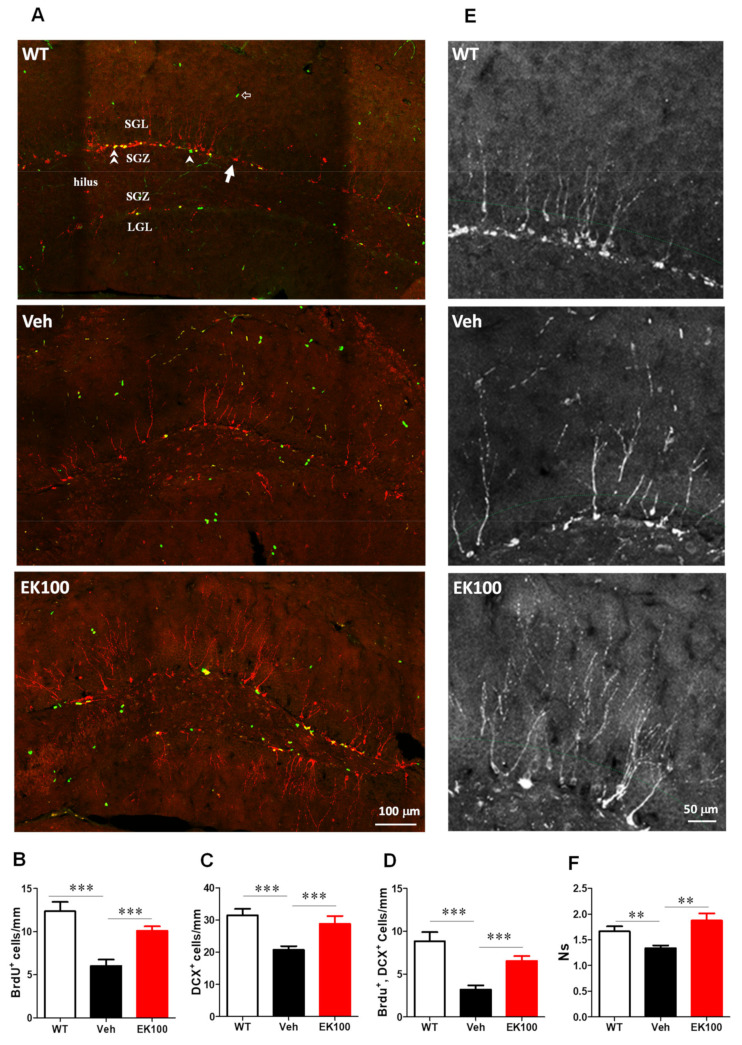
Figure 7
EK100 promotes hippocampal neurogenesis in…
Figure 7
EK100 promotes hippocampal neurogenesis in APP/PS1 mice. APP/PS1 transgenic mice orally administered with…
Figure 7 EK100 promotes hippocampal neurogenesis in APP/PS1 mice. APP/PS1 transgenic mice orally administered with vehicle (Veh) or EK100 (30 mg⋅kg−1⋅day−1, n = 6 each) for 1 month. Wild-type (WT) mice were used as non-transgenic control. Hippocampal neurogenesis was detected by immunohistochemical staining with doublecortin antibody (DCX, red) and BrdU antibody (green). The representative images of the dentate gyrus are shown in (A). Arrow indicated DCX-labeled newly born neuron; arrow head indicates proliferating type 2 neuroprogenitor; double arrow head indicates the newly born neuron immediately after proliferation; hollow arrow indicates proliferating cells other than the neuroprogenitor. ML, molecular layer; UGL, upper blade granular cell layer; SGZ, subgranular zone; LGL, lower blade granular cell layer. Scale bar: 100 μm. Panels B–D show the number/mm SGZ of BrdU positive cells (BrdU+, B); DCX-positive cell (DCX+, C) and the cells with double labeling (BrdU+, DCX+, D). (E) The representative immunostaining images of the upper blade dentate gyrus area are shown. Scale bar: 50 μm. Secondary dendrites of the DCX+ cells are counted along the middle of granular cell layer (GCL, green dashed line). (F) The dendritic complexity was analyzed by laminar quantification. The branch ratio of secondary dendrites of DCX+ cells were shown. Dendrites of DCX+ cells are counted along the middle of the GCL. The results are the mean ± S.E.M. Significant differences between the Veh group and the other groups. **, p < 0.01; ***, p < 0.001. All figures (9)